Chris Game
It’s easy to claim, but there are times when I miss not having classes of students to endeavour to entertain – partly because, at least from a distance, it can seem rather easier now than back when I had that responsibility.
One gift I’d certainly have used during this year’s exam revision period was the YouTube rap video made by T-Dawg – aka Broadland and South Norfolk Councils’ Managing Director, Trevor Holden – ‘reminding’ intending voters in the May local elections to take photo ID with them to the polling station. Like the whole topic, the video received a mixed reception, but it certainly got my vote (sorry about that!) as an introduction to this split-blog’s attempted overview of the profusion of recently released Voter ID material. I’ve at least flick-read most of it, so you won’t have to worry about not doing so.
First, though, an additional declaration of personal interest, referring back to that opening paragraph. My students weren’t, of course, learning directly about ‘political literacy’, but high on my short list of ‘research stats I’ve managed to remember for more than a few weeks’ was the depressing finding in the All-Party Parliamentary Group (APPG) on Political Literacy’s 2021 report that, of a 3,300 sample of secondary school teachers in England, only 1% [felt] “fully prepared” to teach courses aimed at developing young people’s political literacy.
The ”fully”, omitted in some reports, was in the question and doubtless partly explains the dispiriting response. But anyway the finding was highlighted by the APPG, led directly to the creation of the social enterprise Shout Out UK (SOUK), and these two bodies’ influence is clearly evident in some of the Electoral Commission’s recommendations for more focused information and awareness raising.
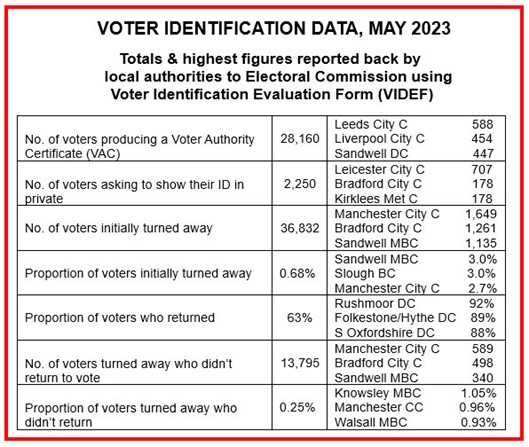
There had, of course, been earlier assessments of May’s elections – principally the Electoral Commission’s Interim Analysis in mid-June, reporting the anonymised returns from the Voter Identification Evaluation Forms (VIDEF) that Returning Officers were required to complete (see table below), plus results of three YouGov pre- and post-election public awareness surveys of between 1,700 and 3,700 adults each.
This first, stat-heavy part of the blog will present, in highly summarised form, some of the key data, with the second covering some of the more recent interpretative contributions – including that of the All-Party Parliamentary Group, from which I’ve appropriated the blog’s slightly giveaway title.
First, some scene-setting stats, taken from the final report. The total electorate was 27.3 million, ballot box turnout 32%. For the record, Labour took 33% of the vote and control of 70 councils; Conservatives 28.6% and 33; Lib Dems 37% and 20. 5.2 million postal ballots were initially issued to 19% of the electorate, 3.5 million (67%) of which were returned, of which 89,000 were rejected, mainly for missing or mismatched signatures or dates of birth. OK, it’s only 2.6%, but, after making the effort, it was higher than I might have guessed.
Key findings from the analysis included that:
- Immediately post-election, in areas with elections, 92% of people in England were aware they now needed to show photo ID to vote at a polling station. They weren’t asked, however, if that awareness extended to knowing that they couldn’t obtain ID – e.g. the Voter Authority Certificate (VAC) – on polling day itself.
- Awareness was significantly lower (74%) among those who didn’t already have an accepted form of ID – and, unsurprisingly, among youngest age groups (82% for 18-24 year olds), Black and minority communities (82%), etc.
- Approximately 89,500 people applied for a VAC before the 25 April deadline, some 28,000 certificates being subsequently used – i.e. under one-third of the 250,000 to 350,000 estimated likely not to have any other acceptable ID.
- At least 0.25% of people (c.14,000) who had tried to vote at a polling station were not issued with a ballot paper because of the ID requirement, but this excludes those who reacted to the ID reminder before they could be recorded in the data – thereby inevitably underestimating, as do the post-election analyses generally, the actual impact of the voter ID requirement.
This was essentially the ‘headline’ picture we had to content ourselves with over the summer, until quite suddenly, come September, there was a whole lot more – and it seems logical, if not strictly chronological, to start with the Electoral Commission’s full-scale Voter ID Demographic Analysis Research. The analysis aimed to identify patterns in areas where relatively higher or lower proportions of intending voters were turned away from polling stations due to the new ID requirement.
18 authorities with apparently relatively socioeconomically diverse wards were selected, including the West Midlands’ Coventry and Sandwell – the latter being the sampled borough with the nationally highest “initially turned away” percentage of 3%. The Census-based ‘proxy’ variables measured were unemployment, ethnicity, household deprivation, and social renters.
Hyper-summarising, the analysis suggested there was “a potential linear relationship” between each selected socio-economic variable and the proportion of voters initially turned away and those who didn’t return to vote. These results are obviously tabulated, but also graphed, as illustrated in what is described as the “moderate relationship” between ethnicity and the proportions initially turned away.
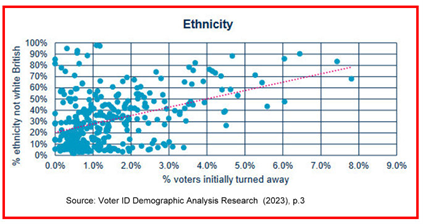
Overall, 13 of the 18 authorities showed at least a moderate relationship between the independent variables and the proportion of voters initially turned away, and 6 exhibited “strong relationships between one or more independent variables”. Strongest correlations were with areas having a high proportion of non-white British individuals, higher deprivation, and higher unemployment.
Following this specifically Voter ID-focussed report, the Electoral Commission had published in June its overall Report on the May 2023 Local Elections in England, which it updated in early September. It made nine main recommendations, including increasing awareness of the support available for disabled voters, and improving data collection at polling stations.
Four, however, related specifically to voter ID: review the list of accepted ID; improve access to the Voter Authority Certificate (see above); improve options for voters who don’t have or can’t access any accepted form of accepted ID – e.g. allowing ‘attestation’ by a named and verified elector; and polling station staff to continue to collect voter ID impact data at future elections.
Which brings us to about mid-September, already some way over this blog’s preferred length, and quite the wrong time, therefore, to address the “poisoned cure” and other reactions to these primarily statistical analyses – which will follow, with luck, fairly shortly.

Chris Game is an INLOGOV Associate, and Visiting Professor at Kwansei Gakuin University, Osaka, Japan. He is joint-author (with Professor David Wilson) of the successive editions of Local Government in the United Kingdom, and a regular columnist for The Birmingham Post.
