Chris Game
As I’ve aged, I’ve become ever keener to find mnemonic tricks that might help my increasingly faulty memory to recall potentially useful stuff – like, this week, key dates in the history of women’s suffrage. At some point somewhere during the extended celebrations of International Women’s Day (IWD) beyond March 8th, for example, there’s almost bound to be some reference to women gaining (or, in Afghanistan, losing/regaining?) the right to vote.
I used to lecture about this historic stuff and my women’s suffrage mnemonic was/is 1869, the year at least a few women – unmarried ratepayers in GB & Ireland – gained the right to vote in local elections. Which, while obviously not globally record-breaking, sounds tolerably progressive – until you deploy the mnemonic, reverse the central digits, and recall that women in the Dutch province of Friesland had been at it for nearly two centuries – or since 1689, to be precise.
This IWD contribution, unsurprisingly, is not about women gaining the vote, but how, in post-war Britain they’ve collectively been exercising it in successive General Elections. And it’s aided by the following striking graph, whose ‘gender gap’ approach was developed by Inglehart and Norris back in 2000. They and their successors duly updated it in successive elections, drawing comparisons/contrasts with other countries, but only in the past few years has it really come into its own, and for the obvious reason: that it’s so visually, and politically, striking – as the version prepared for me by the Birmingham Post’s editorial team demonstrates.
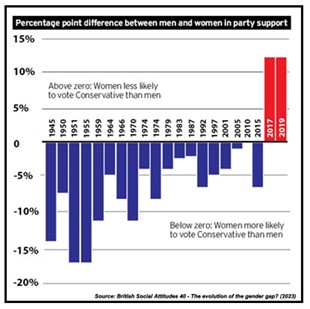
All but one of the first 19 bars/columns are blue, showing women as more likely to have voted Conservative by varying percentages up to a mighty 17% in the early 1950s. The sole exception was 2010, the first of the recent run of ‘hung Parliament’ elections, when men and women were equally likely to have voted Conservative, so no column at all.
It had become a truism: that, certainly in Britain, women were at least marginally more Conservative or right-wing than men in their voting behaviour. Until suddenly, in both the 2017 and 2019 General Elections, they weren’t – in each case being a sizeable 12% LESS likely to have voted Conservative than men.
Some unknowable proportion of what was swiftly tagged our Flipping Gender Gap was undoubtedly attributable to women’s consistently greater enthusiasm for remaining in the EU, but those striking 2019 gender gap figures are still worth detailing. Conservative: 47% of men, 42% of women; Labour: 29% of men, 37% of women – representing a massive 18% Conservative lead over Labour amongst men, and just a 5% lead amongst women.
Which begs the obvious question of whether we’ll see something comparable this time, and, if so, to what degree? Or was it, say, Brexit in those two elections that produced a kind of two-off aberration? Either way, these ‘gender gap’ statistics will be among the most anticipated and intensively studied, as commentators prepare their voting forecasts.
Indeed, they already have been, the commonest immediate reaction from those who study these things, particularly following the 2019 election, being that “at last” UK women voters were catching up.
For the stats have shown that for years now many/most other established democracies – the US outstandingly, but also the Scandinavians, Netherlands, Germany, Austria, Canada, even Italy – had seen the development of a modern-day gender gap, with women more likely to vote for left-leaning parties than men, while our gender gap showed the reverse.
No longer, then, did the UK seem to be bucking the global trend. As in these other democracies, as more women entered higher education and paid work, some at least became more socially and economically liberal and supportive of gender equality, pushing them to the left of men in their party choices.
Even just typing that ‘UK women voters’ label, though, I’m conscious of risking over-simplification. And indeed, it obscures significant and unsurprising differences across age cohorts. Younger women are considerably more likely to support Labour and less likely to support the Conservatives than younger men, but this modern gender gap lessens and eventually disappears among older voters.
So how will all this affect what happens in this year’s General Election? The estimable UK Women’s Budget Group commissioned a YouGov poll last autumn which reflected and updated some of the above findings – starting with almost a law of UK electoral politics: women take their time to decide.
Asked for their voting intentions, 18% of respondents hadn’t, with no election in the immediate offing, made up their minds: 11% of men and a full 25% of women. Those that had decided split very similarly between the major parties: Men – 20% Conservative, 31% Labour, 7% Lib Dem; Women – 17%, 31%, 8%.
The big difference came with the then Don’t Knows: just 11% of the men, but one in every four women. So, if they hadn’t then decided, perhaps they won’t vote? By no means: 13% of males were ‘would not voters’, and just 3% of females.
Probably not surprisingly, their policy priorities differ somewhat too. NHS and healthcare is highest ranked by all, but that was 48% of men and 64% of women. The economy was “most important” for 44% of men, but only 28% of women, and the reverse was the case for ‘Environment and climate change’ and ‘Education and schools’ – the latter ranked “most important” by 18% of women but just 9% of men.
And, to quote the ever-flexible Forrest Gump: that’s all I have to say about that – for the time being.
Chris Game is an INLOGOV Associate, and Visiting Professor at Kwansei Gakuin University, Osaka, Japan. He is joint-author (with Professor David Wilson) of the successive editions of Local Government in the United Kingdom, and a regular columnist for The Birmingham Post.
