Jason Lowther
The publication last month of the Institute for Government’s report on the impact of cuts in local services during the decade of austerity has revealed to the public what has been obvious in the sector for years – austerity was hugely unfair and hit the poorest hardest.
Neighbourhood services under strain is written in IfG’s usual forensic style, and its conclusion is all the more brutal because of it: the most deprived areas received the biggest grant cuts, resulting in bigger reductions in local services such as libraries and recycling. Central government grants were cut more in deprived areas because of the way cuts to grant funding were distributed ignoring councils’ different degree of dependency on this income source. Because of the central cuts and pressures such as the increasing demand for social services, councils have been forced to cut preventative and universal services like children’s centres and housing programmes to help vulnerable people to live independently.
The report’s detailed analysis of changes in spending reported to DHCLG concludes that most councils chose to protect similar services. ‘Relatively protected’ services included environment and regulatory services, homelessness and public transport. At the other extreme, most councils applied higher than average spending cuts in housing, cultural, and planning services (figure 1 below). This mirrors earlier analysis by the National Audit Office (which also highlighted the protection of social care services).
Figure 1: Local authorities that disproportionately cut, relatively protected, or increased neighbourhood services spending between 2009/10 and 2019/20, by category
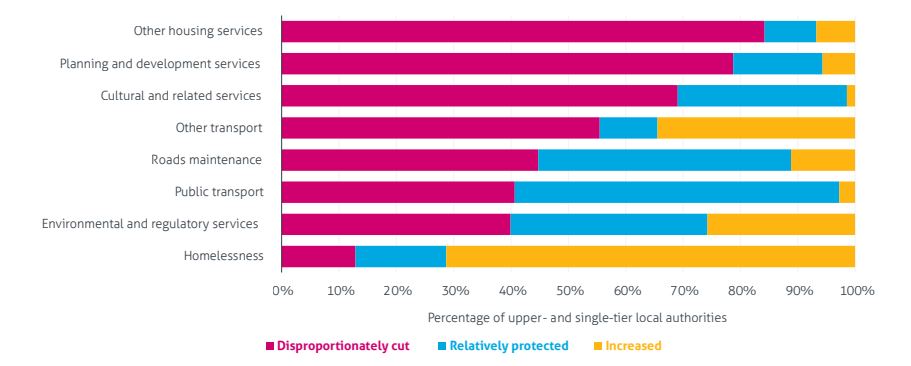
Source: Institute for Government analysis of DLUHC, Local authority revenue expenditure and financing in England: individual local authority data – revenue outturn 2009/10 and 2019/20.
The IfG report hints at the innovative ways different councils responded to these pressures, from contract renegotiation and the use of new technology, to service redesign and rationalisation. For a more detailed exploration of this, I recommend Alison Gardner’s excellent thesis on how local councils responded to austerity – including strategic asset management, shared services, commercialisation, co-production and demand management. Whatever methods were used, however, it’s clear that by the second half of the decade of austerity the cuts were no longer into ‘fat’ but into ‘flesh’.
These new findings add to a growing library of research on the effects of the UK government choice to pursue austerity policies, including a BMJ study in October 2021 which suggested that the constraints on health and social care spend during this period of ‘austerity’ have been associated with 57,550 more deaths than would have been expected had the growth in spend followed trends before 2010. Considering cuts to local government funding specifically, a July 2021 study in The Lancet estimated that cuts in funding were associated with an increase in the gap in life expectancy between the most and least deprived quintiles by 3% for men and 4% for women between 2013 and 2017. Overall reductions in local government funding during this period were associated with an additional 9,600 deaths in people younger than 75 years in England. Well before the pandemic, the UK was seeing a rapid slowdown in life expectancy gains in the 2010s and, although a number of other high income countries also saw such slowdowns, of large populations only the USA experienced a more severe slowdown/reversal and the magnitude of the slowdown in the UK was more severe than other large European populations.
Perhaps the most damning finding of the IfG report is that central government lacks the information to know what the impact of its spending cuts are on local services. This echoes the assessment of the Nuffield Trust and Health Foundation back in 2014 which warned government was making decisions with ‘no comprehensive way to quantify the impact that social care cuts are having on their health and wellbeing’ and were therefore effectively ‘flying blind’. Having abolished the Audit Commission in 2010, the government was left with no comparable performance statistics for two-thirds of local services. Some may believe that this was quite convenient, given what we are now learning about the effects of that government’s spending policies.
