Unsuccessful Political Parties. Exploring and Combining Party Death and Party Failure

Julien van Ostaaijen and Sander Jennissen

‘I am fed up. It was interesting, fascinating, and frustrating. As a small faction it is difficult to be on top of everything and I noticed that I became less focused’. This is how one of many Dutch councillors explains why his party will stop having representatives after the election.

Participating in elections and having representatives elected is one of the main characteristics of political parties. However, political parties can be unsuccessful. They can stop having representatives elected. In the Netherlands, every four years, at least 15% of all Dutch local political parties lose all their representatives. What can happen to parties losing all representatives and what happened to the Dutch parties?

Figure 1: An oversight of unsuccessful parties: party death and party failure
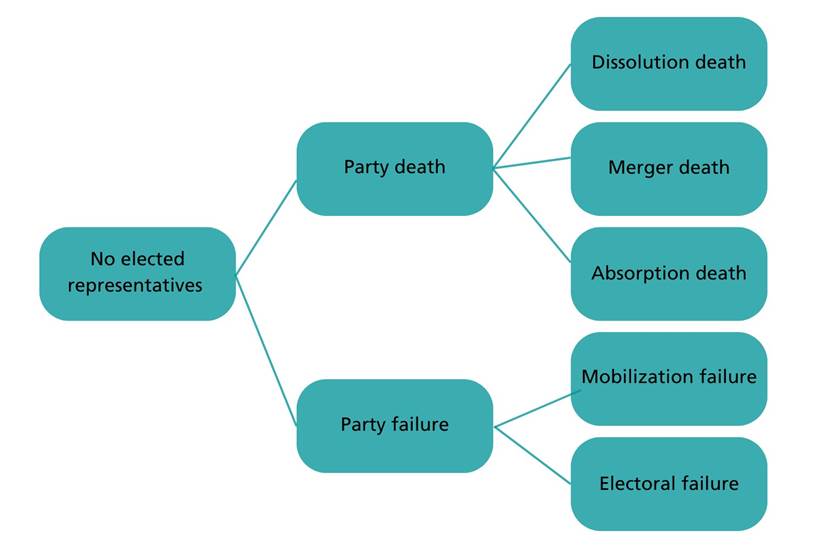
In our article, we separate five possible reasons for political parties losing all representatives (Figure 1). In our framework, the first category is that of party death. In this category, the political party ceases to function as an independent, autonomous organisation. This category encompasses dissolution death (the party organisation no longer exists), merger death (the party has merged with another party), and absorption death (the party has been taken over by another party). The second category is that of party failure. In this category, the political party still functions as an independent, autonomous party organisation and is thus not ‘dead’. However, for other reasons, it no longer has elected representatives. This can be because of a mobilization failure (the party has ‘failed’ to present candidates for (re-)election and thus temporarily withdrawn from the election process) or electoral failure (the party participated in the election but failed to have any representatives elected).

In the Netherlands, we found 129 local political parties that had representative elected in the local elections of 2014, but no longer in 2018 (and most also not in the elections of 2022). Using several data sources, including election results, party websites and media reports, we analysed what had happened to these parties (Figure 2).

Figure 2: Results for local parties with no elected representatives in 2018
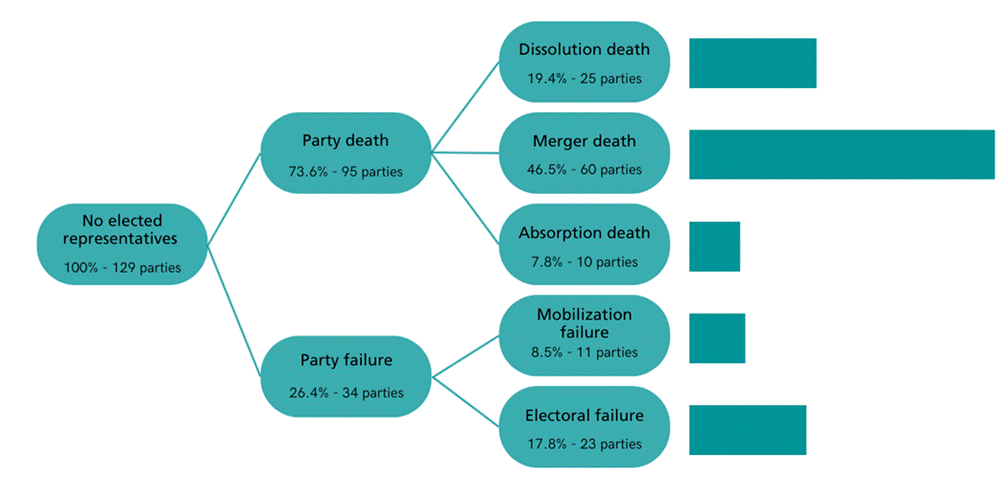
Our data show that about three-quarters of all the parties that ceased to have elected representatives after the 2018 local elections had effectively ‘died’, meaning that they ceased to exist as an autonomous organisation. However, most of the parties placed in this category had merged with other parties and therefore continued as part of a new party organisation. This pattern is closely connected to a trend in Dutch local political practice: between 2014 and 2022 the number of Dutch municipalities decreased by about 15% and many local party mergers took place in municipalities that were amalgamating around the same time. The remaining quarter of local parties with no representatives experienced party failure, meaning that they either did not gain sufficient votes to elect a representative, or decided to temporarily not participate in elections. It is noteworthy that the vast majority of these parties can be considered effectively dissolved four years later, in 2022, supporting the view that party failures, consisting of electoral and mobilization failures, are a prelude to party death. Nevertheless, the posited causal relationship should be further investigated.

Regarding our theoretical framework, we would urge to keep separating party death from party failure. In the literature, there are many different definitions and overlaps between concepts. Party death refers to the end of the party organisation. Party failure relates to not participating in the elections or not winning enough votes to elect a representative.

Looking forward, we believe that our framework provides greater clarity for analysing the final stages of political parties at both local and national levels. The five subcategories encompass the different ways in which parties are unsuccessful, i.e. have no elected representatives from one election to the next. The model can identify the circumstances that explain why this is the case. In the Dutch case this was largely due to municipal mergers and therefore party mergers. Applying the model in different countries with different systems will most likely lead to different results. Applying the model to national politics will also be a further test of its relevance.

Find our full article here: https://research.tilburguniversity.edu/en/publications/reasons-political-parties-lose-their-representatives-combining-pa

Julien van Ostaaijen is a professor of Law & Safety at Avans University of Applied Sciences and an assistant professor in Public Administration at Tilburg University. His research interests include local institutions and parties, the relationship between society and politics, local safety, and good governance and countervailing power.

ELECTED MAYORAL GOVERNMENT – SOME INLOGOV ANGLES

Chris Game

This blog was prompted partly by Vivien Lowndes’ and Phil Swann’s recent INLOGOV blog giving “Two cheers for combined authorities and their mayors”. Substantively, anyway, although the decisive stimulus was the realisation that most, if not all, of those present at the relevant ‘Brown Bag’ session would probably have been unaware that seated among them was the co-author of almost certainly the most comprehensive examination of this topic by any INLOGOV colleague over the years.

I refer to the appropriately labelled ‘long-read’, also masquerading as an INLOGOV blog and entitled Briefing Paper: Elected Mayors, published shortly before the 2017 elections of what I think of as the second generation of elected mayors – and produced by Prof Catherine Staite and a Jason Lowther.

Catherine, nowadays an Emeritus Professor of Public Management, had recently stepped down as Director of INLOGOV, in which capacity she had, among numerous other initiatives, both launched and regularly contributed to our/her blog. And, while I certainly recalled reading the Briefing Paper, I confess that, with his name meaning little to me at the time, I’d forgotten her co-author. Apologies, Jason.

He claimed, moreover, that he himself had “forgotten” it (email, 14/5), which I didn’t, of course, believe … until, a few days later and following some ‘research’, I discovered one of my own INLOGOV blogs, on the Magna Carta and 800 years of Elected Mayors, which I really had totally forgotten. Whereupon I realised too that I couldn’t actually recall much of what Catherine, I and other colleagues contributed to that decade of debate on elected mayoral evolution.

So, the remainder, the structure, and – I fear – the length of this blog were prompted, yes, by much of the media coverage of this month’s elections, and the sense that the spread and substance of mayoral government over the past decade aren’t fully recognised even by those who supposedly follow these things; and also by the notion that it would be a pleasing mini-tribute to Catherine to do so by identifying and italicising particularly some of her and colleagues’ INLOGOV blog contributions on these mayoral matters over the years.

We start, however, for the benefit of comparatively late arrivals, at the beginning of not the blog, but the concept. Mayoral government is a postulation you might expect to have found a supportive, even enthusiastic, reception in an Institute of Local Government Studies and it mainly did, albeit with perhaps a certain reservation. Directly elected mayors (DEMs) had played a fluctuating role in the Blair Government’s local government agenda from the outset. London, noted in Labour’s 1997 manifesto as “the only Western capital without an elected city government”, would have a “new deal”. Which took the form in 2000 of the creation of the Mayor-led Greater London Authority – in the manifesto, so no referendum required. Probably no reminder required either, but they’ve been: Ken Livingstone (Ind/Lab; 2000-08), Boris Johnson (Con; 2008-16); Sadiq Khan (Lab; 2016- ).

The Local Government Act 2000 then provided all English and Welsh councils with optional alternatives to the traditional committee system. Chiefly, following a petition of more than 5% of their electorate, they could hold a referendum on whether to introduce a directly elected mayor plus cabinet. There were 30 of these referendums in 2001/02, producing 11 DEMs – plus Stoke-on-Trent’s short-lived mayor-plus-committee system – three in London boroughs, but most famously Hartlepool United’s football mascot, H’Angus the Monkey, aka Stuart Drummond (Indep).

Ten referendums over the ensuing decade produced a further three mayors, prompting the now Cameron-led Conservatives to pledge in their 2010 manifesto to introduce elected ‘Boris-style’ mayors for England’s 12 (eventually 11) largest cities, with significant responsibilities including control of rail and bus services, and money to invest in high-speed broadband.

These DEM referendums eventually took place in May 2012 – three months after the launch of the INLOGOV blog – and provided a natural topic for early blogs by Catherine and colleagues (Ian Briggs). The referendums followed protracted Whitehall battles over mayoral powers (CG) – as revealed by the then Lord Heseltine in a UoB Mayoral Debate (CG) – a combination of ministerial indecision and interference (CG) against a backdrop of opposition from most of the respective councils’ leaderships, with Bristol the only one of the 12 cities voting even narrowly in favour (Thom Oliver).  

Birmingham voted 58% against, despite Labour’s having in Liam Byrne a candidate raring to go, and Coventry 64% against. There was speculation over whether the addition of a well publicised mayoral recall provision (CG) might have swung some of the lost referendums. But it was what it looked: an overdue, and to some welcome (Andrew Coulson), end of an episode (Karin Bottom);arguably “the wrong solution to the wrong problem” (Catherine Durose).

Since then, the referendums successfully removing elected mayors (Stoke-on-Trent, Hartlepool, Torbay, Bristol) have exceeded those creating new ones (Copeland, Croydon) – though, in fairness, those four removals were more than matched by five retention votes.

A ‘mayoral map’ at the end of that first decade would have looked something like the inset in my illustration of in fact the first 20 years of referendum results – numerous splotches of red for Reject, a few smaller green specks for Accept, and overall a patchy, somewhat arbitrary, experiment that on a national scale never really took off.  

The mayoral concept, though, had also generated interest outside local government – the Institute for Public Policy Research (IPPR), for instance, advocating Mayors for Greater Manchester, the West Midlands, and Liverpool City Region to take the required ‘big’ decisions on housing, transport, and regional development. Prime Minister David Cameron too was a ‘city mayors’ fan, although what scale of ‘city’ wasn’t initially clear, until in 2014 what became known as the first ‘devolution deal’ (Catherine Needham) was announced with the Greater Manchester Combined Authority. Headed by an elected ‘metro-mayor’ (CG), comparable to the Mayor of London, the GMCA would have greater control over local transport, housing, skills and healthcare, with “the levers you need to grow your local economy”.  

New legislation – the Cities and Local Government Devolution Act 2016 – was required, allowing the introduction of directly elected Mayoral Combined Authority or ‘Metro Mayors’ (Vivien Lowndes & Phil Swann) (+ Catherine Staite) in England and Wales, with devolved housing, transport, planning and policing powers.

The Combined Authority elections were held in May 2017 – not coinciding with the General Election (CG) as PM Theresa May had contemplated but, in contrast to Rishi Sunak, chickened out of – with perhaps usefully split results (CG). Elected were Andy Burnham (Lab, Greater Manchester), Steve Rotheram (Lab, Liverpool City Region), Ben Houchen (Cons, Tees Valley), Andy Street (Cons, West Midlands), Tim Bowles (Cons, West of England), and James Palmer (Cons, Cambridgeshire & Peterborough) – followed in 2018 by Dan Jarvis (Lab, Sheffield City Region). The map had started to change – even within the first hundred days (CG) – stutteringly under the less committed Theresa May and/or in several cases where groups of local authorities failed to agree – but eventually dramatically, as evidenced in the larger illustrated map. The Staite/Lowther ‘Briefing Paper’ was well timed.

A few years on, mayoral devolution has trailblazed across the country (CG) to a greater extent than even some commentators on this year’s local elections seemed to have difficulty grasping. As of March 2024, devolution deals had been agreed with 22 areas, covering 60% of the English population – most recently, in late 2022, North of Tyne, Norfolk/Suffolk, East Midlands, York & North Yorkshire; in 2023 Cornwall, Greater Manchester and West Midlands (‘Trailblazers’), Greater Lincolnshire, Lancashire, Hull/East Yorkshire; and so far in 2024 Buckinghamshire, Warwickshire and Surrey.  

From next year, if you draw a straightish line from, say, Ipswich in South Suffolk up through about Alvechurch in South Birmingham, heading for Shrewsbury, at least five-sixths of the bits of England to your north will be under mayoral devolution. Which, to me anyway, seems pretty dramatic news, and considerably more interesting than the endless General Election Date speculation that passed this May for ‘Local Elections’ reporting.

Picture credit: https://en.wikipedia.org/wiki/Mayor_Quimby

Chris Game is an INLOGOV Associate, and Visiting Professor at Kwansei Gakuin University, Osaka, Japan.  He is joint-author (with Professor David Wilson) of the successive editions of Local Government in the United Kingdom, and a regular columnist for The Birmingham Post.

Inflation and Local Authority Budgets

Andrew Coulson

Our two main political parties are locked in a strange debate about the next budget, on 6 March. The elephant in the room is the underfunding of local government.

In the nearly 14 years of Conservative government, the core spending power of local authorities has been cut by 27% in real terms.[1] The County Councils Network has “warned that its members are under extreme pressure, and that the authorities they represent are set to overspend by almost £650m this year due to spiralling costs, particularly in children’s social care and home to school transport, which was contributing to a £4b funding deficit for those authorities over the next three years”. In addition an increase in the National Living Wage is expected to costs these councils £230m next year.[2] This has happened at a time when the ability of councils to raise their council taxes has been held down, for 2024-5 to below 5% for all but a tiny number of councils.[3]  One of its consequences has been the inability of the employers in local government and the NHS to negotiate pay settlements which reflect the rate of inflation, or anything near it.

My reading of the present position is that Gove on the one hand and Rachel Reeves on the other are playing chicken. Each are waiting for the other to move first. They both know that after the general election a new government will have to settle the long-standing pay disputes in the public sector, and that it is not possible, year after year, for the pay of staff employed by local government and the NHS to rise by less the rate of inflation. The consequences are visable: depressed morale, a haemorrhage of experienced staff, and dependence on immigration to employ new staff. Rachel hopes that the Conservatives will be forced to confront this before the election. Gove wants the Labour Party to commit to doing it, because as of now any settlement is unfunded.

My view is that the understanding of inflation both by the two main political parties and the Bank of England is naive, especially as it relates to government policy. The starting point should be that inflation affects the distribution of income. It is an intrinsically political process. Most large companies and the richest people have means through which they can compensate for any inflation. Those who do not have the power or muscle to do so pay the price. Thomas Piketty[4] showed that inflation was the main means by which the middle classes paid for much of the costs of two world wars.[5]  In those inflations, and in the last significant inflation in the UK, which followed the OPEC hikes in oil prices in the 1970s, the trade unions were strong enough to ensure that wages rose at around the rate of inflation. This is no longer the case.

Yet the recent inflation has given the Government unprecedented increases in tax, which means that, if they so choose, they can afford wage increases. Most of this extra income arises from not raising the ceilings on higher rates of tax. Jeremy Hunt would like to use it to lower rates of income tax. The IMF (no less!) has told him that it is not appropriate to do so at this time.[6] The main reason, not always clearly stated, is that there are many unfunded challenges, but of these the public sector pay disputes (and perhaps the need for additional spending on defence, where difficulties in retention and recruitment are also partly a matter of pay settlements not keeping up with inflation) are top of the list. 

Economists in the UK, the USA and other developed countries have had little to say in recent years about inflation. As if it is no longer a problem, which it probably isn’t if inflation stays at around 2%. But the present inflations, driven by wars, the climate crisis and the lockdowns, are another matter. Economic theory is little help. All the traditional theories have been shown to be false. It is not true that inflation and unemployment are opposites: we can have both together, so-called stagflation. Or that it can be controlled by limiting the supply of money, which is not possible when most of it is created by banks which lend far more than they hold in deposits. Or that it is either created by unexpected demands or by unexpected costs.

The British Government urgently needs to resolve the disputes about pay in the public sector, and to do so recognising that most local government employees are substantially worse off than they were before. The Labour spokesperson Angela Rayner has made the practical proposal of negotiating a three year settlement.[7]  It cannot come soon enough.


Andrew Coulson is a nationally-recognised expert on scrutiny in local government and is particularly interested in governance by committee.


[1] Local Government Association, https://www.local.gov.uk/about/campaigns/save-local-services/save-local-services-council-pressures-explained 2024

[2] https://www.countycouncilsnetwork.org.uk/councils-in-significantly-worse-financial-position-after-the-autumn-statement-with-seven-in-ten-now-unsure-if-they-can-balance-their-budget-next-year/

[3] A prescient academic law professor, writing as long ago as 1984, wrote “It seems to me that the provisions for rate-capping … are little removed from a proposal to replace elected councils by administrative units. For a very long time, local inhabitants have enjoyed the right to elect local representatives with the power to tax, and so to determine, within modest political limits, what level of services shall be provided in the locality. … I have no difficulty in saying of an Act to put a limit on the rates leviable by a local authority that it is politically unconstitutional”. John Griffiths, in the Preface to Half a Century of Municipal Decline 1935-1985, George Allen and Unwin, 1985, p.xii

[4] Thomas Piketty, Capital in the Twenty-First Century, Harvard University Press, 2014

[5] The point was also made by one of his critics, Joseph T Salano, “War and the Money Machine: Concealing the costs of War beneath the Veil of Inflation” in John V Denson (ed.) The Costs of War, Routledge, 2nd edn. 1999 

[6] David Milliken and William Schomberg,  https://www.reuters.com/world/uk/imf-cuts-uk-growth-outlook-2025-after-stronger-past-performance-2024-01-30/

[7] “Rayner floats three year pay deal”. Municipal Journal, 14 Feb. 2024

Empowering Local Voices: Unveiling the Role of Councillors in European Governance

Dr Thom Oliver

In the intricate tapestry of European local governance, local councillors stand as pivotal figures, linking citizens to decision-making processes that shape their daily lives. Their interactions within communities, councils, and broader public administration are the bedrock of modern democracy. Last week, alongside colleagues from the University of Bristol, Cardiff University, and Ghent University, we embarked on an ambitious endeavour: an email survey reaching over 19,100 councillors across England, Scotland, Wales, and Northern Ireland.

The survey is part of a broader European effort, with a single shared survey being rolled out with spans twenty-eight European countries driven by a broad collaboration of academics emerges from extensive international research network dedicated to conducting surveys with local political actors to understand local and national political dynamics. Over two decades their comparative work has shed light on the councillor, council leader and mayor roles of local government, administrative intricacies, civic cultures, and political practices across Europe, enriching both academic and practical understanding.

Our latest research now refocuses on local councillors, probing fundamental questions about democracy, their perceptions of their roles, views on local government, challenges within the institutional environment, and policy priorities. The survey also aims to understand councillors’ experiences with aggression and abuse and the influence of such encounters on their council activities and public engagement.

But this survey is more than just academic curiosity; it’s about amplifying the voices of local representatives. Councillors are the conduits between citizens and power, entrusted with articulating community aspirations and championing collective interests. They face mounting external pressures—from austerity to centralisation—and grapple with balancing economic growth, development, and environmental concerns, alongside the existential threat of rising social care costs as more and more councils face financial distress.

Unlike previous paper-based iterations, this survey employs electronic questionnaires sent to individual councillors across England, Wales, Scotland, and Northern Ireland, with the survey lasting around 15 minutes, we are keen that councillors both start and finish the survey, so have enabled them to complete it over multiple sittings if required via simply clicking on the email invitation.

As the survey unfolds across 28 countries, we urge councillors to join the dialogue and lend their voices to the study. Personalised emails have been sent directly to councillors’ inboxes, and follow-ups will continue over the coming month. Any councillors unable to access the survey can reach out to the project team using the contact details provided below.

We are calling on all councillors to check their inbox for our survey! Your voices are crucial to use better understanding the challenges and priorities in your role. This is the first time we have delivered the survey across England, Scotland, Wales, and Northern Ireland so we are really keen to ensure that all voices are represented across political parties, different tiers of local government, and geographies. Let’s ensure all your voices are heard loud and clear.

Dr Thom Oliver is a Senior Lecturer in Politics at the University of the West of England, Bristol. Thom completed his PhD at INLOGOV in 2011. Along with Dr David Sweeting (Bristol), Prof Colin Copus (Gent), and Dr Bettina Petersohn (Cardiff), he is leading the Return of the Councillors study in England, Wales, Scotland, and Northern Ireland. Thom leads the Qualitative Election Study of Britain, and is a co-investigator on the Bristol Civic Leadership Project.

Voter ID – A “Poisoned Cure” and Other Verdicts

Chris Game

It’s easy to claim, but there are times when I miss not having classes of students to endeavour to entertain – partly because, at least from a distance, it can seem rather easier now than back when I had that responsibility.

One gift I’d certainly have used during this year’s exam revision period was the YouTube rap video made by T-Dawg – aka Broadland and South Norfolk Councils’ Managing Director, Trevor Holden – ‘reminding’ intending voters in the May local elections to take photo ID with them to the polling station. Like the whole topic, the video received a mixed reception, but it certainly got my vote (sorry about that!) as an introduction to this split-blog’s attempted overview of the profusion of recently released Voter ID material. I’ve at least flick-read most of it, so you won’t have to worry about not doing so.

First, though, an additional declaration of personal interest, referring back to that  opening paragraph. My students weren’t, of course, learning directly about ‘political literacy’, but high on my short list of ‘research stats I’ve managed to remember for more than a few weeks’ was the depressing finding in the All-Party Parliamentary Group (APPG) on Political Literacy’s 2021 report that, of a 3,300 sample of secondary school teachers in England, only 1% [felt] “fully prepared” to teach courses aimed at developing young people’s political literacy.

The ”fully”, omitted in some reports, was in the question and doubtless partly explains the dispiriting response. But anyway the finding was highlighted by the APPG, led directly to the creation of the social enterprise Shout Out UK (SOUK), and these two bodies’ influence is clearly evident in some of the Electoral Commission’s recommendations for more focused information and awareness raising.

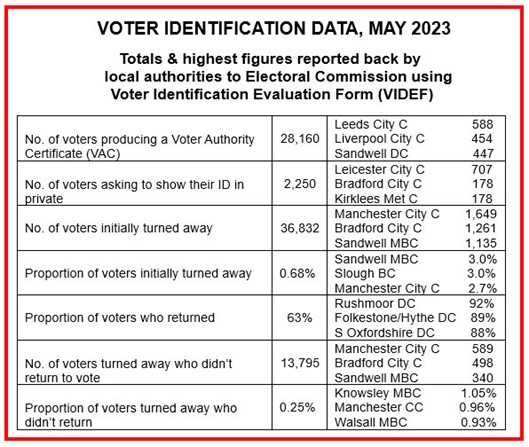
There had, of course, been earlier assessments of May’s elections – principally the Electoral Commission’s Interim Analysis in mid-June, reporting the anonymised returns from the Voter Identification Evaluation Forms (VIDEF) that Returning Officers were required to complete (see table below), plus results of three YouGov pre- and post-election public awareness surveys of between 1,700 and 3,700 adults each.

This first, stat-heavy part of the blog will present, in highly summarised form, some of the key data, with the second covering some of the more recent interpretative contributions – including that of the All-Party Parliamentary Group, from which I’ve appropriated the blog’s slightly giveaway title.

First, some scene-setting stats, taken from the final report. The total electorate was 27.3 million, ballot box turnout 32%. For the record, Labour took 33% of the vote and control of 70 councils; Conservatives 28.6% and 33; Lib Dems 37% and 20.  5.2 million postal ballots were initially issued to 19% of the electorate, 3.5 million (67%) of which were returned, of which 89,000 were rejected, mainly for missing or mismatched signatures or dates of birth. OK, it’s only 2.6%, but, after making the effort, it was higher than I might have guessed.

 Key findings from the analysis included that:

  • Immediately post-election, in areas with elections, 92% of people in England were aware they now needed to show photo ID to vote at a polling station. They weren’t asked, however, if that awareness extended to knowing that they couldn’t obtain ID – e.g. the Voter Authority Certificate (VAC) – on polling day itself.
  • Awareness was significantly lower (74%) among those who didn’t already have an accepted form of ID – and, unsurprisingly, among youngest age groups (82% for 18-24 year olds), Black and minority communities (82%), etc.   
  • Approximately 89,500 people applied for a VAC before the 25 April deadline, some 28,000 certificates being subsequently used – i.e. under one-third of the 250,000 to 350,000 estimated likely not to have any other acceptable ID.
  • At least 0.25% of people (c.14,000) who had tried to vote at a polling station were not issued with a ballot paper because of the ID requirement, but this excludes those who reacted to the ID reminder before they could be recorded in the data – thereby inevitably underestimating, as do the post-election analyses generally, the actual impact of the voter ID requirement.

This was essentially the ‘headline’ picture we had to content ourselves with over the summer, until quite suddenly, come September, there was a whole lot more – and it seems logical, if not strictly chronological, to start with the Electoral Commission’s full-scale Voter ID Demographic Analysis Research. The analysis aimed to identify patterns in areas where relatively higher or lower proportions of intending voters were turned away from polling stations due to the new ID requirement.

18 authorities with apparently relatively socioeconomically diverse wards were selected, including the West Midlands’ Coventry and Sandwell – the latter being the sampled borough with the nationally highest “initially turned away” percentage of 3%.  The Census-based ‘proxy’ variables measured were unemployment, ethnicity, household deprivation, and social renters.

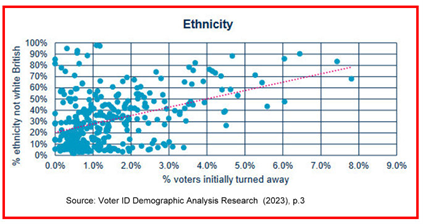
Hyper-summarising, the analysis suggested there was “a potential linear relationship” between each selected socio-economic variable and the proportion of voters initially turned away and those who didn’t return to vote. These results are obviously tabulated, but also graphed, as illustrated in what is described as the “moderate relationship” between ethnicity and the proportions initially turned away.

Overall, 13 of the 18 authorities showed at least a moderate relationship between the independent variables and the proportion of voters initially turned away, and 6 exhibited “strong relationships between one or more independent variables”. Strongest correlations were with areas having a high proportion of non-white British individuals, higher deprivation, and higher unemployment.   

Following this specifically Voter ID-focussed report, the Electoral Commission had published in June its overall Report on the May 2023 Local Elections in England, which it updated in early September. It made nine main recommendations, including increasing awareness of the support available for disabled voters, and improving data collection at polling stations.  

Four, however, related specifically to voter ID: review the list of accepted ID; improve access to the Voter Authority Certificate (see above); improve options for voters who don’t have or can’t access any accepted form of accepted ID – e.g. allowing ‘attestation’ by a named and verified elector; and polling station staff to continue to collect voter ID impact data at future elections.

Which brings us to about mid-September, already some way over this blog’s preferred length, and quite the wrong time, therefore, to address the “poisoned cure” and other reactions to these primarily statistical analyses – which will follow, with luck, fairly shortly.

Chris Game is an INLOGOV Associate, and Visiting Professor at Kwansei Gakuin University, Osaka, Japan.  He is joint-author (with Professor David Wilson) of the successive editions of Local Government in the United Kingdom, and a regular columnist for The Birmingham Post.

Voter ID – the warning lights are flashing

Picture credit: https://www.electoral-reform.org.uk/why-the-governments-mandatory-voter-id-plans-are-a-terrible-idea/

Jason Lowther

Previous columns have urged a cautious approach to the introduction of photographic voter ID in England.  The May 2023 elections provided the first nationwide test of the system, and early analyses are highlighting some significant issues. 

Elections took place in 230 areas in England and around 27 million people were eligible to vote.  This week, the Association of Electoral Administrators (the people in councils who actually deliver elections) issued their post-match analysis, highlighting ‘the fragility of the system’ and recommending a fundamental review of the country’s electoral arrangements.   

With less than four months between the enactment of the new legislation and polling day, which included new statutory duties on accessibility as well as voter ID, councils faced a huge and risky task to administer the new system effectively.  They also faced significantly more paperwork, with new forms to track electors unable to vote and new data capture requirements.  The AEA report significant impact on polling officials: ‘many of our members reported POs feeling overwhelmed by paperwork and the time it takes to complete throughout polling day and at the close of poll’.

The AEA report reveals that the government’s website to provide free photo ID to those needing Voter Authority Certificates (VACs) failed to work properly from its launch in January and many functions were still not available by the deadline to apply for a VAC for 4 May poll.  Updates were still being issued two weeks before polling day.  Almost 90,000 people applied for VACs by the deadline, well short of the Electoral Commission’s earlier estimate of 250,000 – 350,000 applications based on the proportion of local election voters who did not have suitable ID.  Many didn’t know they would need one – just over half (57%) of the overall population and those who said they did not already have photo ID were aware of VACs in May, according to the Electoral Commission.

The types of photo ID acceptable under the legislation proved rather esoteric.  Passports are accepted, but what about a passport from Zimbabwe or a British format immigration document?  London Oyster 60+ cards are accepted, but not the Merseytravel Over 60s pass which has similar application checks.  Photo IDs issued by councils themselves, such as taxi licences and gun licences, were presented but could not be accepted. Similarly police warrant cards, NHS and other emergency services photo ID were presented but unable to be accepted.

The Electoral Commission’s interim report on the election was issued on 23rd June.  They found that immediately before polling day, 87% of people in England (excluding London, where there were no elections) were aware that they needed to show photo ID to vote at a polling station – implying that around 3.5 m potential voters were not aware as the poll approached.  Awareness was lowest amongst young people, BME communities, those who haven’t previously voted in local elections, and people who didn’t have the necessary forms of photo ID.

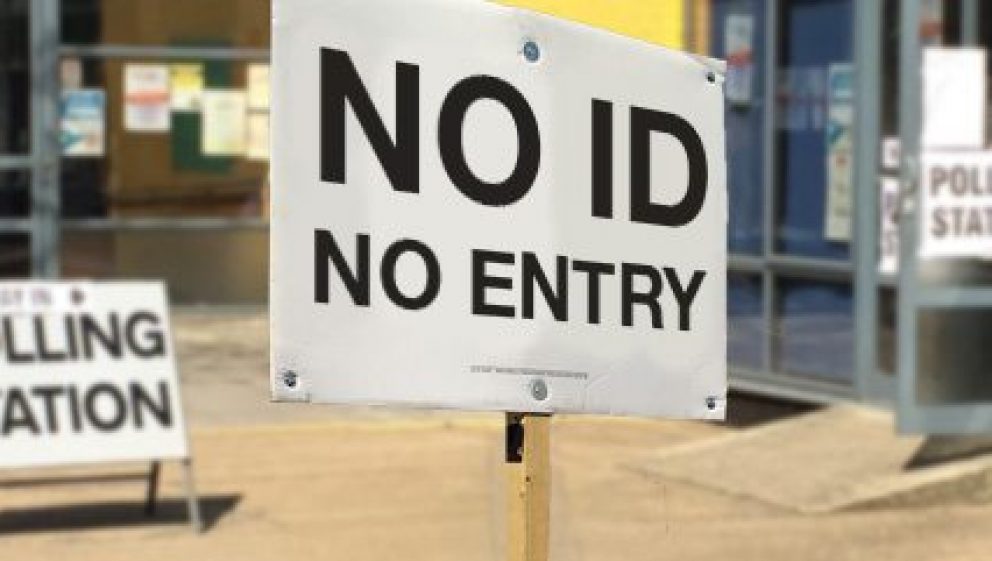
To avoid voters queuing for a ballot paper and being turned away, in some areas ‘greeters’ were appointed to meet electors as they arrived and check whether they had an accepted form of photo ID with them.  Others provided posters and banners to explain the requirements outside polling stations.  Polling stations with greeters recorded a smaller proportion of people ‘turned away’ inside the polling station compared to those without greeters.  As a result of voters receiving advice outside the polling stations, and because of some other data issues, we should treat statistics on numbers of electors unable to vote with caution. Data collected inside polling stations shows that at least at least 0.7% of people (39,000 voters) who tried to vote at a polling station were initially turned away but around two-thirds of those people (63%) returned later in the day and were able to vote.  In some councils more than 1 in 100 electors were turned away.

More worryingly, the Electoral Commission found that 4% of people who said they did not vote in these elections gave an unprompted reason related to the ID rules, and the proportion of non-voters giving an ID-related reason rose from 4% to 7% when survey respondents were selecting from a list of reasons.

It was not possible to capture reliable demographic data on people who were not able to vote because of the ID requirement because electoral law did not allow polling station staff to collect demographic information about individuals who were turned away.  In the EC survey, disabled people and those who are unemployed were more likely than other groups to give a reason related to ID for not voting.

Voter confidence doesn’t seem to have been massively improved.  In fact, the EC found 68% of people were confident that the May elections were well run, compared to 73% in 2022.  For those who said they were not confident, the most common reason selected (by 46%) was that “some people were unable to vote due to the ID requirement”.

We await the Electoral Commission’s full report in the autumn.

Meanwhile, I close with an interesting comment made at the National Conservatism conference on the 15th May 2023 by former Secretary of State for Business, Energy and Industrial Strategy, Sir Jacob William Rees-Mogg:

Parties that try and gerrymander end up finding their clever scheme comes back to bite them – as dare I say we found by insisting on voter ID for elections.  We found the people who didn’t have ID were elderly and they by and large voted Conservative, so we made it hard for our own voters and we upset a system that worked perfectly well.

Jason Lowther is the Director of INLOGOV. His research focuses on public service reform and the use of “evidence” by public agencies.  Previously he worked with West Midlands Combined Authority, led Birmingham City Council’s corporate strategy function, worked for the Audit Commission as national value for money lead, for HSBC in credit and risk management, and for the Metropolitan Police as an internal management consultant. He tweets as @jasonlowther