Chris Game
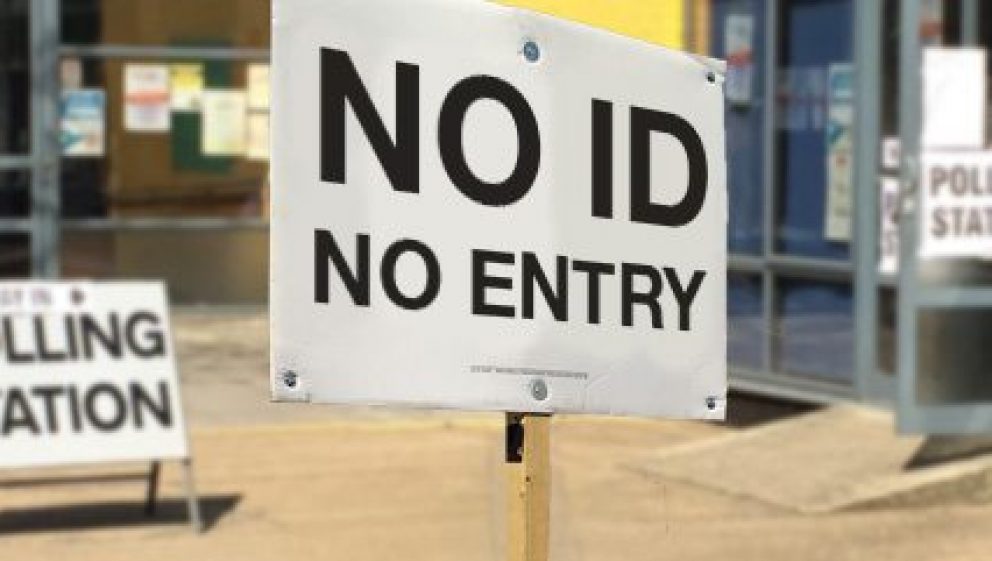
“ID cards for polls are nothing more than suppression of voters” – D Butler. I’d forgotten precisely when and where I first read this pronouncement – May 2021 in The Times, as it turned out – shortly after the Government’s Elections Bill, now Act, was published. But I certainly remembered it.
Partly the phrasing, as personally I’d have gone for “nothing less than”, if I was hoping to galvanise readers into outraged protest. The seriously striking bit, though, was obviously the author.
Since first becoming fascinated by elections and electoral studies – thanks initially to Prof Richard Rose at the Univ of Manchester, then the late Prof Tony King at Essex – there has only ever been one D Butler in that file of my academic consciousness. Populariser of the Greekish word ‘psephology’ for the study of elections, and original authority figure in the BBC’s General Elections coverage: Nuffield College, Oxford’s Sir David Butler, who died earlier this month, aged 98.
I knew him – distantly, but sufficiently to know he’d never have uttered anything resembling that strongly opinionated opening sentence – and, of course, ’twas not he. Rather, as I almost immediately realised, it was Dawn Butler: recent candidate for Deputy Labour Party Leader and, it so happens, MP for the London Brent constituency in which I first voted – shortly before she was born.
All of which might have excused a quickish blog return to the contentious Voter ID issue – within weeks of its last coverage – even if it hadn’t once more been prominently in the news this past fortnight, with Parliament finally getting its first full sight of the Government’s Voter Identification Regulations and the Electoral Reform Society leading the call for a parliamentary inquiry into its implementation.
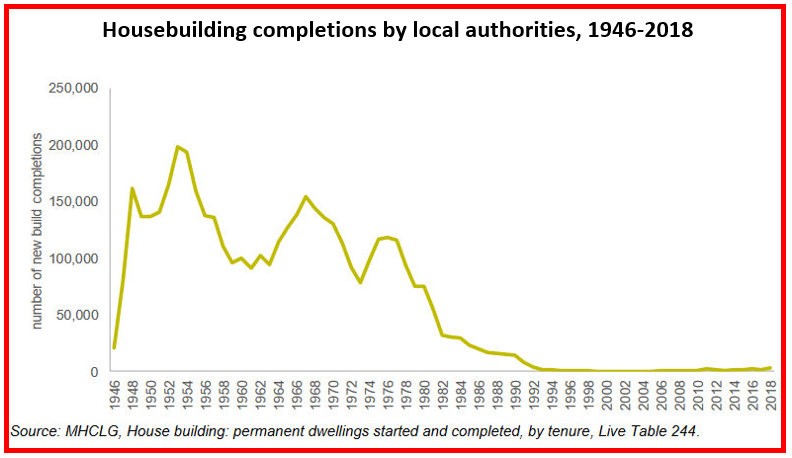
The Elections Act requires voters, from next May, to produce photo ID at UK Parliamentary and most English local elections. And now, a mere six months or so later, we – and the local election officials required to implement them – finally have the Government’s list of acceptable forms of ID and proposed guidelines governing initially next May’s council elections: Coronation permitting, in most English councils – though not Birmingham, to save you checking.
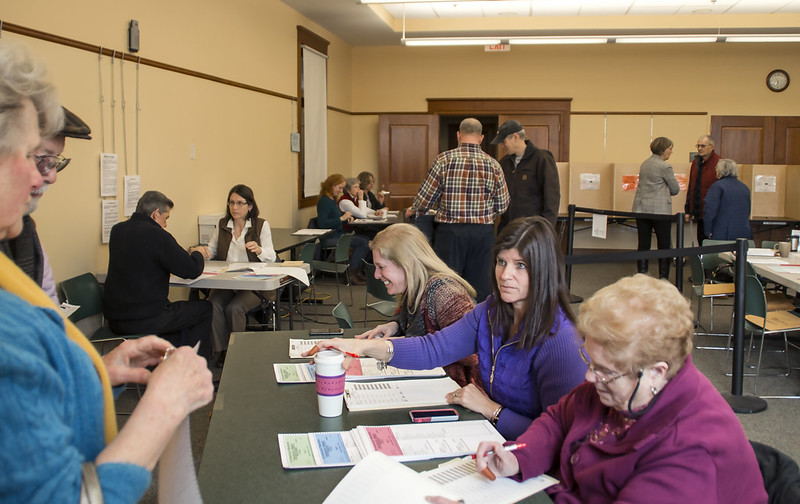
The guidelines run to just the 344 pages, taking effect probably in January. Leaving already pressured election officials with minimal time (and as yet undetailed costs, beyond a ‘ballpark’ £180 million per decade) to process and issue electoral identity documents for those who gradually discover they don’t have acceptable forms of photo ID. Plus the near certainty that at least some would-be, and quite likely upset, voters will be turned away at their polling stations – which could add to the fun for the small army of volunteer poll workers.
At which point I should indicate my personal viewpoint. Instinctively – and certainly predating Birmingham’s own 2004 embarrassment of six Labour councillors getting elected through what was judicially described as a “massive, systematic and organised” postal voting fraud campaign – I’ve long broadly supported, in principle, stronger election integrity rules in general and photo voter ID specifically.
And I have recounted in these columns the reactions of some of my overseas students to the frankly casual ID confirmation procedures they’ve observed when accompanying me to the polling station. Their surprise at the staff’s indifference to whether I’ve brought my poll card identification; and almost shock as I ‘helpfully’ point on the register to what I claim is my name and address.
So why my support in principle for photographic ID – as well as nowadays that of a substantial majority of voters themselves and the conditional backing of the independent Electoral Commission? Simples! Elections are the engines of our democratic system. They should be seen by all as important, and that perceived importance is diminished by not having visibly more robust voter identification procedures – like virtually all other ‘democratic’ nations.
On the Crime Prevention Research Center’s database of Europe’s nearly 50 such countries, “only the United Kingdom” does not require government-issued photo voter ID to vote in national elections.
Correction! Not the UK, just GB. Northern Ireland introduced voter ID nearly 20 years ago, and now has numerous forms of acceptable photographic ID – including, as well as passports and driving licences, a free Electoral Identity Card, plus senior, disabled and blind persons’ ‘SmartPasses’.
Since when, the Electoral Commission has found that, far from prompting polling day protest riots, voters’ confidence that elections are well-run has steadily increased to at least match the levels in other UK regions[1]. The demonstrable message has been not that we elsewhere in the UK are uniquely virtuous and trustworthy – though even Ministers concede that fraud levels are minimal, if not invariably seen as such. Rather, it’s that for us – and successive Governments – voting has been seen as less big a deal than, say, collecting a parcel at a post office.
Until now, that is, following a decade of quite dramatic change in the voting behaviour of particularly our 18 to 24-year-olds. Their turnouts are invariably lower than the average, but still high enough to hurt. In the 2010 General Election these mostly fledgling voters split equally across the Conservatives, Labour and Lib Dems, roughly 30% for each. By 2019, almost overlooked in the Conservatives’ overwhelming win, it was Labour 52%, Conservatives 28%, Lib Dems 11%.
That’s what evidently prompted the rush – not ‘personation’ or fraud, which for polling station voting are acknowledged as negligible. Rather, a possible early General Election campaign in which the Conservatives don’t start way ahead of the field. It also explains why the apparently generous range of 21 acceptable forms of ID is clearly weighted towards the better paid and over-60s. Older Person’s Bus Pass, Oyster 60+ card, Freedom Pass (66+), Scottish National Entitlement Card (60+), etc. – all welcome. Those particularly applicable to younger people, like Student ID cards or Railcards, remain “unacceptable”, as in the original legislation.
Yes, as in Northern Ireland, free ‘Voter Authority Certificates’ will be available – including online – and a public awareness campaign will remind you and your selfie to apply in time. And no, none of this remotely approaches the legalised voter suppression we saw in some of this November’s American state elections. But – to coin a dreadful cliché – it’s from the same partisan playbook.
As are the £1.3 million-worth of 40,000 mirrors and privacy screens – one of each per polling station – that desperately cash-strapped councils must provide to check on would-be voters with religious face coverings. But they may well prove worth a blog of their own sometime before next May.
_______________________
A slightly publisher-edited version of this blog appeared in The Birmingham Post, 17th November – https://www.pressreader.com/uk/birmingham-post/20221117/textview
[1] Examples from the Electoral Commission’s ‘Winter Tracker’, Jan/Feb 2022:
“Elections are affected by fraud/corruption?” Total agree: 37%; W Midlands 37%; NI 30%.
Those “not confident that elections are well run: Some people have difficulties registering to vote”:
Total agree: 20%; W Midlands 18%; NI 10%.

Chris Game is an INLOGOV Associate, and Visiting Professor at Kwansei Gakuin University, Osaka, Japan. He is joint-author (with Professor David Wilson) of the successive editions of Local Government in the United Kingdom, and a regular columnist for The Birmingham Post.