Chris Game
Yes, I did blog really rather recently on the topic of ‘Women in local and national governance’; and yes, I did conclude it by pledging to “retire gracefully from this particular field of research”.
But that was before I found myself fruitlessly upending my flat for anything conceivably useful to the Ukrainian refugees for whom one of my ward councillors was commendably collecting. Finding virtually nothing I could honourably offer, it was cash to the Disasters Emergency Committee, who assured me the UK Government would double my donation.
However, among the dust-covered treasures I’d totally forgotten, and spared the Ukrainians, was my 1975 Municipal Year Book (MYB) – a hefty, royal blue tome of 1,400-plus extremely closely printed pages, taking up over three inches of shelving.
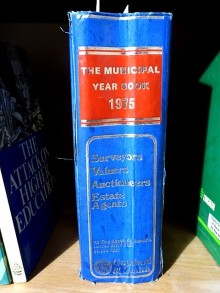
In pre-computer decades, when I joined INLOGOV, it was the proverbial local government bible – the 1975 MYB listing all 564 of the UK’s so-called principal local authorities plus, individually, their 26,467 councillors and further thousands of principal officers.
Several years later a thoughtful colleague, Ray Puffitt, bequeathed me his signed personal copy, possibly in exchange for my not pressing him to lecture to my undergraduate students.
Thoughtful because 1974/75 was, of course, the year of large-scale local government restructuring – or, in MYB-ese, ‘re-organization’. There were now far fewer councils and councillors, but these were the ‘new’ and therefore more relevant ones – which explains how I acquired my edition, though obviously not why it wasn’t binned decades ago.
Anyway, having discovered this 1975 stash of raw research data, I thought I’d share with you (and Birmingham Post readers) how much statistically women’s presence and visibility in our West Midlands local governments have changed in the past nearly half-century.
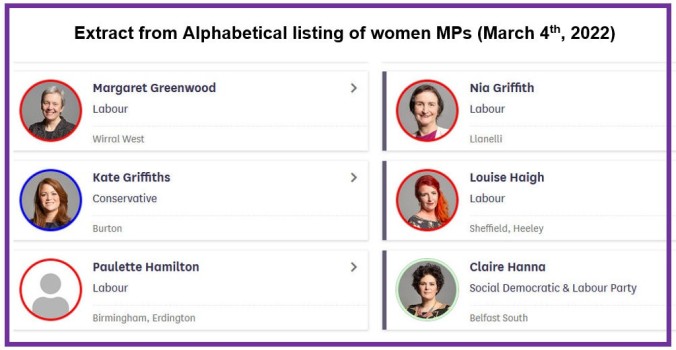
My earlier blog concluded by noting how Paulette Hamilton’s recent by-election victory for Labour in the Birmingham Erdington by-election had taken the proportion of women MPs over 35% for the first time. Moreover, that she and the six other women by-election winners since 2019 had – another first – made the Commons more gender-representative than our elected local governments, whose UK-wide proportion of women councillors has seemingly become stuck in the low 34%s.
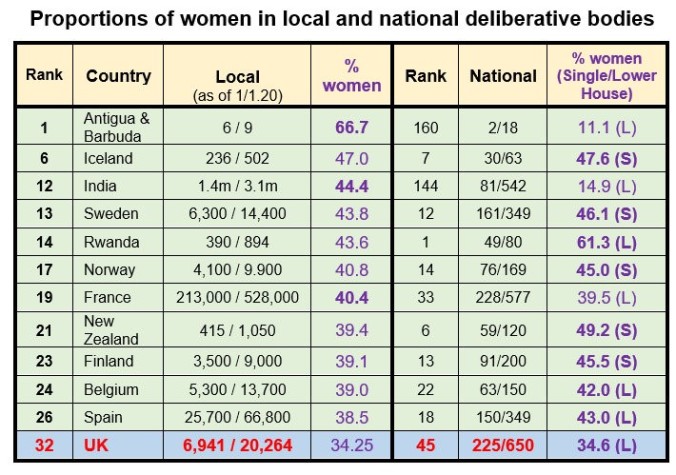
Internationally, both percentages would get us, just, into the top quarter of the respective rankings. In educational lingo, though, it would be a “disappointing, could surely do better”.
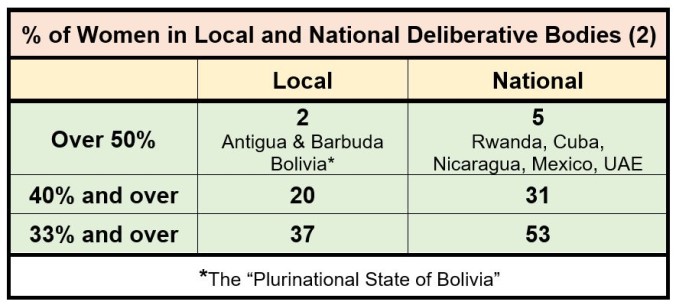
If the Parliaments of Cuba, Mexico, New Zealand, Iceland and all Scandinavia can have more than 45% of elected women, why can’t we – or, more precisely, why doesn’t our huge Conservative Party majority comprise even a quarter? Similarly, if local government in countries as diverse as Bolivia, Tunisia, Iceland, Uganda, Namibia and Mexico can attract at least 45% of women elected members, why can we barely manage one in three?
At least, though, the picture has changed, or improved, hugely in the past half-century, which is what the rest of this blog is about – focusing on the metropolitan West Midlands.
I hadn’t moved to Birmingham in 1974/75, but I reckon that even without research I could probably have named the incumbent West Midlands’ women MPs – because, though few, they were all exceptional and established national reputations.
One, indeed, would have me as an Edgbaston constituent for the latter part of her elective parliamentary career: Jill (later Dame Jill) Knight, MP from 1966 to 1997.
The other three were all Labour: in West Bromwich another Dame-in-Waiting, Betty Boothroyd (1973-2000), latterly Speaker of the Commons. In Coventry West was Audrey Wise, and in Wolverhampton NE Renée Short. A formidable quartet.
Their successors are, necessarily, impressive too, and the reason I couldn’t immediately name them all is not just my ageing memory, but that there’s a full dozen of them. Eight Labour – including all three of Coventry’s – and four Conservatives out of West Midlands’ 28, or 43%.
Yardley’s Jess Phillips is, I’m guessing, probably best known, and she is one of just two of Labour’s eight who aren’t from minority ethnic backgrounds. Overall, another massive change from the mid-70s.
What about councillors? Would the MYB’s council listings actually identify women members, and, if so, how? Fortunately, they all risked the accusations of chauvinism and did – though in differing ways.
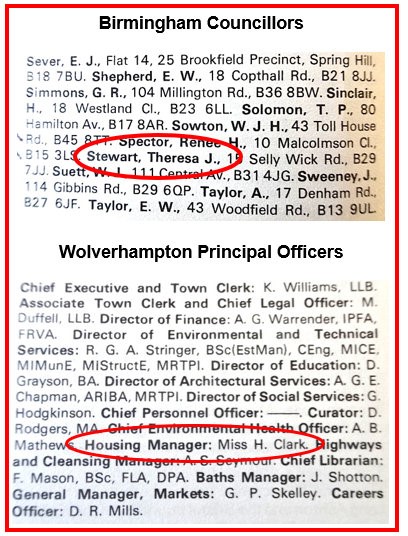
Birmingham, for example, gave first names – of all women members, while initialising the men. Then, as now, it was a Labour-dominated Council, 21 (17%) of whose 126 Members were women, including two Fredas, two Marys, and an exotic-sounding Carmen from Coleshill Road, B16. Oh yes, and a future Leader of the Council, Birmingham Lord Mayor, and wife of a Professor John Stewart.
The other councils preferred marital status: almost always Mrs, with the very occasional Miss. Across the seven West Midlands councils Labour members outnumbered Conservatives by two to one, which was broadly reflected in women’s representation, with comfortably Tory Solihull managing just one woman out of 51 members.
However, the gender blend on Labour-run Coventry and Walsall Councils wasn’t that much better – four women on councils of well over 50, and one can only imagine how, on occasion, they must have been treated.
And no point whatever seeking empathy from senior women officers – because quite simply there weren’t any. Sorry, not strictly true. Of the 101 listed Principal Officers in the seven WM Councils, Miss H Clark, Wolverhampton’s Housing Manager, was the sole woman.
It’s here that the culture has changed most dramatically. Today, try counting the number of women in the senior managements of the seven West Midlands metropolitan councils, and the very first name you’d encounter would be Birmingham City Council Chief Executive: Deborah Cadman OBE – heading a 13-strong team of service Directors, including four more women.
Remarkably, though, that 38% female senior management puts Birmingham at the foot of this particular league table, which is headed by Dudley and Solihull with 75% and 67% women senior managers respectively, followed by Walsall with 57%, headed by CE Dr Helen Paterson. In this sphere of local government at least, there has indeed been a metamorphosis.

Chris Game is an INLOGOV Associate, and Visiting Professor at Kwansei Gakuin University, Osaka, Japan. He is joint-author (with Professor David Wilson) of the successive editions of Local Government in the United Kingdom, and a regular columnist for The Birmingham Post.
_________
A version of this blog – ‘Equality progress – but room for improvement’ – was published by the Birmingham Post, March 24th, 2022 https://www.pressreader.com/uk/birmingham-post/20220324/textview