Counting the cost of talking to residents — a question for reorganisation

Eren Bahadir Pehlivan

Between July and September 2026, I sent Freedom of Information requests to eighty-nine district, borough and city councils in England. Thirty-two went out in July; a further fifty-seven in August, adding questions about the annual electoral canvass. The full wording is in the appendix, and readers should judge it for themselves.

The questions were deliberately dull. How much did the council spend printing and posting correspondence to residents last year? How many items did it send? What did the canvass cost, and how did people respond to it?

As at 7 September 2026, seventy-three councils had replied. Thirty-six gave substantive answers. Twenty-one produced figures complete and consistent enough to compare with each other. Responses arriving after that date are not counted here. Excluding one council that restricts commercial re-use, the remaining twenty spent more than £4.4 million in a year on print and post alone. The median was £205,890.

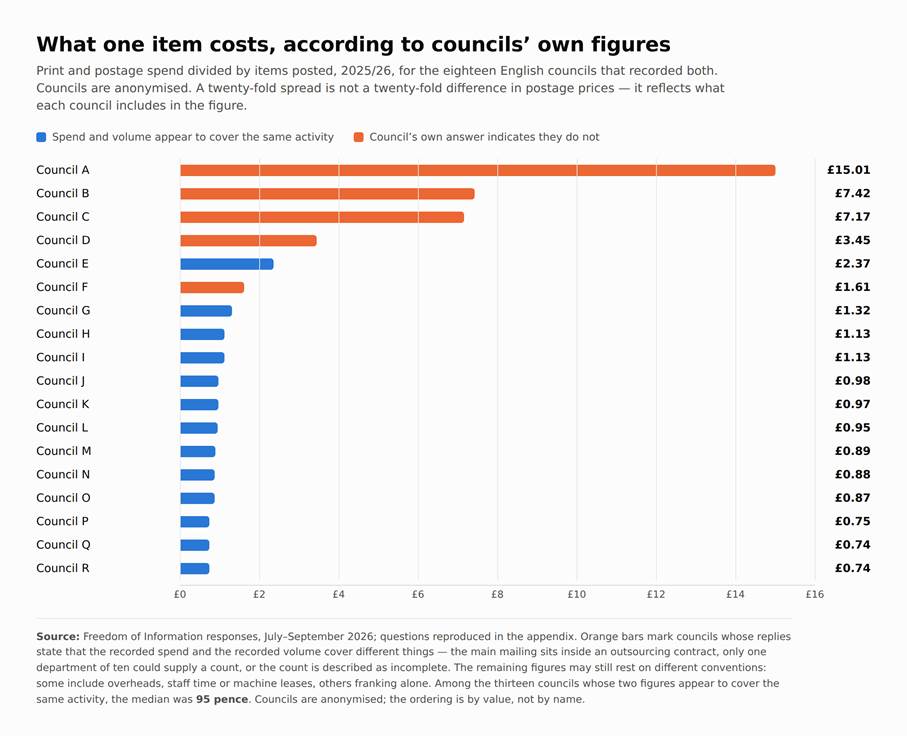
Eighteen recorded both spend and volume. Divide one by the other and the cost of a single item runs from 74 pence to £15.01.

That spread is the first thing to be careful about, because it is not a finding about efficiency.

Councils count different things. Some totals include overheads, machine leases, paper and staff time; others are franking alone. Where a service is outsourced, the largest mailing may sit inside a contract price and never appear as postage at all. Shared services split costs between partners on conventions of their own. Year-on-year movements can reflect a restructure, a change of supplier, or a re-coded nominal ledger rather than anything operational. Geography, service mix and the degree of outsourcing all move the number. None of that is bad practice, and none of it can be read off a single figure.

What it does mean is that these figures are not comparable in the way a reader might assume, and that most councils cannot say which of those conventions their own number reflects.

Some answers, though, are not explained by accounting convention. A city council serving around 138,000 people replied that its total print and postage spend was “not held”, and that the number of items posted was “not held” as well. A district put its whole-council outgoing post at “£500k approx” and does not record how many items that buys. One council asked ten of its own departments and they disagreed with each other about whether the authority uses a digital notification platform.

A borough in the east of England explained that it had “recently wiped our 2025 canvassing data to commence canvassing for the current year”, rebuilt its answer from invoices and an Electoral Commission feedback sheet, and warned that it “may be incomplete.”

These councils answered courteously and within the deadline. The information was not there to give.

The canvass makes the point more precisely, because every authority is doing the same statutory job. Among four councils that answered in detail, one made no household visits at all; the others paid for 7,254, 8,839 and 12,306. Cost per property, where it could be isolated, clustered between 67 and 73 pence — a similarity that conceals four different operating models.

It also unsettles an assumption worth naming. In two of those councils about three-quarters of canvass responses arrived over the internet. In the third, which paid canvassers to call at the door, the internet share was 36 per cent and nearly half of all responses were collected in person. The digital share of responses appears to track the council’s chosen method rather than residents’ preferences. That is a caution for anyone reading channel-shift statistics as evidence of public appetite.

All of this now matters more than it did. Reorganisation will move these budgets into new and larger unitary authorities from April 2028. A successor authority inherits whatever its predecessors could measure. Where a district cannot state its own communication spend, the new organisation begins without a baseline for it; where a dozen districts each used a different convention, aggregating them produces a figure that is precise and meaningless.

Which raises a governance question rather than a spending one. Two councils told me, in different words, that nobody owns this. One wrote that it has “no officer responsible for customer contact strategy”. Another said all decisions on communications and digital engagement for the canvass are taken through the elections office. Correspondence with residents is not a service with a director. It is a cost distributed across every service, which is precisely why it falls between owners.

Three modest arrangements would help, and none requires new spending: a named officer accountable for the whole channel; a single nominal code that records volume alongside expenditure; and a canvass costed as one activity rather than split between an elections budget and a general print budget.

Reorganisation is an expensive way to find out what you were spending. It is also, for the next eighteen months, the cheapest moment to start counting.

Figure

“What one item costs, according to councils’ own figures.” Produced by the author from the FOI responses; councils anonymised. Copyright held by the author; free to reproduce with the article.
Eren Bahadir Pehlivan is the founder of ADORASEC Ltd, working on notification between institutions and the people they serve. The dataset here is his own. Email: [email protected]

Appendix — the Freedom of Information request

Reproduced in full, as sent. This is the wording used for the second round (fifty-seven councils, August 2026). The first round (thirty-two councils, July 2026) used the same Part A and Part C questions but did not include Part B, and asked for “the most recently completed financial year” rather than naming the period. That relative wording proved ambiguous: several councils answered without stating which year the figures covered, and their responses are excluded from the comparisons above. It was replaced with absolute dates for the second round. The change is noted here because it bears directly on how far the two rounds can be read together.

This is a request under the Freedom of Information Act 2000. I have tried to keep it as light as possible to answer, and I have set out below what would make it lighter still.

Please provide the following for the 2025/26 financial year only — that is, 1 April 2025 to 31 March 2026.

If your figures for that period are not available, or if the council’s records are held to a different reporting period, please answer for whichever full year is most readily available and simply state in your response which period the figures cover. Knowing the period matters more to me than which year it is.

Four things before the questions, each intended to reduce the work involved.

First, we do not require a departmental breakdown. A single whole-organisation total is sufficient for every figure below. These figures are typically held against nominal codes in the finance ledger, and a total taken from there is exactly what we are asking for.

Second, if a figure is not separately recorded, please simply say so. That is a useful answer to us and we would much prefer it to an estimate. A number of authorities have already told us that certain figures are not held, and we have recorded that as a finding rather than a failure.

Third, the questions are grouped so that each group can be answered by one team: questions 1 to 3 by finance, questions 4 to 6 by the elections team, and questions 7 and 8 by whoever holds the staffing information.

I should be explicit about how those first two groups relate, because it has caused confusion elsewhere. Part A is not about elections. It concerns the organisation as a whole — every department, and all correspondence sent to residents whatever the service area, including council tax, benefits, waste, housing and planning. Part B is the election-related part and concerns only the annual canvass. The two do not overlap, and a figure covering electoral registration alone would not answer Part A.

Fourth, if any single question would take the request over the appropriate cost limit under section 12, please tell me which one and I will withdraw it, rather than the request being refused as a whole. I would be glad to agree a narrower wording by email before any work is done on it, in the spirit of the duty to advise and assist under section 16.

PART A — CORRESPONDENCE WITH RESIDENTS (ALL DEPARTMENTS — NOT ELECTIONS)

1. The total amount spent by the council on printing and posting correspondence to residents during the period, across the organisation as a whole. This is not limited to electoral or canvass mail. A single whole-organisation total is sufficient.

2. The number of items posted to residents during the same period, if this is recorded.

3. The total amount spent on SMS or text messaging to residents during the same period, and the number of messages sent, if these are recorded.

PART B — THE ANNUAL CANVASS

4. The total cost to the council of the 2025 annual canvass — that is, the most recently completed canvass, whose revised register was published on 1 December 2025 — including printing, postage, staffing and any personal canvasser visits. If the canvass cost is not recorded separately from the council’s general print and postage budget, please say so.

5. For that same canvass: the number of residential properties to which a canvass communication was sent; the number that did not respond to the first communication; the number of reminder communications sent; and the number of household visits carried out.

6. For that same canvass, the number of responses received by each route — paper, online, telephone and SMS — if this breakdown is recorded.

PART C — WHO HOLDS THIS WORK

7. The job title and, if the council is willing to share it, the direct contact details of the officer responsible for resident communications, customer contact strategy or digital transformation.

8. The job title and, if the council is willing to share it, the direct contact details of the Electoral Registration Officer and of the officer who manages the annual canvass day to day.

I am content to receive the response electronically, and I understand the statutory period is twenty working days.

One last thing, which is an offer rather than a request. The same questions have gone to a number of district councils in England. Any council that responds is welcome to a copy of the comparative results, showing where it sits against the others, with the case reference against every figure so that anything in it can be checked at source. It is provided at no cost and on no conditions. You do not need to do anything to receive it beyond answering this request, and you are under no obligation to take it.

Local Authorities engaging in housing delivery

Janice Morphet

The Secretary of State for the Ministry of Housing, Communities and Local Government frequently speaks to the media about the ways in which local authorities are providing more homes. She typically discusses two ways that she expects them to deliver – through the reform of the planning system and providing more social rent homes using Government Funding[1].  All councils use the planning system to negotiate affordable housing secured through planning agreements[2] and about half of local authorities retain and develop social rent homes using government subsidy. However, over five waves of research since 2017, we have found that, in 2026[3], 95% of local authorities are engaged in housing delivery, although much of this is not recognised by government.

How are local authorities increasing the number of homes they need in their areas? We look at this in detail in our research. Each round in 2017, 2019, 2021, 2023 and 2026 has used the same methods to find out what councils are doing. The first stage is to examine each council’s documents, reports, websites and records to provide detailed information about their levels of activity. These findings are published in a free report which is available now for 2026. Where the council has its own company to develop homes alongside other methods, like WV Living in Wolverhampton or Goram Homes in Bristol this is noted and weblinks provided. Some councils also have active Arm’s Length Management Companies (ALMOs), where the council retains ownership of its stock but some or all aspects of its housing management and delivery are undertaken independently. These ALMOs are also registered as housing associations and have separate assured access to government funding. While the number of ALMOs has been reducing, some that remain are very active including Cornwall, Derby City and the LB of Sutton.

Other councils enter into partnerships with private developers or housing associations. Some local authorities may enter into multiple arrangements of this type such as Oxford City Council, where the agreement will vary on each site. Others like Gateshead and Cambridge have developer agreements for several housing sites over a period. In some locations, such as LB Ealing, local authority estate regeneration is undertaken with both housing developers and housing associations. These relationships bring funding, expertise for councils and less risk for developers who will usually also be providing some market homes as part of the arrangements. However, when completed, despite local authorities often providing land, finance, advocacy and guarantees to third party funders, the homes are attributed to the developer and/or the housing association and not to the council.

Since 2022, housing construction costs have increased while government subsidies and restrictions on the use of receipts for properties sold under right to buy have limited local authority investment in housing delivery. Yet 82% of councils increased affordable housing in their areas. At the same time, homelessness has increased placing strain on wider council budgets. Local authorities have been looking for other solutions to provide more homes. In the 2026 survey we found 57% councils are acquiring homes to add to their stock. While these homes are not net additions, they can be used for different tenures and to relieve homelessness, overcrowding and multiple occupation. The funding for acquisitions has come from an Government easing of the use of RTB receipts such as Bassetlaw and through a Council’s General Fund rather than through the specific housing funding route. Some councils are managing acquisitions through setting a budget, numbers cap or location, others by seeking certain types of homes eg former RTB homes to enable future estate regeneration eg Ipswich or suitable for older people such as Bury. Where councils have been working with developers, they have been able to agree purchases of unsold new homes at different points in their construction – from design stage to completion including Birmingham City Council. Many councils are supporting the development of garden villages and urban extensions to provide additional homes including Sandwell, South Derbyshire and Cheshire East.

Some councils are engaged in a wide variety of activities to deliver homes including Stockport, Sheffield and most London Boroughs where the Mayor of London has the power to provide all with funding for 5-10 year social housing programmes. If the new Prime Minister wants local authorities to deliver more homes, then the expertise and skills built up in London Boroughs to deliver the Mayor’s programme and then applied to wider housing delivery should be available to every other local authority in the country.

Local authorities are providing more homes than popularly acknowledged. They should receive more recognition of what they are achieving and the model of funding for each local authority as available in London demonstrates that this approach has a significant role in expanding housing delivery across all tenures in England.  

Janice Morphet is a Visiting Professor at University College London’s Bartlett School of Planning

The full report is here:


[1] Eg BBCR4 Today Programme 19th August 2026

[2] Often known as s106 agreements from role of s106 of the 1990 Town and Country Planning Act in providing the legal means to secure this housing

[3] Local Authority Direct Provision of Housing in England: Round Five Research Report 1 – Local Authority Activity to Directly Support Housing Provision: Desk Survey Report. Janice Morphet and Ben Clifford UCL Bartlett School of Planning

Do female mayors make local government more transparent? Only when politics lets them

Bruna Ribeiro (University of Minho), Miguel Rodrigues (University of Minho) and Francisca Tejedo-Romero (University of Castilla-La Mancha)

Why do some municipalities open their books, publish their contracts and document their decisions online, while their neighbours – operating under exactly the same legal framework – remain opaque? Freedom of information laws set a floor, but the striking fact about local government transparency is how much variation survives above that floor. If the law were the whole story, all councils would look alike. They do not.

In our recent article in Local Government Studies, we explore one part of the answer that has attracted growing attention across Europe: who leads. Specifically, we ask whether female leadership changes how much information municipalities actively disclose to their citizens — and whether the political context in which women govern conditions that effect.

Why leadership and gender?

The theoretical case is well established. Research across countries has associated women’s political presence with lower tolerance of corruption, different risk preferences, and a stronger orientation towards accountability. Earlier work on Spanish municipalities found that women’s representation in local councils has a positive influence on transparency levels. But representation on the council and leadership of the executive are different things. Mayors set administrative priorities, control the machinery that produces (or withholds) information, and answer personally for what appears on the municipal website. If gender matters for transparency, the mayor’s office is where we would expect it to show.

Portugal offers an unusually good laboratory. Since 2013, the Municipal Transparency Index (MTI), produced by Transparency International Portugal, has scored all 308 municipalities from 0 to 100 on the information they make available through their official websites. This gives us a consistent, externally produced measure of active disclosure, in a system where women remain a small minority of mayors but where the 2006 Parity Law — recently strengthened from a 33% to a 40% candidate quota — has been steadily reshaping who enters local politics.

What we did

We linked each municipal election to the transparency performance of the government it produced: the mayors and councils elected in 2009 and 2013 were matched to the Municipal Transparency Index scores of 2013 and 2017, across all 308 municipalities. This temporal structure ensures that who governs strictly precedes what gets disclosed. We then tested whether the gender of the mayor is associated with transparency — on its own, and in interaction with two features of the political context: whether the mayor governs with an absolute majority, and whether they belong to a left-wing party. The models control for women’s presence in the council, financial autonomy, unemployment, turnout and population, and the results hold when we exclude Lisbon and Porto and under alternative specifications.

What we found

The headline result is not the one either optimists or sceptics might expect. Female mayors, on their own, have no statistically significant effect on municipal transparency. But the average conceals a striking conditional pattern. Without an absolute majority, female mayors are associated with transparency scores roughly 7.5 points lower on the 0–100 index than their male counterparts. Give them an absolute majority, and the association flips: the interaction adds around 10 points, turning the net effect positive — female-led municipalities with strong political backing outperform male-led ones. There is also suggestive (though weaker) evidence that belonging to a left-wing party partially offsets the negative baseline.

In other words, the question “do women govern more transparently?” is badly posed. The better question is: under what conditions can they? Women in Portuguese town halls are still rare — only about 7% of municipalities had a female mayor in the period we study — and those governing without a majority face weak institutional support that appears to hinder the implementation of transparency measures. Political strength provides the stability, resources and authority to translate leadership values into open governance; without it, being a pioneer is mostly an uphill struggle.

Why this matters beyond Portugal

Three implications travel well beyond the Portuguese case.

First, transparency policy is usually designed as if compliance were a purely administrative matter — build the portal, mandate the disclosure, audit the result. Our findings suggest that who is in office, and the political incentives they face, shape how far councils go beyond the legal minimum. Transparency is a political choice dressed up as an administrative one.

Second, the debate on gender quotas and parity laws tends to focus on descriptive representation — how many women get elected. Our evidence suggests that numbers are not enough. The mere presence of women in leadership does not, by itself, deliver more open government; what matters is whether they hold real power to act. Quotas should therefore go beyond numerical representation and be accompanied by the conditions for women to exercise actual influence — party support, resources, and genuine political authority. Putting women in office without power risks setting them up to underperform against expectations the literature itself created.

Third, for practitioners and transparency campaigners, the lesson is about where to aim. If disclosure responds to political context, then rankings and indices like Portugal’s Municipal Transparency Index are not just measurement tools — they are interventions, changing the reputational payoff of openness for the leaders most sensitive to it.

The bigger research picture

This article is part of a wider research agenda at the Research Centre in Political Science (CICP, University of Minho) on gender and local politics in Southern Europe. Companion studies have examined how women break the political glass ceiling at local level (Governance, 2025) and how voters respond to female candidates in local elections (South European Society and Politics, 2026). Together, they trace the full pipeline — from candidacy, through election, to what changes once women actually govern.

The transparency question sits at the end of that pipeline, and it may be the most consequential part: representation matters not only for who sits in the town hall, but for whether citizens can see what happens inside it.


Bruna Ribeiro recently completed her PhD in Administrative Sciences at the University of Minho (CICP). Miguel Rodrigues is Associate Professor with Habilitation at the School of Economics, Management and Political Science, University of Minho. Francisca Tejedo-Romero is based at the Faculty of Law and Social Sciences, University of Castilla-La Mancha.

The full article, “Transparency in local government: exploring the impact of female leadership and political context”, is available in Local Government Studies: https://doi.org/10.1080/03003930.2025.2612054

When accountability fails to bite: governance, democracy and the 2026 Tower Hamlets elections

Dr Gulay Icoz, Visiting Research Fellow, Middlesex University London

In theory, the 2026 Tower Hamlets local elections should have been a test of democratic accountability in action. The borough entered election year under active statutory intervention. A Best Value Inspection published in November 2024 had documented serious governance failings under Mayor Lutfur Rahman’s Aspire administration: weak internal controls, a culture of concentrated executive authority, poor transparency, and slow responses to statutory recommendations. A further written ministerial statement in January 2026 confirmed ongoing failures and deteriorating financial governance. In March 2026 — just two months before polling day — the Secretary of State escalated the intervention, granting ministerial envoys enhanced powers to step in directly if the council continued to breach its Best Value Duty.

Then voters went to the polls and Aspire won 33 of 45 council seats. Lutfur Rahman was re-elected as Executive Mayor for a third time. Labour was reduced to five seats — its lowest total in the borough’s history.

I stood as the Labour candidate for Bethnal Green West in those elections. What I observed — during the campaign and in the results — reveals a deeper tension between statutory accountability and community-level democratic legitimacy: one with implications that reach well beyond Tower Hamlets.

The structural picture

The results reveal a distortion that deserves wider attention. Aspire secured 73 per cent of council seats with just over 32 per cent of the vote. Labour and the Green Party each received just under 23 per cent of the vote, yet each won only 11 per cent of seats. In ward after ward, the combined Labour and Green vote exceeded Aspire’s total — yet the block voting system used in multi-member wards — where each voter casts as many votes as there are seats and the top candidates win — converted vote fragmentation into a decisive seat bonus for the incumbent. This is sometimes called plurality block voting, and it rewards coordinated slate-voting, which incumbent parties with strong voter loyalty are structurally better placed to exploit.

The ward-level picture sharpens this further. In Bethnal Green West, Labour entered polling day with an estimated core vote of around 540; Aspire’s coordinated bloc was already three times that size, with split votes running into the thousands. Green candidates who had run no sustained local campaign outpolled every Labour candidate standing — a pattern repeated across wards throughout the borough. The block voting system had no mechanism to reward breadth of engagement or effort: it simply rewarded the most organised and unified voting bloc.

It is worth distinguishing block voting in multi-member wards from single-member first-past-the-post. The coordination premium is structurally higher: a cohesive 32 per cent bloc can sweep three seats simultaneously in a way that would not occur in a series of individual contests. The question this blog is asking is not primarily about proportionality per se, but whether the electoral system can transmit accountability signals when a council is under active statutory intervention for documented governance failure.

This points to a question the electoral systems literature and the local democracy literature have rarely addressed together: when opposition parties are structurally disadvantaged by electoral mechanics, what additional tools does a democratic accountability framework need?

The accountability paradox

A long line of research — from Fiorina’s retrospective voting model through Powell and Whitten’s clarity-of-responsibility framework — establishes that electoral punishment for governance failure is neither automatic nor uniform. Recent scholarship sharpens this further: voters weigh integrity against perceived competence and community delivery (Breitenstein and Hernández, 2024); punishment weakens when opposition is fragmented and alternation unclear (Otjes and Stiers, 2022); and elections are in any case a blunt accountability instrument compared to courts, oversight bodies, and civic challenge (Papadopoulos, 2023). The established literature identifies three conditions that must be met for punishment to occur: voters must have clear information about failure; they must be able to attribute responsibility to the correct actor; and accountability must not be crowded out by competing loyalties or trade-offs. Tower Hamlets 2026 illustrates the failure of all three conditions simultaneously.

Yet the Tower Hamlets case also points to a fourth condition, largely absent from the existing retrospective voting literature: the accountability mechanism itself must be seen as legitimate by the communities it is meant to protect. This is the accountability paradox at the heart of the 2026 result — and it is a contribution that the standard retrospective voting framework is not equipped to capture.

For intervention to function as a democratic corrective, it must be perceived by the electorate — and particularly by the communities most affected by governance failure — as rational, impartial, and operating in their interests. Where that perception fails, intervention becomes politically legible as external imposition, and voting for the incumbent becomes an act of community solidarity rather than an endorsement of governance failure. This dynamic is not accidental: it is actively constructed through political framing, and incumbents with strong identity-based bonds with their electorate are structurally well-placed to construct it.

Recent research on statutory intervention in English local government proposes a five-stage model — crisis revelation, delegitimisation, imposed reforms, capacity building, and restoration — and argues that interventions must be carefully designed to appear rational rather than political if they are to maintain rather than undermine faith in local democracy (Lowther, Joyce and Whiteman, 2025). That model’s second stage — delegitimisation — describes central government’s work to undermine the legitimacy of the council being intervened in. What the Tower Hamlets 2026 election reveals is that delegitimisation can also operate in the opposite direction: the incumbent successfully turned the intervention itself into the object of delegitimisation in the eyes of the electorate, making the accountability mechanism the thing that lacked legitimacy rather than the council it was designed to hold to account.

Conversations on the doorstep revealed the depth of this reframing. Many Aspire supporters had not engaged with the contents of the Best Value report because they had already concluded the report itself was politically motivated — a tool of mainstream parties who disapproved of what Aspire represented rather than a genuine accountability mechanism. More striking still, when specific governance failures were raised — including nepotism and unqualified appointments — some voters had internalised a counter-narrative in which such practices represented community protection rather than misconduct.

It would be reductive to dismiss these perceptions as simply the product of misinformation. Communities with long experience of political marginalisation may have genuine historical grounds for scepticism toward central government intervention, and those experiences shape how accountability claims are received. What the Tower Hamlets case illustrates is the extent to which this pre-existing disposition was mobilised and amplified through deliberate political communication — producing not political apathy but the successful reconstruction of what accountability itself means.

This is not unique to Tower Hamlets. It is a dynamic that researchers of democratic resilience and local governance are increasingly attentive to, and it raises important questions about how accountability mechanisms are designed, communicated, and embedded — questions that are as much about institutional culture and civic trust as they are about statutory frameworks.

Tower Hamlets in context

Tower Hamlets did not stand alone in 2026. The elections produced historic Green gains across inner London — in Hackney, Waltham Forest, Lewisham and Southwark — and a significant realignment of the progressive vote away from Labour. What makes Tower Hamlets distinctive is that this regional realignment intersected with the specific dynamics of the Aspire incumbency, the governance intervention, and the structural incentives of block voting, producing an outcome more disproportionate than anywhere else in the capital.

Understanding whether Tower Hamlets represents an outlier or an advance indicator requires systematic comparison. Several English councils have been subject to statutory intervention in recent years — including Birmingham, Croydon, Slough, Sandwell, and Thurrock — yet the relationship between intervention, governance accountability, and subsequent electoral outcomes has received little comparative attention. Whether the accountability paradox identified here is specific to Tower Hamlets or reflects a broader pattern in how statutory intervention interacts with local political culture is a question that future comparative research must address.

The stakes

What the Tower Hamlets elections confirm, above all, is that democratic resilience is not reducible to electoral outcomes. The borough’s communities — residents navigating overcrowded housing, fractured services, and the cumulative pressures of one of England’s most deprived urban environments — continue to engage, organise, and hold their representatives to account through multiple channels. That engagement, not any single election result, is the foundation on which accountable local governance must ultimately be rebuilt.

What forms of accountability can work when statutory intervention loses legitimacy in the eyes of the very communities it is meant to protect?

Dr Gulay Icoz is a Visiting Research Fellow at Middlesex University London and stood as the Labour candidate for Bethnal Green West in the May 2026 local elections and Former Councillor in Hackney (2006–2014). She researches democratic resilience, local governance, and progressive voter realignment in inner London.

References

Academic sources

Breitenstein, S. and Hernández, E. (2024) ‘Too Crooked to be Good? Trade-offs in the Electoral Punishment of Malfeasance and Corruption’, European Political Science Review. doi:10.1017/S175577392400016X

Fiorina, M.P. (1981) Retrospective Voting in American National Elections. New Haven: Yale University Press.

Lowther, J., Joyce, P. and Whiteman, P. (2025) ‘Intervention 3.0: Designing a Responsive Model for Local Government Support in England’, INLOGOV Blog, 4 November 2025. Available at: https://inlogov.com/2025/11/04/intervention-3-0-designing-a-responsive-model-for-local-government-support-in-england/ [Also published as ‘How not to damage democracy’, Municipal Journal, 16 October 2025.]

Otjes, S. and Stiers, D. (2022) ‘Accountability and alternation: How wholesale and partial alternation condition retrospective voting’, Party Politics, 28(3), pp. 457–467.

Papadopoulos, Y. (2023) Understanding Accountability in Democratic Governance. Cambridge: Cambridge University Press (Elements in Public Policy).

Powell, G.B. and Whitten, G.D. (1993) ‘A Cross-National Analysis of Economic Voting: Taking Account of the Political Context’, American Journal of Political Science, 37(2), pp. 391–414.

Government documents

Ministry of Housing, Communities and Local Government (2024) Best Value Inspection Report: London Borough of Tower Hamlets. London: MHCLG. November 2024.

Ministry of Housing, Communities and Local Government (2026) Written Ministerial Statement: Tower Hamlets Best Value Intervention. London: MHCLG. January 2026.

Secretary of State for Housing, Communities and Local Government (2026) Enhanced Intervention Powers: Tower Hamlets. Ministerial Announcement. March 2026.

Intervention 3.0: Designing a Responsive Model for Local Government Support in England

Jason Lowther / Paul Joyce / Philip Whiteman

The arrival of the new UK government looks set to result in a new policy on central government’s intervention powers in local authorities, the third generation of such policies this century.  This article suggests some key lessons from earlier models. 

Intervention 1.0 was facilitated by Best Value legislation that an “authority must make arrangements to secure continuous improvement in the way in which its functions are exercised, having regard to a combination of economy, efficiency and effectiveness” (Local Government Act 1999).  This remains the basis of statutory interventions today.  But the context could not be more different. 

The Blair government commissioned an extensive set of national performance indicators, developed independently by the Audit Commission with a common definition and quality assured through local audits.  The “District Auditor” role maintained in depth contextualised knowledge of each local council, and could identify and flag significant governance or performance issues at an early stage.  As well as diagnosing problems, the Audit Commission’s national studies provided evidence-based recommendations to help improve local services’ economy, efficiency and effectiveness.

The strengths of this model were the comprehensive nature of the evaluation, its collective and mutually supportive use of expert agencies to provide an evidence base, and the sanctions that went with it including transparent public reporting.  Inlogov produced a series of reports diagnosing and explaining the causes of poor performance, analysing recovery planning and strategies for organisational recovery, evaluating various policy instruments for recovery (such as lead officials) and identifying the key developmental mechanisms for recovery. 

Our reports clearly demonstrated that the context for poor performance determines effective mechanisms for recovery: one size definitely does not fit all.  The causes of failure are varied, such as ineffective leadership arrangements and inadequacies in the operating culture. 

Improvement mechanisms need to address issues of cognition, capability and capacity.  Cognition is the council’s awareness and understanding of their performance trajectory, which is often resilient to changes in political control.  Capability concerns the construction and institutionalisation of a change-oriented vision by council leaders.  Finally, capacity is the ability to deliver the required vision and change. The required change mechanisms are both internal (such as leadership change) and external (for example, peer mentors, expert advisors, and funding). 

Intervention 2.0

The arrival of the Coalition government in 2010 brought rapid changes to intervention.  The Audit Commission was summarily discarded, publicly justified by claimed savings of £50m.  In reality, recent research by the Audit Reform Lab at the University of Sheffield suggests that English audits have higher costs and greater delays than in Wales or Scotland (where centralised oversight arrangements were maintained). 

From 2010 to 2020, central government intervention was relatively rare with formal interventions in only four councils.  However, from 2021 this situation changed substantially with interventions in eight councils in three years (none of these councils were controlled by the ruling national party).  In the same three years, there were statutory best value notices in a further nine councils.

It’s fair to describe this phase of intervention as less structured and evidence-based, without robust national data or independent routine inspection of councils.    

There has been limited evaluation of Intervention 2.0 to date.  Our early research findings based on three case studies suggest a five-stage model of intervention: (i) crisis revelation, (ii) delegitimisation, (iii) imposed reforms, (iv) capacity building, (v) restoration or reorganisation.  We conclude that under localism interventions were not merely administrative responses to failure but were deeply political acts that reshaped the legitimacy and capacity of local governance. The Commissioners, acting as technocratic agents of central government, connected central and local government, and had the effect of buffering the political tensions of intervention, while leading a process in which managerial competence rather than local democracy steered intervention.

Where next for intervention?

The raft of interventions related to section 114 notices, the establishment of the new Local Government Outcomes Framework and local audit reform including the Local Audit Office indicate a new phase of intervention and open opportunities to develop a more systematic and evidence-based approach.  More thought is needed on how this should work in future, including the role of peer reviews and inter-council support arrangements.  The centralisation of intervention power and the dominance of technocratic intervention needs to evolve to suit devolution and to provide greater support for local democracy. This could build on the new audit arrangements through a “district auditor” type overview of governance.

The acid test of reforms should be that while central government would still be able to intervene when councils were failing, the intervention process would minimise the suspension of local democracy, do as little damage as possible to the public’s trust in their local council, and foster good local democratic political leadership.

This article first appeared in the Municipal Journal on 16 October 2025 titled “How not to damage democracy”. It is available here: https://www.themj.co.uk/damage-democracy

Dr Jason Lowther is director of INLOGOV (the Institute of Local Government Studies) at the University of Birmingham.  Prof Paul Joyce is an Associate at INLOGOV.  Dr Philip Whiteman is a lecturer on public policy and administration at INLOGOV.

Politicians’ conceptions of fairness

Clive Stevens

“You won’t find many of them”, people quip when I tell them the title of my PhD; and my riposte, “that’s why I asked councillors”. And I was right; interviews with 17 councillors across four parties have revealed over 2,000 examples. Conceptions include: equality, proportionality, equity, fair opportunity, market fairness, fair administrative process and more. These conceptions were collected during the semi-structured interviews based on four carefully crafted vignettes (case studies). Thematic coding assisted their allocation into eight broad types (Realms) along with sub-categories like reciprocity, merit and efficiency. Sometimes the councillor denied they were talking about fairness, but they were; a simple reframing, usually changing a point of view, clarified the analysis, for example, council efficiency can be reframed as value for money and thus fairness to the taxpayer.

My PhD can be likened to an exploration. With me, the explorer, finding snippets of theory from various academic sources each describing a type of fairness and sometimes disagreeing with another. Thus equipped, I ventured into the jungle, Bristol City Council, and witnessed, watched and registered actual conceptions coming from actual politicians. I returned relatively unscathed and after analysis discovered much that agreed with theory but also much else. I now have a clear report to deliver about the eight, strange, fairness-beasts that rule their Realms and what happens when they mix.

Combinations

The findings map out the Realms more accurately and show that in certain circumstances a combination of Realms can elicit quite strong responses. For example, in one vignette, six councillors wanted to request a breach of council-house regulations to allow a tenant to sublet her flat. Reasons varied, but many were drawn to the description of her disadvantage, escaping an abusive relationship, and were impressed that despite all her problems she had not only sought work but actually landed a job. “Respect” and “this is the type of person we should be helping” were two of many responses. However, an equal number of councillors were totally unimpressed and thought she should be served notice as per the tenancy. 

Another vignette, about a large donation to the Children in Care Service, offered councillors three policy options. Eight wanted to make policy changes; and every one of those changes was based on making the choices fairer.

Fair Process or Outcome?

With this more reliable set of fairness definitions, the data can be analysed in many ways. For example, there is debate about whether fairness in Local Government should be about fair process or fair outcome, some arguing one way and some the other. I recall a council officer telling me that if a decision follows fair process from a fairly formulated policy, then it must be right whatever the outcome. But is that fair?

This data lets me measure the number of conceptions of fair process and the number of conceptions of fair outcome; there was little difference whether the councillors were male or female, new or experienced, and from different parties. But it did change and dramatically, if the councillor was or recently had been in a cabinet or committee chair position compared with backbench councillors. The latter group were much more interested in fairness of outcome. This is a finding from a qualitative study, so not definitive, but I’ve already had a number of conversations saying “that’s not surprising” each with suggested reasons. Perhaps a more rigorous study could be done.

Party Dogma?

Another question I’m asked is about the influence of parties. The interviews were conducted singly and confidentially; I hope I reached the councillors’ true views. One vignette asked them to come to a conclusion and vote based on their values, and then asked whether their vote might change if it were whipped. Many said they might change out of loyalty. Loyalty, like fairness, is a moral value and clearly quite powerful.

Wicked Problems

One of many potential uses is in understanding intractable “wicked” problems. These are made more wicked if there are value differences between the stakeholders. Fairness is a human value, so perhaps an understanding of fairness could assist in some small way to make headway with such problems that seem nowadays to be popping up everywhere.

What next?

I have just entered the final year; out of the jungle but not quite out of the woods, yet; there’s a lot of writing up to do, and then I’d like to use the findings and meet up with people interested in better understanding other councillors’ or parties’ values.

An ex-councillor in Bristol and author of the book on Local Government, After the Revolution, Clive followed up on politicians’ conceptions of fairness. He is now his final year of a PhD at the University of Bristol, interviews complete and writing it up. His personal blog site is: https://sageandonion.substack.com/