Paul Joyce, Jason Lowther, Philip Whiteman
What place does local government occupy within the UK system of public governance? International evidence suggests that UK local government combines three characteristics: comparatively low expenditure, small locally attributed tax revenue and medium-low institutional autonomy.
We now explore the evidence, draw conclusions, and clarify some of the assumptions and limitations of our conclusions.
Recently published OECD data indicate that United Kingdom local authorities account for expenditure equivalent to 9.3 per cent of GDP in 2023. This was below the EU27 average of 11.1 per cent of local government expenditure. Locally attributed tax revenue for the UK amounted to 1.7 per cent of GDP compared with an EU27 average of 3.7 per cent.
In this blog, “local government” refers to the OECD’s S.1313 local-government subsector. Depending on national institutional arrangements, this may include regional and other intermediate authorities as well as municipalities. See the note at the end of the blog for more on the OECD reporting of data.
The UK differs considerably in its expenditure and fiscal arrangements from some northern European countries, particularly Denmark, Sweden, Finland, and Norway, which have long been rated as having high scores on the published estimates of “Government Effectiveness” (see the World Bank published Worldwide Governance Indicators database). For the countries included in our analysis, local government tax revenue and expenditure are each moderately and positively associated with national government effectiveness (r=0.43 and r=0.44, respectively).
Three points should be kept in mind. First, these correlations establish association, not causation.
Second, “Government Effectiveness” is a national governance indicator that is based on perceptions of public services, the civil service, policy formulation and implementation, and government credibility. It is not a direct measure of local-government effectiveness. Its use in this analysis is on the grounds that local government is part of a multi-level governance system, interacts administratively and financially with central government, and may affect the effectiveness of the national governance system.
Third, the tax revenue data reported by the OECD do not measure only taxes over which subnational and local authorities have unilateral control and therefore are not appropriate for measuring tax autonomy. According to the OECD (2025), the reported tax revenue figure is partly own-source taxes and partly taxes shared with central government. We cannot immediately infer from these data how much discretion subnational and local governments possess over rates, tax bases, reliefs or use of revenue.
The results suggest that a relatively large and fiscally significant local-government sector is compatible with effective government, but they do not demonstrate that a large local fiscal role causes government effectiveness. Two findings stand out:
1. Countries with comparatively high local government expenditure or tax revenue generally have medium-high or high Government Effectiveness scores (see the World Bank’s databank).
2. Countries with low local government expenditure or tax revenue display a much wider range of government effectiveness scores. Türkiye, Mexico, and Colombia are at the lower end and Luxembourg, the Netherlands, and Switzerland are at the upper end.
The relationship involving tax revenue data is illustrated in Figure 1.
Figure 1. Scatterplot of government effectiveness and local government tax revenue, 2023
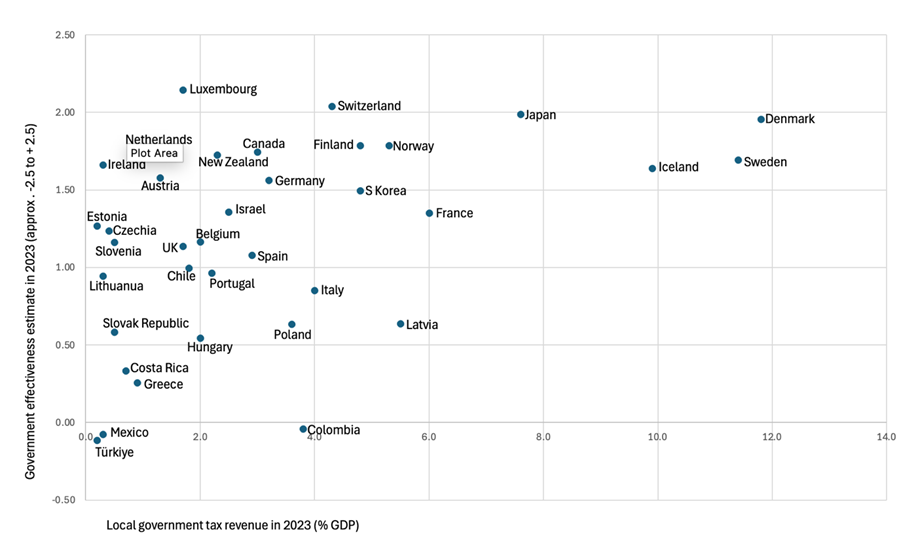
Note on tax data in Figure 1: For unitary countries we use the OECD’s main subnational figure, which corresponds to the S.1313 local-government subsector. For federal and quasi-federal countries, we use the separate “Local government alone” figures.
Using OECD data for 2023, we found a strong positive correlation (r=0.79) between local government expenditure and local government tax revenue. We hypothesise that countries with larger local government sectors provide the required finance partly through transfers of money from central government and partly through local taxes, fees and charges. Figure 2 illustrates the existence of a strong correlation between local government expenditure and tax revenue.
Figure 2. Scatterplot of local government expenditure and local government tax revenue, 2023
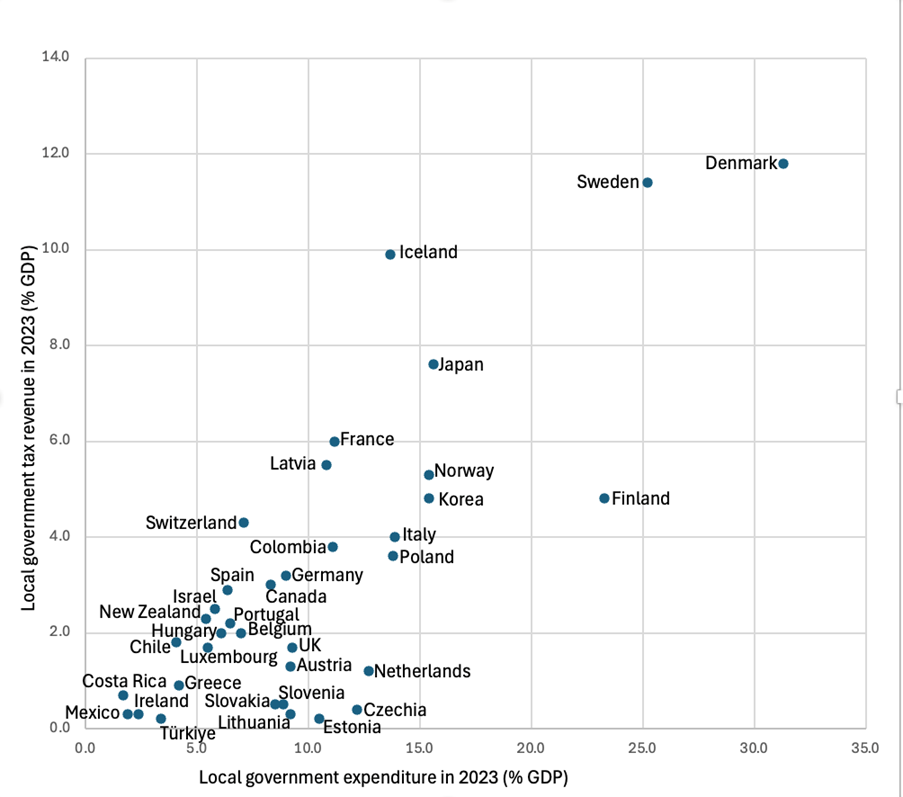
Note on tax and expenditure data in Figure 2: For unitary countries we use the OECD’s main subnational figure, which corresponds to the S.1313 local-government subsector. For federal and quasi-federal countries, we use the separate “Local government alone” figures.
Figure 2 also reveals the presence of a small group of countries in which locally attributed tax revenue is lower than would be expected based on the scale of their expenditure. This is evident visually: the countries lie noticeably below the general expenditure-taxation relationship implicit in the figure. As can be seen, this group includes Austria, Czechia, Estonia, Lithuania, the Netherlands, the Slovak Republic, Slovenia, and the United Kingdom.
Table 1 presents two measures of the relationship between tax revenue and expenditure for these countries: the tax coverage ratio and the local government tax-expenditure gap. The tax coverage ratio is calculated here by dividing tax revenue by expenditure and multiplying by 100. The tax-expenditure gap is calculated by subtracting tax revenue from expenditure, with both expressed as percentages of GDP. It represents the scale of local government expenditure not matched by locally attributed tax revenue. It is not a measure of a budget deficit and should not be understood as consisting entirely of central government transfers.
Table 1 Local government expenditure and tax revenue in selected countries, 2023
| Country | Local-government expenditure (% GDP) | Local-government tax revenue (% GDP) | Tax coverage ratio (%) | Local-government tax–expenditure gap (% of GDP) |
| Estonia | 10.5 | 0.2 | 1.9 | 10.3 |
| Czechia | 12.2 | 0.4 | 3.3 | 11.8 |
| Lithuania | 9.2 | 0.3 | 3.3 | 8.9 |
| Slovenia | 8.9 | 0.5 | 5.6 | 8.4 |
| Slovak Republic | 8.5 | 0.5 | 5.9 | 8.0 |
| Netherlands | 12.7 | 1.2 | 9.4 | 11.5 |
| Austria | 9.2 | 1.3 | 14.1 | 7.9 |
| United Kingdom | 9.3 | 1.7 | 18.3 | 7.6 |
Source: calculated from OECD (2025) data. For Austria, the “local government alone” figure is used.
The fiscal picture shown in Table 1 raises a broad institutional question: does it reflect a conception of local government as a distinct sphere of democratic governance, or primarily as an administrative means of delivering responsibilities determined nationally? The existence of low tax coverage (e.g., less than 20%) and a relatively large tax-expenditure gap (e.g., over 7 % of GDP) do not imply a fiscal imbalance because local government receives funding through a variety of mechanisms. Nevertheless, low tax coverage and a large gap is consistent with a system in which local authorities have significant service responsibilities but comparatively small locally attributed tax revenue.
We stress that expenditure and tax data do not by themselves establish the extent of local government autonomy. For autonomy has constitutional, political, and administrative dimensions as well as fiscal dimensions.
Therefore, we need to examine autonomy more comprehensively. We turn to the Local Autonomy Index (LAI 2.0) (see Ladner, Keuffer and Bastianen, 2025). According to this index, UK local government belonged to the medium-low autonomy group during the period 2015 to 2020. Its LAI score was below both the EU and OECD mean scores. It was not the lowest on local autonomy: some countries, including Ireland, Russia and Belarus, recorded lower levels of local autonomy than the United Kingdom.
The UK received a comparatively low score on the LAI’s “non-interference” dimension. This suggests that UK local government is subject to significant forms of financial and administrative supervision.
In summary, we conclude that the expenditure, revenue and autonomy evidence suggests that UK local government occupies a comparatively constrained position within the wider system of public governance. Local authorities perform important public functions, but the locally attributed tax revenue is small, and their institutional autonomy is only medium-low by international standards. In England, statutory intervention in authorities judged by national government to be failing provides a particularly visible example of the vertical powers of supervision and control retained by central government.
These findings do not demonstrate that greater fiscal decentralisation would automatically improve public services or government effectiveness. They do, however, provide grounds for carefully designed and evaluated pilot reforms intended to strengthen local fiscal and strategic autonomy. Such experiments would need to assess not only their effects on local choice and accountability, but also their implications for service performance, fiscal sustainability and territorial equality.
Note
The OECD uses “subnational government” to encompass state, regional and local government. In unitary countries without a regional tier, this may consist primarily of local government, which is municipal councils and higher levels of local government. In the case of the OECD data on the UK, the devolved administrations of Northern Ireland, Scotland and Wales are included in central government. Most of the countries in the OECD data are unitary countries, and so mostly we are talking about local government when looking at subnational data. The federal and quasi-federal countries included in this analysis are Austria, Belgium, Canada, Germany, Mexico, Spain, and Switzerland, for which local government data alone is also reported.
References
Organisation for Economic Co-operation and Development (OECD) (2025) Subnational governments: Structure and finance. 2025 edition. Paris: OECD. Available at: https://www.oecd.org/content/dam/oecd/en/topics/policy-issues/subnational-finance-and-investment/subnational-governments-infrastructure-finance-2025.pdf (Accessed: 21 July 2026).
Ladner, A., Keuffer, N. and Bastianen, A. (2025) ‘Local autonomy around the world: the updated and extended Local Autonomy Index (LAI 2.0)’, Regional & Federal Studies, 35(2), pp. 163–185. doi: 10.1080/13597566.2023.2267990.
World Bank (2026) Worldwide Governance Indicators. Available at: https://www.worldbank.org/en/publication/worldwide-governance-indicators (Accessed: 29 July 2026).

