How constrained is UK local government? International evidence on spending, taxation and autonomy

Paul Joyce, Jason Lowther, Philip Whiteman

What place does local government occupy within the UK system of public governance? International evidence suggests that UK local government combines three characteristics: comparatively low expenditure, small locally attributed tax revenue and medium-low institutional autonomy.

We now explore the evidence, draw conclusions, and clarify some of the assumptions and limitations of our conclusions.

Recently published OECD data indicate that United Kingdom local authorities account for expenditure equivalent to 9.3 per cent of GDP in 2023. This was below the EU27 average of 11.1 per cent of local government expenditure. Locally attributed tax revenue for the UK amounted to 1.7 per cent of GDP compared with an  EU27 average of 3.7 per cent. 

In this blog, “local government” refers to the OECD’s S.1313 local-government subsector. Depending on national institutional arrangements, this may include regional and other intermediate authorities as well as municipalities. See the note at the end of the blog for more on the OECD reporting of data.

The UK differs considerably in its expenditure and fiscal arrangements from some northern European countries, particularly Denmark, Sweden, Finland, and Norway, which have long been rated as having high scores on the published estimates of “Government Effectiveness” (see the World Bank published Worldwide Governance Indicators database). For the countries included in our analysis, local government tax revenue and expenditure are each moderately and positively associated with national government effectiveness (r=0.43 and r=0.44, respectively).

Three points should be kept in mind. First, these correlations establish association, not causation.

Second, “Government Effectiveness” is a national governance indicator that is based on perceptions of public services, the civil service, policy formulation and implementation, and government credibility. It is not a direct measure of local-government effectiveness. Its use in this analysis is on the grounds that local government is part of a multi-level governance system, interacts administratively and financially with central government, and may affect the effectiveness of the national governance system.

Third, the tax revenue data reported by the OECD do not measure only taxes over which subnational and local authorities have unilateral control and therefore are not appropriate for measuring tax autonomy. According to the OECD (2025), the reported tax revenue figure is partly own-source taxes and partly taxes shared with central government.  We cannot immediately infer from these data how much discretion subnational and local governments possess over rates, tax bases, reliefs or use of revenue.

The results suggest that a relatively large and fiscally significant local-government sector is compatible with effective government, but they do not demonstrate that a large local fiscal role causes government effectiveness. Two findings stand out:

1. Countries with comparatively high local government expenditure or tax revenue generally have medium-high or high Government Effectiveness scores (see the World Bank’s databank).

2. Countries with low local government expenditure or tax revenue display a much wider range of government effectiveness scores. Türkiye, Mexico, and Colombia are at the lower end and Luxembourg, the Netherlands, and Switzerland are at the upper end.

The relationship involving tax revenue data is illustrated in Figure 1.

Figure 1. Scatterplot of government effectiveness and local government tax revenue, 2023
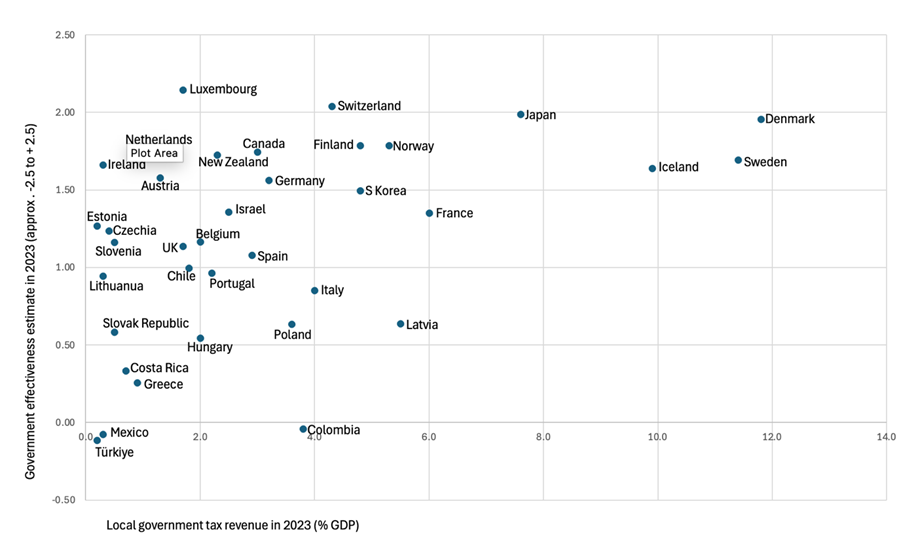
Note on tax data in Figure 1: For unitary countries we use the OECD’s main subnational figure, which corresponds to the S.1313 local-government subsector. For federal and quasi-federal countries, we use the separate “Local government alone” figures.

Using OECD data for 2023, we found a strong positive correlation (r=0.79) between local government expenditure and local government tax revenue. We hypothesise that countries with larger local government sectors provide the required finance partly through transfers of money from central government and partly through local taxes, fees and charges.  Figure 2 illustrates the existence of a strong correlation between local government expenditure and tax revenue.

Figure 2. Scatterplot of local government expenditure and local government tax revenue, 2023
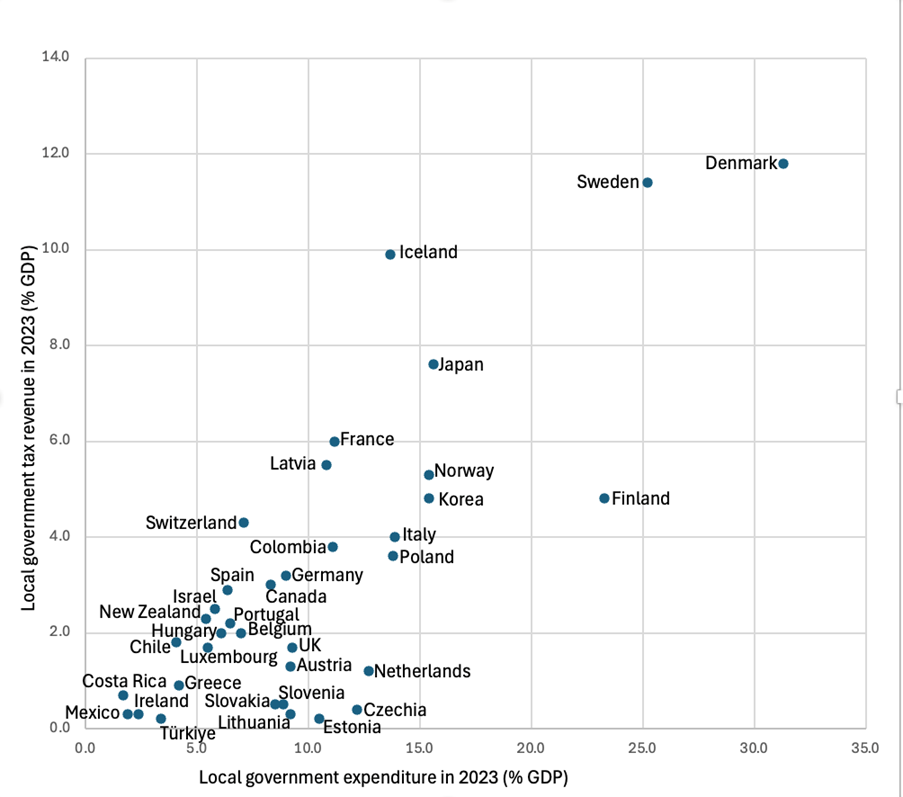
Note on tax and expenditure data in Figure 2: For unitary countries we use the OECD’s main subnational figure, which corresponds to the S.1313 local-government subsector. For federal and quasi-federal countries, we use the separate “Local government alone” figures.

Figure 2 also reveals the presence of a small group of countries in which locally attributed tax revenue is lower than would be expected based on the scale of their expenditure. This is evident visually: the countries lie noticeably below the general expenditure-taxation relationship implicit in the figure. As can be seen, this group includes Austria, Czechia, Estonia, Lithuania, the Netherlands, the Slovak Republic, Slovenia, and the United Kingdom.

Table 1 presents two measures of the relationship between tax revenue and expenditure for these countries: the tax coverage ratio and the local government tax-expenditure gap. The tax coverage ratio is calculated here by dividing tax revenue by expenditure and multiplying by 100. The tax-expenditure gap is calculated by subtracting tax revenue from expenditure, with both expressed as percentages of GDP. It represents the scale of local government expenditure not matched by locally attributed tax revenue. It is not a measure of a budget deficit and should not be understood as consisting entirely of central government transfers.

Table 1 Local government expenditure and tax revenue in selected countries, 2023

CountryLocal-government expenditure (% GDP)Local-government tax revenue (% GDP)Tax coverage ratio (%)Local-government tax–expenditure gap (% of GDP)
Estonia10.50.21.910.3
Czechia12.20.43.311.8
Lithuania9.20.33.38.9
Slovenia8.90.55.68.4
Slovak Republic8.50.55.98.0
Netherlands12.71.29.411.5
Austria9.21.314.17.9
United Kingdom9.31.718.37.6

Source: calculated from OECD (2025) data. For Austria, the “local government alone” figure is used.

The fiscal picture shown in Table 1 raises a broad institutional question: does it reflect a conception of local government as a distinct sphere of democratic governance, or primarily as an administrative means of delivering responsibilities determined nationally? The existence of low tax coverage (e.g., less than 20%) and a relatively large tax-expenditure gap (e.g., over 7 % of GDP) do not imply a fiscal imbalance because local government receives funding through a variety of mechanisms. Nevertheless, low tax coverage and a large gap is consistent with a system in which local authorities have significant service responsibilities but comparatively small locally attributed tax revenue.

We stress that expenditure and tax data do not by themselves establish the extent of local government autonomy.  For autonomy has constitutional, political, and administrative dimensions as well as fiscal dimensions.

Therefore, we need to examine autonomy more comprehensively. We turn to the Local Autonomy Index (LAI 2.0) (see Ladner, Keuffer and Bastianen, 2025). According to this index, UK local government belonged to the medium-low autonomy group during the period 2015 to 2020. Its LAI score was below both the EU and OECD mean scores. It was not the lowest on local autonomy: some countries, including Ireland, Russia and Belarus, recorded lower levels of local autonomy than the United Kingdom.

The UK received a comparatively low score on the LAI’s “non-interference” dimension. This suggests that UK local government is subject to significant forms of financial and administrative supervision.

In summary, we conclude that the expenditure, revenue and autonomy evidence suggests that UK local government occupies a comparatively constrained position within the wider system of public governance. Local authorities perform important public functions, but the locally attributed tax revenue is small, and their institutional autonomy is only medium-low by international standards. In England, statutory intervention in authorities judged by national government to be failing provides a particularly visible example of the vertical powers of supervision and control retained by central government.

These findings do not demonstrate that greater fiscal decentralisation would automatically improve public services or government effectiveness. They do, however, provide grounds for carefully designed and evaluated pilot reforms intended to strengthen local fiscal and strategic autonomy. Such experiments would need to assess not only their effects on local choice and accountability, but also their implications for service performance, fiscal sustainability and territorial equality.

Note

The OECD uses “subnational government” to encompass state, regional and local government. In unitary countries without a regional tier, this may consist primarily of local government, which is municipal councils and higher levels of local government. In the case of the OECD data on the UK, the devolved administrations of Northern Ireland, Scotland and Wales are included in central government. Most of the countries in the OECD data are unitary countries, and so mostly we are talking about local government when looking at subnational data. The federal and quasi-federal countries included in this analysis are Austria, Belgium, Canada, Germany, Mexico, Spain, and Switzerland, for which local government data alone is also reported.

References

Organisation for Economic Co-operation and Development (OECD) (2025) Subnational governments: Structure and finance. 2025 edition. Paris: OECD. Available at: https://www.oecd.org/content/dam/oecd/en/topics/policy-issues/subnational-finance-and-investment/subnational-governments-infrastructure-finance-2025.pdf (Accessed: 21 July 2026).

Ladner, A., Keuffer, N. and Bastianen, A. (2025) ‘Local autonomy around the world: the updated and extended Local Autonomy Index (LAI 2.0)’, Regional & Federal Studies, 35(2), pp. 163–185. doi: 10.1080/13597566.2023.2267990.

World Bank (2026) Worldwide Governance Indicators. Available at: https://www.worldbank.org/en/publication/worldwide-governance-indicators (Accessed: 29 July 2026).


Job half done, it’s time to tackle council tax

Jason Lowther

It’s hard to deny that the local government finance settlement this month marks big achievements for the ‘new’ (now almost two years old) government.  Labour’s manifesto promised that “to provide greater stability, a Labour government will give councils multiyear funding settlements”, and the new finance settlement duly covers three years.  By the end of this multi-year Settlement in 28-29, Core Spending Power will have increased by over 24% compared to 2024-25, equivalent to £16.6 billion.  And this increased amount is distributed in line with a new formula designed better to match resources to needs (albeit with £440m last minute tinkering).  There is much to celebrate here, which should give the government confidence to tackle another elephant in local government’s room: council tax.

Everyone knows that the council tax system is bad.  It’s outdated (based on 1991 values, before an eighth of current housing was built), highly regressive (people in cheaper homes often pay a higher proportion of their property value than those in expensive homes), regionally unfair (a recent article in the i newspaper found 292 council areas across England paying higher rates of council tax than they would in the wealthy Royal Borough of Kensington and Chelsea), and over centralised.

As Inlogov recommended to last year’s Select Committee on The Funding and Sustainability of Local Government Finance, the Government should start to improve council tax by amending council tax bandings and giving discretion on the details of the scheme’s design locally, such as the rates in each band and discount/subsidy arrangements.  The committee’s chair commented that “councils are trapped in a straitjacket by central government, with local authorities lacking the flexibility or control to devise creative, long-term, preventative solutions which could offer better value-for-money”.

There are already tentative moves to reform Council Tax in the different nations of the UK.  The Scottish Government no longer caps council tax increases but leaves this decision to local elected representatives.  This year’s Scottish Government budget also funded a revaluation of the highest value properties, with higher bands for properties valued over £1m (compared to the current highest band of £212,000), a change expected to affect around 1% of properties.  This is less radical than most of the options considered in the IFS report the Scottish Government commissioned to inform its decision.  In Wales, properties were revalued in 2003 and an additional council tax band above the highest band in England introduced.  In Northern Ireland, domestic rates are based on 2005 prices and a percentage rate applied.

In the long term major transformation of local government funding is required, as the Select Committee concluded:

In the long term, only true transformation, supporting a clear vision of what the role of local government should be, can make the local government funding system fair and effective. Beyond mere stabilisation, the Government must consider approaches to strengthen the system, including allowing councils to set their own forms of local taxes such as tourist levies, and placing stronger responsibility on central government to fund the services it requires local authorities to deliver. Central government, so used to its tight control of local government’s purse strings, must learn to ease its grip and let councils have more power to control their own affairs, accountable not to Westminster, but to their own local electorates.

As the government enters its third year, agreeing long term plans for local taxes could make a big contribution to the “change” they promised and turbo charge the real devolution we need.

Dr Jason Lowther is director of the Institute of Local Government Studies (INLOGOV) at the University of Birmingham. He was previously Assistant Director (Strategy) at Birmingham City Council and has worked at the West Midlands Combined Authority, Audit Commission and Metropolitan Police.

Are deferred local elections the real threat to UK democracy?

Jason Lowther

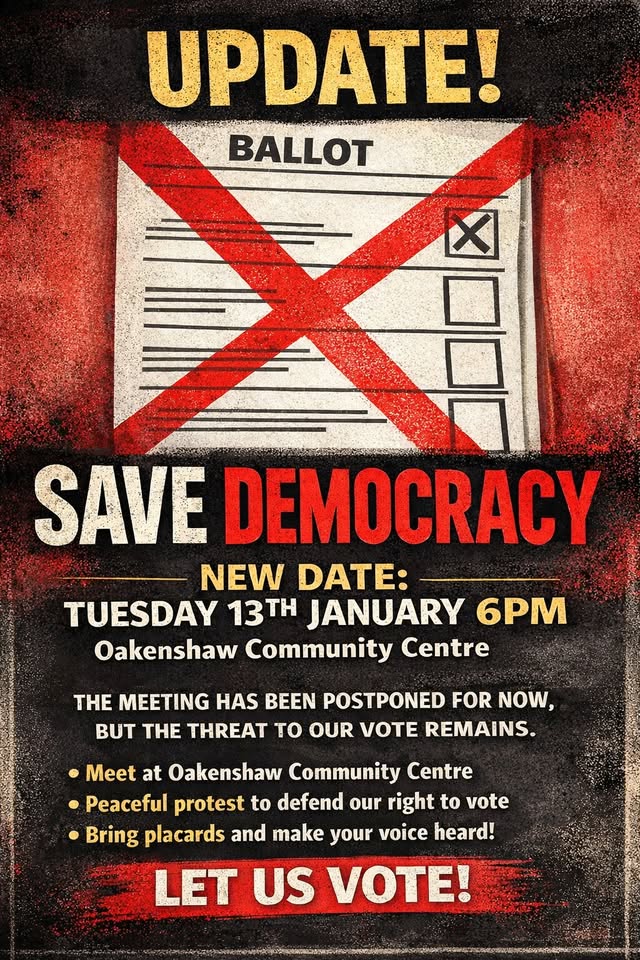
With dozens of English councils and hundreds of councillors facing delays to this year’s May elections, opponents claim the move could undermine public trust in democracy.  History shows deferral of elections in similar circumstances is rare but not exceptional.  There are however far bigger threats to the UK’s democracy.

Media reports today are suggesting that more than a third of eligible English councils have requested to delay their planned May 2026 local elections, potentially requiring around 600 councillors to serve an additional year.  These councils state that the Government’s ongoing local government restructure makes it difficult to run the polls effectively at the planned dates, and central government claims holding elections for councils that are soon to be abolished would waste time and money.  

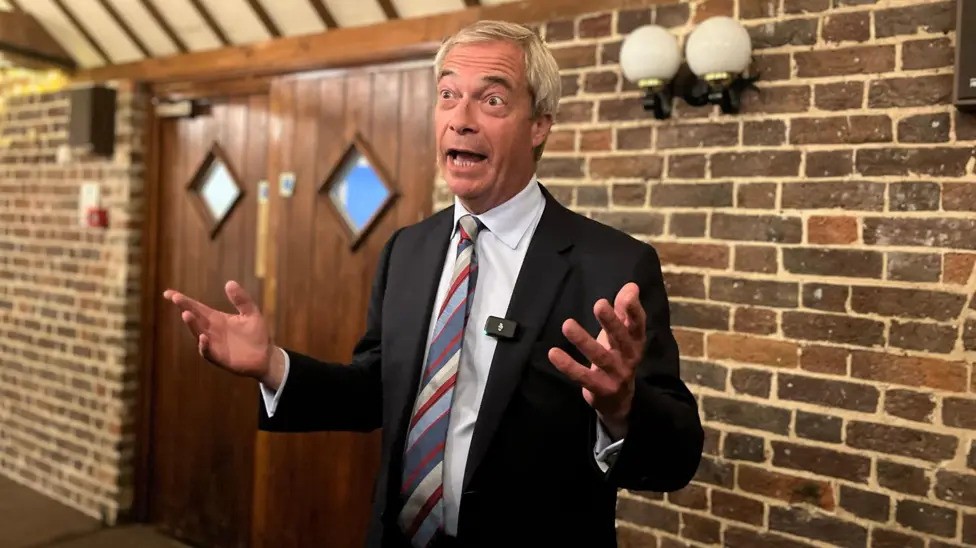
But the delays have sparked criticism, and even led to unrest at this week’s Redditch council meeting. Opponents argue the move weakens democratic accountability.  Reform UK leader Nigel Farage denounced the proposal as “monstrous”, claiming that “denying elections is the behaviour of a banana republic” and threatening a judicial review.  Conservative and Liberal Democrat MPs have also criticised the move.  The Electoral Commission’s chief executive said: “As a matter of principle, we do not think that capacity constraints are a legitimate reason for delaying long planned elections. Extending existing mandates risks affecting the legitimacy of local decision making and damaging public confidence.”

Delays to local elections in England have occurred previously.  During the Second World War, all local elections were suspended between 1939 and 1944, making this the most extensive postponement in modern history.  In peacetime, delays have largely been tied to local government reorganisation, most notably in the 1990s, when Parliament approved major structural reforms that abolished counties such as Avon, Cleveland, and Humberside and created 46 new unitary authorities.  These reforms led to altered or cancelled election dates to align with the establishment of new councils and avoid electing councillors to authorities that were about to be dissolved.  In 2025, nine councils had their elections delayed by one year to support transitions to new unitary structures.

But even though there are clear precedents for the current electoral postponements, there are other longer-term, more significant and worrying trends which risk seriously undermining our democracy.  Academic commentary shows growing concern among constitutional scholars that the UK’s democratic safeguards have weakened in recent years.  

Scholars at the UCL Constitution Unit  warned in 2022 that the UK faced a real risk of “democratic backsliding,” defined as a gradual erosion of checks and balances, growing executive dominance, attacks on civil liberties and the weakening of political norms that traditionally safeguarded constitutional stability.  Their analysis emphasised that democratic decline can occur incrementally through the actions of elected leaders, especially in systems like the UK’s where constitutional rules are flexible and can be rapidly altered.  

Further alarm was raised by Professor Alison Young at the University of Cambridge, who described the UK as standing on a “constitutional cliff‑edge.”  In her 2023 book, she argued that a series of constitutional changes and executive‑centric reforms have strengthened government power while weakening the political and legal checks that previously constrained it.  Young warned that without reforms to reinforce accountability, transparency, and oversight, the UK risks drifting towards “unchecked power,” eroding the democratic norms that underpin good governance.  

Last year, Dr Sean Kippin of the University of Stirling argued that recent Conservative governments engaged in “democratic backsliding” by deploying what he calls an “illiberal playbook,” using both lawful and legally dubious tools to weaken institutional checks, restrict protest rights, and compromise the independence of the Electoral Commission. His research concludes that “between 2016 and 2024, the Conservatives used power to diminish, weaken, and compromise Britain’s already imperfect democracy”.

There have been some positive moves by the ‘new’ Labour government to improve the functioning of our democratic system, such as the widening of voter ID criteria and promises to lower the voting age to16. However, overall there hasn’t yet been commitment to fundamental reforms to address the issues identified in the above reports, such as the impact of donations on political impartiality, and there have been some worrying developments, for example around civil liberties and the right to protest

A year’s deferral of elections to a disappearing council doesn’t fundamentally undermine our democracy, but failing to address the longer term and serious issues of democratic backsliding could prepare the way for those who will.

Dr Jason Lowther is director of INLOGOV (the Institute of Local Government Studies) at the University of Birmingham.  

References

Kippin, S., 2025. Democratic backsliding and public administration: the experience of the UK. Policy Studies, pp.1-20.

Russell, M., Renwick, A. and James, L., 2022. What is democratic backsliding, and is the UK at risk. The Constitutional Unit Briefing.

Young, A.L., 2023. Unchecked power?: How recent constitutional reforms are threatening UK democracy. Policy Press.

Picture credit: https://www.facebook.com/events/898249983102646/

Just how ‘burdensome’ is our tax system?

Chris Game

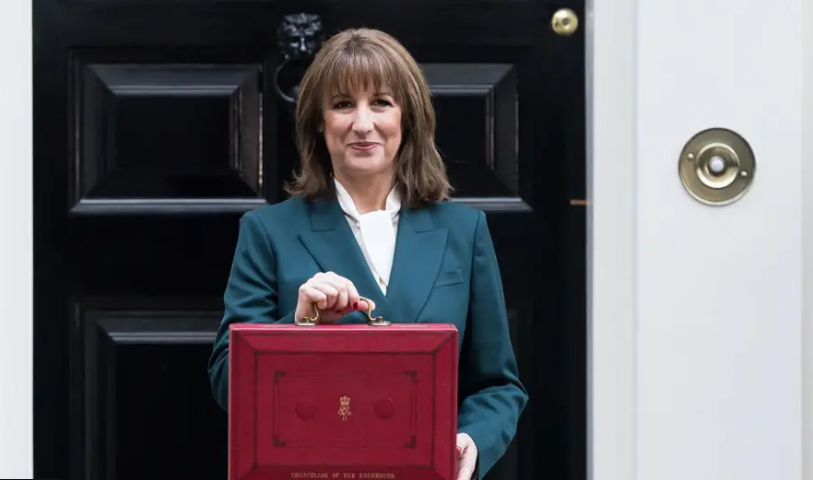
One of the almost unavoidable consequences of being comprehensively retired and with any kind of interest in politics is that you find yourself watching more of the Government’s annual, or biannual, Budget drama than you’d ever felt necessary during your working career. There are everyone’s speculations, the experts’ attempted explanations/simplifications, plus this time the botched premature release of the whole thing by the unfortunately titled (and now former) Chairman of the Office for Budget Responsibility (OBR) some 40 minutes before Chancellor of the Exchequer Rachel Reeves even took to her feet.

Anyway, unlike, I imagine, most of you lot, I actually sat through the whole Budget speech and at least the first bit of ensuing analysis by the ‘experts’. And, having done so, I almost immediately wished I’d counted the number of ‘tax burdens’ I’d heard – rather than, say, ‘tax rates’, which was the term I feel I grew up with, or tax levels, both of which are obviously more neutral and, you might think, more appropriate for a Chancellor of the Exchequer and at least some of her own party supporters.

I’ve no way of proving this, but it’s my strong impression that for most of my life the term ‘tax burden’ is one that would be used not in a Chancellor’s budget speech, but predominantly by slightly disgruntled taxpayers themselves or by Opposition parties and politicians, as a criticism of some specific tax or tax increase that the Government or Chancellor might be contemplating or had actually just imposed.

Gratuitous piece of information: we know that the public’s attitudes towards taxation and spending do fluctuate over time – partly but not entirely in relation/response to actual levels of taxation. Indeed, there’s an actual name for the study of such fluctuations: thermostatic theory, which, when I first learnt of it, I thought was something to do with people being happier when the sun’s out.

Anyway, the two words – tax and burden – are nowadays so closely linked, in the minds apparently of both payers and imposers, that they might as well be hyphenated. Quite early on in Reeves’ speech, therefore, and having acknowledged that freezing tax thresholds would hurt working people, she assured us that her plans were fair and that “the biggest burden would fall on those with the broadest shoulders”.

Not ‘fiscal impact’, ‘tax obligation’, or even ‘tax liability’, emphasising variously the effect on government finances or the legal duty to pay taxes, but that b-word from the outset and for any public expenditure. Nowadays, it seems, any tax increase, indeed any tax at all, is not just attacked as, but presented as, burdensome – a questioning of which, as I hope you’ll be gathering, was this blog’s main prompt. 

For it strikes me as odd, wrong and regrettable in several different ways. For a start, it’s almost certainly not how most of us were first taught about and introduced to taxes and their function. My guess is that explicit links would have been made between the public services with which as young people we would have been becoming familiar and benefitting from – education, healthcare, public safety, transport, waste management, emergency services – and their providers, and how our parents contributed in various ways to their funding, even those of which they weren’t necessarily regular or direct consumers.

No doubt we learned too, maybe indirectly, about their rising costs and the tax increases required to pay for them, but, if ‘burdens’ were mentioned at all, it would have been to explain that that was part of the deal in our advanced society. And, if our teachers were particularly keen, there might be some attempts to compare our levels/burdens with those of at least other European countries.

At which point – following a weekend wondering if I should email Jason and sound him out on whether he felt it would be worth my trying to turn these frankly rather meandering thoughts into an INLOGOV blog – at 10.00 a.m. precisely on Monday morning, there arrived a ResearchGate email announcing that our colleague Catherine Durose had just co-published an article asking “How should policy actors respond to buzzwords? Three ways to deal with policy ambiguity”[1].

It’s obviously impossible to summarise a 16-page article in a single blog paragraph, but the following desperate two sentences convey at least something of Durose and her three co-authors’ concerns. By using the lens of ‘buzzwords’, they “explain how actors in real-world policymaking contexts face ambiguity, then prompt debate on how to respond” (p.4). They focus our attention on “the temporality or the cyclical nature of ideas about better policymaking” … highlighting “the ambiguity that often accompanies these cycles”, and encapsulate “what these dynamics can feel like to policy actors …” (p.5).

Which brings me to my closing paragraphs and my concern about the seemingly incessant use of the ‘tax burden’ phrase – which could easily, it seems to me, make any comparative newcomer or innocent suppose that this ‘burden’ would surely reflect the UK’s position near the top of at least the European overall tax level list.

However, as anyone who has ever spent more than a few minutes ‘researching’ this tax burden question knows well, if anything, the reverse is the case. True, UK tax as a proportion of GDP (Gross Domestic Product) is currently close to its highest since 1945, but for a single worker on an average wage, we have one of the lowest ‘tax burdens’ among both G7 (Canada, France, Germany, Italy, Japan, UK and US) and OECD countries.

Other data sets are, of course available, but if, as would seem most likely, our newcomer/innocent were thinking of personal income tax levels, they’d be pretty comprehensively wrong. In the December 2025 table of ‘Top Statutory Personal Income Tax Rates in 35 Major European Countries’ the UK’s precisely 45% personal income tax rate puts us in 16th place – yes, above halfway, but not by much, and way behind the eight 50% pluses: headed by Finland (57%), Denmark (56%), and France (55%).

So, if 45% warrants the term ‘burden’ pretty well every time it’s mentioned, I wonder what translated nouns citizens of some of these countries use?  And might it not be time for at least our Chancellor (or Chancelloress) of the Exchequer to modify the ‘burden’ references?  Oh yes, and can Durose et al. also please work on a positive buzzword/phrase to substitute for ‘tax burden’?


[1] Richardson, L., Durose, C., Cairney, P. and Boswell, J., 2025. How should policy actors respond to buzzwords? Three ways to deal with policy ambiguity. Policy Sciences, pp.1-16.

Image of chancellor: https://www.bbc.co.uk/news/articles/cewjkv8jylko

Chris Game is an INLOGOV Associate, and Visiting Professor at Kwansei Gakuin University, Osaka, Japan.  He is joint-author (with Professor David Wilson) of the successive editions of Local Government in the United Kingdom, and a regular columnist for The Birmingham Post.

Openness of council finances is key for a functioning democracy

Matty Edwards, Research For Action

Local authorities are under immense pressure to find savings whenever they can. After more than a decade of austerity, the collective deficit in the sector is expected to reach £9.3bn by next financial year. Local authority finances have also become increasingly speculative, as budgets are prepared on the basis of unpredictable grant allocations and single-year financial settlements, sometimes without audited accounts. Pressures to find new sources of income through commercial investments and private sector partnerships have also increased the complexity of council funding.

This creates a challenge: scrutiny of local government finance is more important than ever. Yet even with the best intentions, local authorities struggle to produce open and accessible financial information. 

In a research collaboration between Research for Action and the University of Sussex, we set out to explore how financial information — such as council budgets and accounts — could be made more accessible to the public. Our research found that even experienced researchers, accountants and councillors struggle to find and understand local authority financial information.

We spoke to 26 people from the local government sector over three months this spring to examine barriers to making local authority financial information accessible to councillors and the wider public. Interviewees included councillors from a range of authorities, council officers, academics, accountants, journalists and key sector bodies like CIPFA. 

Our key findings were a lack of standard reporting requirements, strained council capacity after years of austerity and a fragmented data landscape with no standard formats for publishing financial information. These barriers make it difficult to understand a single council’s finances and make comparisons across the sector, hindering effective scrutiny by councillors and journalists, and democratic participation by the public. 

Some interviewees argued that accessibility was less of a priority in the face of a mounting crisis in local authority finances, but in our view, openness is not a luxury. It is key to effective local democracy. 

How to improve open up council finances

Based on our findings, we set out a series of recommendations for greater transparency and openness. 

The government should introduce new data standards for local government to improve accessibility, potentially via a Local Government Finance Act. This should include making financial information machine readable where possible and using accessible file formats. An easy win in this area would be to create a single repository for all local government financial information.

Local audit reforms are also an important piece of the puzzle. The new Local Audit Office (LAO) should be made responsible for local government financial data, including making it publicly available with tools to enable comparison and oversight. A more ambitious idea for the new LAO could be to create a traffic light warning system for the financial health of local authorities based on indicators that are timely and easy to understand, taking inspiration from Japan

Council accounts were highlighted as a particularly technical and opaque part of local government finance. That’s why councils should be mandated to attach a narrative report to their annual accounts, as previously recommended by the Redmond Review.

We think that the Local Government Data Explorer, recently scrapped, should be replaced with a data visualisation that is genuinely accessible and interactive, perhaps taking inspiration from a dashboard created by academics in Ireland. There should also be funding for local open data platforms, because there have been isolated examples of successes, such as the Data Mill North. 

The other part of the problem is that councillors often don’t have the knowledge and skills to properly scrutinise the complicated world of local government finance. That’s why we’re calling for greater support and training for councillors to enable better financial scrutiny, as well as public resources to improve literacy around local government.

While the sector faces great upheaval in the next few years through local government reorganisation and English Devolution, these reforms also present an opportunity to improve transparency – whether that’s at unitary or combined authority level. 

We believe that greater openness will ultimately facilitate better public participation and healthier local democracies.

Matty Edwards is a freelance journalist based in Bristol who also works for Research For Action, a cooperative team of researchers that in recent years has investigated PFI, LOBO loans, the local audit crisis and scrutiny in local government.

Win an election and implement your manifesto – that’s novel!

Image: Emily Sinclair/BBC https://www.bbc.co.uk/news/articles/c367lry5ypxo

Chris Game

First, a reader alert. What follows is in essence an only marginally revised column written for and hopefully published in this week’s Birmingham Post, to which for many years now I’ve been a regular contributor. Thanks, at least in part, to the “many years”, I’m permitted a wide scope of subject matter, but for obvious reasons local government in some form or other is what I tend to resort to most frequently – not least around local election season.

With the Post’s Thursday publication date, this is a mixed blessing, knowing that most readers interested in these matters would very likely have learned the results of the elections before they read one’s prognostications and predictions. What follows here, then, is my third column focused on this year’s local (County/Unitary Council) elections, which were, of course, limited to just 24 of England’s 317 local authorities (plus the Isles of Scilly) and precisely none in, never mind Birmingham, the whole metropolitan West Midlands.

Faced with the alternative option of ignoring the topic altogether, I decided to focus on the four West Midlands County Councils: three with biggish, if declining, Conservative majorities – Shropshire, Worcestershire and Warwickshire – plus STAFFORDSHIRE: Labour for decades, but Conservative since 2009, and, until the May council elections, with 55 Conservative councillors out of 62, almost as Tory as they come.

However … since last July, when the county’s parliamentary constituencies all went Labour, Nigel Farage’s Reform UK Party had been energetically hoping to build in Staffordshire on what statistically had been among its most promising performances. And indeed it did: Reform UK: 49 of the 62 County Council seats, leaving the previously controlling Conservatives with 10, and Labour, Greens and Independents 1 each. The Lib Dems, along with UKIP, the Workers Party of Britain and others, failed to score.

It typified results across the country. On what nationally was an exceptionally quiet election day, Reform UK increased its nation-wide base of just two councillors (both on Hampshire’s Havant Borough Council), to a relatively massive 677 (39% of the total seats contested) and gained majority control of no fewer than 10 of the 23 councils.

One can only speculate at some of the results that a fuller involvement of, say, the 130 unitary authorities, metropolitan districts and London boroughs might have produced. I concluded that Election Day column, though, not with any numerical predictions, but with Farage’s most publicised campaign observation/pledge: “We probably need a DOGE for every single county council in England”.

Which could have sounded a touch presumptuous from the Leader of a party who had approached that Election Day holding just two of the 1,700+ seats ‘up for grabs’ – but not from Farage.

I did wonder, though, what onlookers would make of that DOGE acronym (or, in some versions, D.O.G.E. – that’s how novel it is). Indeed, even Reform candidates, who probably knew at least that it stood for the love child of President Trump and the recently very departed Elon Musk’s Department Of Government Efficiency, trod carefully.

Created, they could possibly parrot, to “modernise information technology, maximise productivity and efficiency, and cut wasteful spending”, but did they have any real idea of how the function and office might work in a UK political context? Or did they possibly assume that, like so many campaign pledges, even if, rather incredibly, a DOGE majority did emerge, it would find itself, at least for the present, on the ‘too hard just now …. we’ve only just elected our Leader’ pile?

Certainly I, while having at least some idea of what county councils having an English DOGE might entail, would definitely NOT have predicted that, within just one month of those county elections, one of England’s biggest and traditionally most Conservative counties, KENT, would be preparing to face an ‘Elon Musk-style’ DOGE audit by a team of technical experts assembled specifically to analyse its £2.5 billion-plus budget spending and assess its financial efficiency.

Since the past weekend, the ‘Elon Musk-style’ bit will possibly have been played down, but not, seemingly, the ongoing implementation. With LANCASHIRE – £1.2 billion budget – already announced as next on the list, this just could prove insightful and potentially serious stuff.

Until May 1st, Kent County Council comprised 62 Conservatives, 12 Lib Dems, 4 Greens, 0 Reform UK.  Since then, it’s been 10 Conservatives, 6 Lib Dems, 5 Greens, and 49 Reform UK. If dramatic change is to be the agenda, Kent seemed an apt and attention-guaranteeing choice. 

By any measure, and almost whatever happens next, that – in my book, anyway – is an impressive achievement. There’s been, predictably enough, ‘Establishment’ outrage – “a superficial response to the deep problems of local government” … “initiating a review of local authority spending misunderstands the circumstances facing local authorities … All councils have been caught in an iron triangle of falling funding, rising demand, and legal obligations to deliver services. In that context every local authority has had to make difficult choices to cut services …” (Institute for Government).

On the other hand, win an election and implement your party manifesto! – a demonstration that turning out and voting in local elections, even in our exceedingly non-proportional electoral system – can produce policy action.

Or, rather, especially in our exceedingly non-proportional electoral system. Two of the new Combined Authority mayors (outside the West Midlands) were elected on under 30% of the votes cast, and obviously a much smaller percentage still of the registered electorate.

This follows the recent ditching of the Supplementary Vote in favour of ‘First-Past-The-Post’, where voters pick just one candidate, and the one with the most votes wins – even if, as this time in the West of England, that percentage was under a quarter of an already very modest turnout.

To me, anyway, it’s arguably even more important in these local/Mayoral elections than in parliamentary ones – for us, the elected Mayors, and democracy generally – that voters can indicate their first AND SECOND Mayoral preferences, thereby ensuring that, however low the turnout, the finally elected winner can claim the support of at least a genuine majority of voters.  Which means electoral reform – but that’s another column/blog.

Chris Game is an INLOGOV Associate, and Visiting Professor at Kwansei Gakuin University, Osaka, Japan.  He is joint-author (with Professor David Wilson) of the successive editions of Local Government in the United Kingdom, and a regular columnist for The Birmingham Post.