Chris Game
A recent SocietyGuardian article on the impact of demographic change on local authority service provision by David Brindle, the paper’s Public Services Editor, produced considerable social media comment, but not apparently any actual sighting of the item that kicked the article off: the so-called Barnet Graph of Doom. Time, therefore, for an unveiling, and some demystification.
Brindle introduced the BGoD as:
“a PowerPoint slide, showing that within 20 years, unless things change dramatically, [Barnet Council] will be unable to provide any services except adult social care and children’s services. No libraries, no parks, no leisure centres – not even bin collections.”
Dramatic enough in itself, you’d have thought, but Brindle ratchets up the drama by seeming to imply that the Doom Graph is both new and so sensitive as to be virtually classified:
“The slide … now features regularly in presentations by Sir Bob Kerslake, permanent secretary at the [DCLG] … Whether he has dared to show it to communities secretary Eric Pickles, defender of the Englishman’s inalienable right to a weekly bin round, is unknown.”
In fact, speculation is unnecessary, as the slide in question has been in the public domain for nearly eight months now. It comes from a three minute video presented by Councillor Dan Thomas, Cabinet Member for Resources, as part of one of Barnet Council’s regular budget consultation exercises. The presentation is on both the Council’s website and YouTube, and therefore as available to the minister as it is to Barnet residents, you and me.
Whether Sir Bob makes use of more than the single slide Brindle doesn’t say. But, unable to break a lecturer’s lifelong weakness for promising visual aids, I certainly would have done – in fact, will do so here – because I reckon the video, though brief, provides a better introduction to the causes and scale of the challenges facing all major local authorities over the coming few years than many have managed.
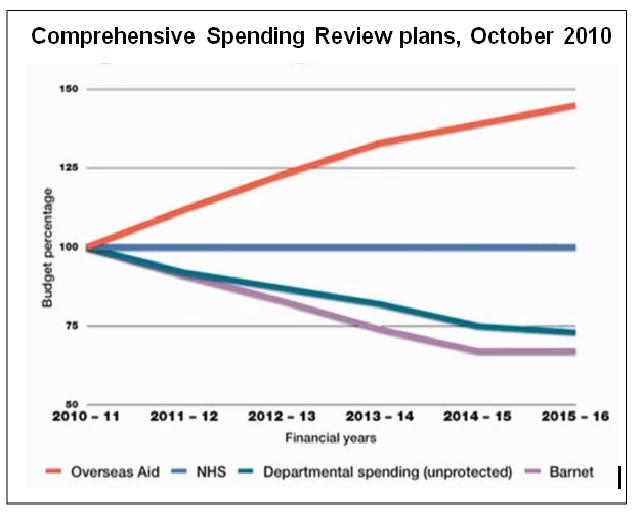
The video starts from the Government’s October 2010 Spending Review plans to cut total public spending by £81 billion by 2014-15, but not equally across the board. With the NHS budget (nearly 13% of the total) protected and Overseas Aid, though small, increased, the hit taken by the unprotected DCLG, and as a result by local government, would be over 28%.
The video starts from the Government’s October 2010 Spending Review plans to cut total public spending by £81 billion by 2014-15, but not equally across the board. With the NHS budget (nearly 13% of the total) protected and Overseas Aid, though small, increased, the hit taken by the unprotected DCLG, and as a result by local government, would be over 28%.
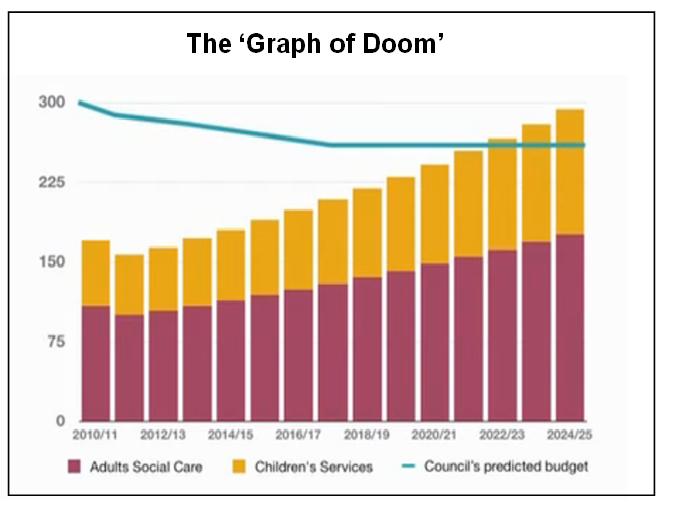
For Barnet, other things too will change. With a population of 350,000, the borough is already the largest in London and faces further growth at both ends of the age spectrum – 17% more 5-to-9s and 25% more over-90s by 2016. There is substantial development in the west of the borough, currently requiring more reception places and in future more secondary school places. Which brings us to the Graph of Doom.
Barnet Council estimates that over the four-year Spending Review period it will lose roughly 30% of its income, requiring matching reductions in spending. The bar chart plots the predicted spending on adult social care and on children’s and family services over the coming decade – showing that, without significant changes in the way these services are provided and/or in councils’ funding, the increasing numbers it will be supporting mean that by 2022-23 it would be providing only social services, there being no money left for anything else. Not classified information, then, but definitely sensitive.
The graph’s original purpose, it should be remembered, was to prompt Barnet residents to think about what their spending priorities would be for the immediate and medium-term future – and, no doubt, to concentrate the minds of members and officers. It was not the product of a sophisticated modelling exercise and, as its authors would surely acknowledge, it has obvious limitations.
It takes no account, for example, of future economies and efficiency savings or of increased income stemming from planned regeneration, particularly of the Cricklewood/West Hendon/Brent Cross area. On the other hand, though, it seems to assume a more or less neutral 2013 Spending Review, rather than another round of austerity measures, as currently looks more likely. In short, though not all-inclusive, its depiction of a calculably approaching funding crisis is more than ‘real’ enough to warrant serious attention from all who should be concerned.
The new Coalition Government seemed concerned – when one of its first actions was to ask Andrew Dilnot, a former Director of the Institute for Fiscal Studies, to chair a three-person Commission on the funding of elderly care and report back, with recommendations, within the year.
The Commissioners were emphatically concerned. They found the current funding system barely comprehensible, frequently unfair, and urgently in need of reform. Their key recommendations proposed:
• capping individuals’ lifetime contributions towards their social care costs – at around £35,000 – after which they should be eligible for full state support;
• increasing the means-tested threshold, above which people are liable for their full care costs, from £23,250 to £100,000;
• limiting liability for the costs of accommodation and food paid by people in a care home to £10,000 p.a.
The Commission’s full set of proposals, it estimated, would increased public spending by £1.7 billion p.a., rising to £3.6 billion by 2025 – equivalent to 0.25% of the total: “a price well worth paying” to remove people’s fear of having to sell their homes and spend almost all their wealth on care.
Ministers, particularly those in the vicinity of the Treasury, then became concerned to the point of agitation – at the capping proposal and the overall price tag. Dilnot was welcomed, but, as Health Secretary Andrew Lansley put it, as “a basis for engagement” – to be followed by more consultation, a delayed White Paper, and legislation “at the earliest opportunity thereafter”.
Whereupon the LGA became volubly concerned, with good reason. In an unusual cross-party initiative, Chairman Sir Merrick Cockell wrote to the three main party leaders on behalf of all LGA political groups, pointing out that social care already takes up more than 40% of council budgets, that demographic pressures alone will add £2 billion p.a. to these costs by 2015, and calling on Ministers to work urgently with local government in introducing radical Dilnot-type reforms.
Since then, the White Paper has been further postponed and will not address the funding issue anyway, the Queen’s Speech contained no relevant legislation whatever … and Doom gets ever closer.
Chris Game is a Visiting Lecturer at INLOGOV interested in the politics of local government; local elections, electoral reform and other electoral behaviour; party politics; political leadership and management; member-officer relations; central-local relations; use of consumer and opinion research in local government; the modernisation agenda and the implementation of executive local government.


Pingback: PS Launchpad 7: Wider implications | Martin Howitt's blog
Pingback: A ‘Think Piece’ on The Future of Public Parks – The Parks Alliance
Hmm is anyone else encountering problems with the images on this blog loading? I’m trying to determine if its a problem on my end or if it’s the blog. Any feed-back would be greatly appreciated.
Looks ok to me, are you still having problems viewing?