Children’s Services Spending: Where has the axe fallen?

Calum Webb (University of Sheffield) and Paul Bywaters (Huddersfield University)

Children’s and Young Peoples’ Services, encapsulating children’s centres, safeguarding and social work, family support, services associated with looked after children, often totals nearly £10 billion of spending annually. Despite this, limited attention is paid to how these funds are spent, and much less is known about how such spending has changed over time. Has spending increased or decreased under austerity? Have budgets for front-line services for some of the most vulnerable and voiceless members of society – children at risk of abuse and neglect – been protected, as is often claimed, or axed, in the face of the rising strain placed on local government finances? Where cuts have been made to cope with reduced budgets, where have they fallen? Have cuts to children’s services been greater in more deprived local authorities, as previous research by the Joseph Rowntree Foundation has indicated, further disadvantaging children from poorer communities and with greater needs?

The contradictory findings from government departments does not inspire confidence in their ability to answer any of these questions convincingly. A 2016 report from the National Audit Office concluded that expenditure on children’s services had risen by approximately 12 per cent between 2012 and 2015. This report, however, only looks at a sum of between £1.6 billion and £1.8 billion, and we had no luck replicating this figure – not with any combination of categories or adjustments for inflation.

A more recent report published by the Department for Education came to fundamentally different conclusions, namely that total expenditure had fallen by 9 per cent between 2010 and 2016, and that between 2012 and 2015, the same period covered by the NAO report, spending had reduced from £9.2 billion to £8.9 billion, a 3 per cent reduction.

The problem is partly down to the quality of the data – the inconsistency of categories between years prevents any meaningful long term comparisons of very specific spending areas. A few of the broader spending categories are fairly stable over time, namely spending on looked after children and spending on safeguarding, and the remainder of categories can loosely be considered ‘preventative’ or ‘early intervention’ services. These are the Sure Start centres or family support services that are intended to address the difficulties children in need may face before these problems develop to the point that they require more drastic interventions.

The second major problem with the official reports is the tendency to only focus on changes in the total national levels of expenditure, rather than focusing on what has been happening on a local authority level. All it takes is a few of the larger local authorities, the ‘big spenders’, to see an increase to dwarf many negative trends in smaller local authorities. This approach therefore doesn’t necessarily reflect the reality for children across England.

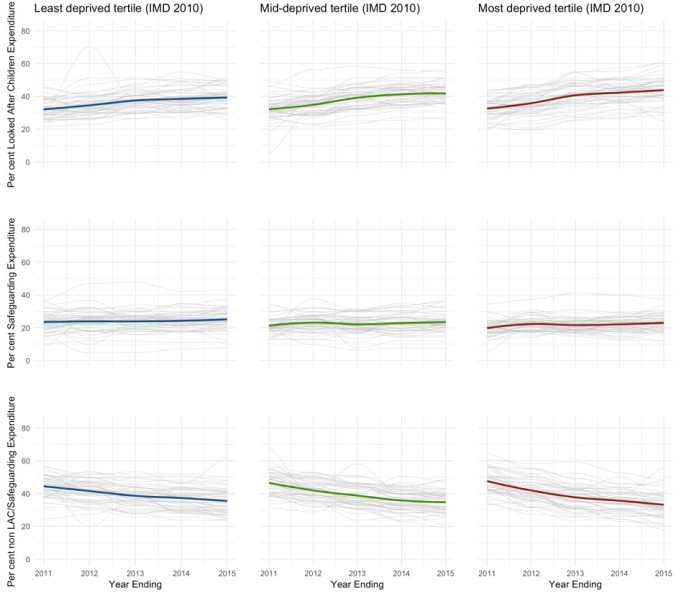
When we looked at expenditure after taking these things into account we found very clear patterns. The most deprived 20 per cent of local authorities had seen reductions in spending of 25 per cent, whereas the least deprived 20 per cent have had cuts of 4 or 5 per cent. When we split local authorities into three equally sized groups of 50 (the City of London and Isles of Scilly LAs are excluded as outliers), based on their deprivation scores, we found significant differences in the expenditure trends: rapid rundowns of expenditure per child in the 50 most deprived local authorities, less extreme cuts for the 50 ‘middle’ deprived local authorities, and far less severe cuts for the 50 least deprived local authorities. This is in part due to the indiscriminate way in which austerity measures have been introduced, without attention to the fact that more deprived local authorities typically have higher spending per child to meet greater levels of more complex needs. This means a hypothetical 10 per cent cut in Middlesbrough is going to result in a much bigger loss of £-per-child than a 10 per cent cut in Wokingham.

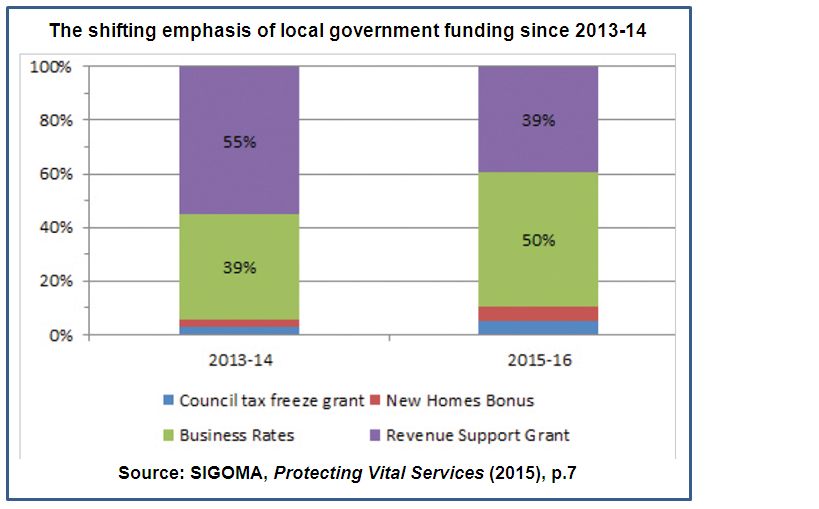
What’s more is that the share of spending across the different services has changed substantially, mirroring patterns in social work practice more broadly. The share of spending has shifted away from the aforementioned preventative and support services in favour of maintaining the share of safeguarding spending and increasing the share of looked after children spending. On average, local authorities spent around 46 per cent of their children’s services budget on more prevention focused services in 2010-11. By 2014-15 this had fallen to only 33.5 per cent. This has been fairly universal across all local authorities, but slightly more extreme in the most deprived third, and is best seen visually.

CW graph for blog feb

We don’t know completely what impact this will have on the lives of children, but we do know that since 2010 there has been evidence of an increase in demand for children’s social services; with average Looked After Children rates increasing from 57.5 children per 10,000 in 2010-11 to 62 children per 10,000 in 2014-15, and the number of children in the population rising by approximately 750,000 since 2010. Furthermore, this population increase has been largely concentrated in the most deprived local authorities (12%) compared to the least deprived local authorities (4%), meaning stable intervention rates – such as rates of children in care – actually represent a substantial increase in workload for practitioners. This is just one part of a complex picture of disadvantage that children living in poverty face. What we do know is that there needs to be a clear commitment to improving the quality and detail of the data that is collected about expenditure and deprivation because, as Ofsted’s Annual Report has acknowledged, there is a link between this and the quality of the services children receive across the country.

The research presented here was funded by the Nuffield Foundation and is part of the Child Welfare Inequalities Project and will be published in Local Government Studies in February 2018. Evidence from the project is being presented to an APPG for Children on the 7th February 2018.

Calum WebbCalum Webb is an ESRC White Rose postgraduate research student at the University of Sheffield’s Department of Sociological Studies. He has recently contributed to the ESRC funded research project ‘Developing a Policy Learning Tool for Anti-Poverty Policy Design and Assessment’ and the Nuffield Foundation funded ‘Child Welfare Inequalities Project’. His PhD research investigates approaches to the longitudinal measurement of multidimensional poverty. Calum tweets using @cjrwebb

Paul BywatersPaul Bywaters is Professor of Social Work at Huddersfield University working in the Centre for Applied Childhood, Youth and Family Research. He has led a series of research projects funded by the Nuffield Foundation and the Joseph Rowntree Foundation which have examined inequalities in the incidence of and responses to child abuse and neglect between and within the four UK countries. For more information can be found here. Paul tweets using @PaulBywaters


Queen Cersei and the evaporating Revenue Support Grant

Chris Game

Next week is the last week of Hilary Term, or revision week at the end of Spring Term, as it’s known here at the UoB and most other universities who feel no great affinity to the probably inappropriately named 4th Century St Hilarius of Poitiers. Over the many years in which I lectured undergraduates, I used rather to like it: end of the course/module in sight, legitimate chance to share and spread gossip about approaching local elections, lecture attendances boosted by students desperate for exam hints. Plus, nowadays, plenty of discussion-prompting visual aids – one of which is the pretext for this blog.

SIGOMA is not – disappointingly perhaps – an African hip-hop band, but less catchily the Special Interest Group of Municipal Authorities (outside London) within the Local Government Association. Yes, even the brackets are part of the full name – which has to convey that its 45-council membership comprises most major urban authorities in the North, some in the Midlands, plus the ‘South Coast regions’ of Plymouth and Portsmouth. The 45, claim SIGOMA, share similar characteristics and can therefore advantageously speak with a collective voice – moreover, with one that, particularly following the Coalition’s changes to the local government funding system, needs to be distinctive from that of the LGA with its responsibility for somehow representing the interests of all its 400+ member authorities.

These funding changes, argues SIGOMA, are so divisive, and their impacts so damaging to areas with characteristics like those of its members, that they threaten to set region against region in the manner of – well, Game of Thrones.  As even non-followers of the popular TV series may be aware, the US fantasy drama chronicles the violent dynastic struggles for control of the Iron Throne of the Seven Kingdoms of Westeros. SIGOMA’s spoof YouTube video is Game of Cuts Winter is Coming for Councils – and, at under 2½ minutes to Game of Thrones’ soon-to-be-five seasons, it’s inevitably (even) less subtle.

The Sean Bean character, Lord ‘Ned’ Starp, Warden of the North (possibly Steve Houghton, Leader of Barnsley MBC, SIGOMA’s administrative base?) and his mate from the Coastal Ports, protest that “our people are already on their knees … the sick have no one to care for them, and our children nowhere to read …”, while the spokesperson for “the hamlets of Bucks and Berks” remonstrates that they too are suffering, with “not enough funding to keep our tables supplied with swan and game”.  But sadistic Queen Cersei of the South and her incest-conceived son, King Joffrey, are unmoved: “All the regions have had to make their sacrifices. The money has been spread evenly and you will cope, for the sake of the Seven Kingdoms”.

Doubtless, Local Government Minister Kris Hopkins’ family arrangements are altogether more conventional, but his presentation of the 2015-16 finance settlement last December suggests similarly briefed scriptwriters:

“The local government settlement is fair to all parts of the country – north and south, rural and urban, city and shire – therefore every council should be able to deliver sensible savings while protecting frontline services for local taxpayers … Those facing the highest demand for services continue to receive substantially more funding. For example, Middlesbrough has a spending power per household of £2,441 which is £871 more than the £1,570 per household in Windsor and Maidenhead.”

As noted in my recent blog assessing that settlement this has been the standard – and increasingly disingenuous – government line for the past five years. That blog, though, was largely about ministers’ ploy – what one might call the ‘spending power sleight of hand’ – to mislead the media and public from the outset about the true severity of their cuts to the funding of the local government sector as a whole.  SIGOMA’s current campaign – Protecting Vital Services – is about the discriminatory distribution of the cuts within the sector, and particularly the impact of the funding changes since 2013-14, which cumulatively have switched the determination of government funding from assessed needs formulae to councils’ tax-raising capacity.

The big change was the introduction of the Business Rates Reduction Scheme (BRRS). It was cautiously welcomed by local government for its devolutionary principle, but SIGOMA-profile authorities were immediately concerned that, as BRRS funding increased and Revenue Support Grant (RSG) correspondingly decreased, the big gainers would inevitably be already prosperous authorities with higher rate-raising capacities, and the gap between them and the less well-off with the highest demand for services would continue to grow.

The New Homes Bonus Scheme (NHB) story was not dissimilar. It was launched in 2011-12 to incentivise local authorities to grant planning permissions for new homes and bring empty properties back into use. For each additional home they would receive for six years an annual bonus payment equal to the council tax generated – from the government’s own funding. Again, it was cautiously welcomed, although it was obvious that authorities with higher banded housing would be the bigger beneficiaries. But no sooner was it established than the government funding bit switched to a top-slicing of RSG, and again poorer authorities have been absolute, rather than just relative, losers.

The Council Tax Freeze Grant was slightly different, in being from the beginning a disadvantageous bribe to councils to cut their spending, but its relevance in this context is that it too is top-sliced from RSG. Put just these three policies together over the three most recent finance settlements, and RSG – the principal source of central government funding of non-schools revenue expenditure and traditionally the mechanism for recognizing councils’ differing resource needs – has shrunk as a proportion of local government funding by over 5% a year.

Chart Game blog

SIGOMA calculates that over just these three years authorities with higher grant dependency and greater formula share in RSG have lost proportionately twice as much (around 20%) as those with more buoyant rates bases and greater protection within RSG (around 10%).

Incidentally, further confirmations of deprived areas suffering most harshly from the government’s cuts have been produced over the past few weeks alone in an Institute for Fiscal Studies Briefing Note, by the Association of North East Councils, and, most tellingly, in evidence from the DCLG itself in the Public Accounts Committee’s report on the Financial Sustainability of Local Authorities (paras 8ff.).

Game of Cuts doesn’t go into the intricacies of RSG that SIGOMA’s Protecting Vital Services study does, confining itself to the billboard-style message that “Since 2010 local government in England has lost more than 40% of its core funding. Urban authorities, largely in the North and the Midlands, have lost the most money as a result of these cuts.” You don’t get SIGOMA’s proposed ‘fair and sustainable’ three-block future funding model either, but both productions, in their very contrasting ways, are worth a look – even if you don’t have a bunch of students to entertain.

Chris Game - pic

Chris Game is a Visiting Lecturer at INLOGOV interested in the politics of local government; local elections, electoral reform and other electoral behaviour; party politics; political leadership and management; member-officer relations; central-local relations; use of consumer and opinion research in local government; the modernisation agenda and the implementation of executive local government.

You couldn’t make it up – except DCLG just did

Chris Game

Did you see manager Arsène Wenger’s explanation of Arsenal’s feeble performance against Manchester City last Sunday?  While most players are galvanised by home supporters and see playing at home as an advantage, Arsenal’s apparently are scared by theirs. “They have a great desire to do well, so maybe they’re a bit too anxious that they don’t respond completely to the expectation level of the crowd.”

A strong bid, certainly, for this week’s You-couldn’t-make-it-up prize, were it not for the Department for Communities and Local Government (DCLG), who, not satisfied with inventing their own measure for disguising the severity of their grant funding cuts to councils, have now disguised it still further by double-counting. If the whole grant-slashing exercise weren’t so serious, the ineptitude really would be laughable. Ridicule aside, it can only serve to validate and reinforce the allegations of unfairness that core city leaders in particular have been making.

Nick Forbes, Newcastle City Council leader, kicked off in November, writing personally to David Cameron to complain about the ‘unfair’ impact of funding cuts on councils like Liverpool with cheap housing and therefore a low council tax base. Then on December 19th, local government finance settlement day, the leaders of all seven English core cities – Birmingham, Bristol, Leeds, Liverpool, Manchester, Newcastle and Sheffield – wrote jointly to Local Government Secretary, Eric Pickles, demanding an urgent meeting to address the “looming financial crisis” their authorities were facing.

The scale of the potential crisis was illustrated by reference to the Jaws of Doom’ graph – Birmingham’s version of Barnet Council’s now famous and similarly apocalyptic ‘Graph of Doom’, produced by the London borough to shock residents, but particularly Ministers, into realising that by 2020 councils would be facing a £16.5 billion shortfall, with no money left for anything apart from children’s services and adult care.

The ‘Jaws of Doom’ graph appears in Birmingham City Council’s budget consultation document (p.8) and does indeed resemble the gaping jaws of a crocodile, attacking from stage left, but unable to swallow the monstrous £600 million budget deficit for which the council estimated, last October, it was heading – and now, following the finance settlement, closer to £625 million.

jaws of doom

This is on top of the £275 million of mainly ‘efficiency and transformational’ savings, including a 25% staffing cut, already made over the past two years, and that have brought the council to the point where the Labour administration, elected last May, claims further efficiency savings are no longer enough. The severity of the reductions in government grant will necessitate significant cuts in front-line services. Hence the budget consultation: outlining the Council’s proposed four-year savings programme, and seeking residents’ views on detailed service cuts for 2013/14, and on alternative council tax scenarios – a further freeze, a limited increase of under 2%, or a larger increase requiring referendum approval.

One question, however, that the consultation document neither asks nor, judiciously, attempts explicitly to answer is: IS IT FAIR?  So I thought I’d have a go.

Are Birmingham and urban councils generally, or Labour councils, or the most deprived areas, being particularly harshly treated by these grant funding cuts? Or was Pickles right, when he insisted in his finance settlement statement that “overall the average spending power reduction for councils in 2013/14 is expected to be limited to just 1.7% per household”, and that “concerns that the poorest councils would suffer disproportionately are well wide of the mark”?

Well, let’s start right there, with that phrase ‘spending power’ (SP) reduction – used by Pickles and his civil servants in preference to the ‘grant reductions’ quoted by council leaders and measured by the ‘Jaws of Doom’. Are they different? You bet. SP was introduced in 2010/11, when the new Government announced its intention to cut central government grant funding of council revenue spending by an unprecedented 28% in cash terms (nearer 40% in real terms, allowing for inflation) over four years, with 21% ‘front-loaded’ in the first two years.

To disguise the savagery of that front-loading, and to make before-after comparisons more difficult, the DCLG first restructured the whole grant allocation system, and then created ‘revenue spending power’ – a measure Ministers claimed that, by including council tax receipts, certain specific grants, and NHS social care funding, gave a fuller picture of a council’s overall financial position. Fuller, yes, but not full. If it really was a full, rather than politically beneficial, picture that Ministers wanted, they could have included income from fees, charges and investments. These, however, are income sources that tend to decline in a recession and whose addition to SP would emphasise, rather than de-emphasise, councils’ grant dependency – so nothing like as helpful as the DCLG’s contrived measure, which could instantly reduce a 28% grant cut to a 14% cut in spending power.

You’d think this was sufficient, but this year, it seems, they’ve really over-egged the pudding by double-counting council tax support in two separate elements of SP. Sadly, at the time of writing, the Department was refusing to help Local Government Chronicle journalists with their enquiries into how the double-counting occurred, and whether it was intentional or accidental. Either way, Pickles’ claim of an average 1.7% spending power cut in 2013/14 was clearly wrong and should have been about a percentage point higher.

Having changed the system and invented new terminology, Ministers’ next rule is always to describe funding reductions in overall percentages, not cash. This fools no one who gives a moment’s thought to how grant funding works, but then there are plenty who don’t.

Formula Grant – the general grant allocated in the annual finance settlement – is calculated in four blocks, the two key ones being Relative Needs, to compensate for areas’ differing service needs, thereby broadly reflecting economic and social deprivation; and Relative Resources, reflecting the strength of an area’s council tax base and ability to raise its own revenue. In combination, these two elements mean some councils are much more reliant on central government grant than others. The more deprived the area, the greater is its need for council services, the lower its council tax base and tax receipts, and therefore the higher the proportion of its revenue spending that needs to be funded by central grant.

Overall in 2012/13, 27% of councils’ revenue spending is funded through council tax. But that proportion ranges from averages of 16% and 22% among Inner London and metropolitan boroughs to over 50% among shire districts. Even neighbouring councils’ grant/tax ratios can differ considerably – like Birmingham’s 84% grant/16% council tax and Solihull’s 67%/33%. What can be presented, therefore, as a uniform 10% grant cut across the country means for Birmingham a budget cut of 8.4%, for Solihull one of 6.7%, but for some shire districts barely 2%. Not so uniform after all.

The reforms to specific or targeted grants have hit councils in deprived areas relatively harder still. Some grants specifically conceived for deprived communities, like the Working Neighbourhoods Fund and area-based grant, have been run down or scrapped altogether. In contrast, the Council Tax Freeze grant to councils agreeing to follow the Government’s tax-freeze policy comprises a 3.5% addition to a council’s existing tax revenues, so benefiting most those with higher tax bases. Likewise, the New Homes Bonus Scheme, funded by top-slicing the central grant to all authorities by equal proportions, benefits disproportionately those in the south, where the bulk of the building is.

Obviously, there have been and will continue to be numerous other technical changes in the grant funding system, with criss-crossing impacts on different kinds of councils. Even a year ago, though, the Audit Commission’s Tough Times report was clear that “there is a strong link between local deprivation and the scale of funding reductions”, with “deprived areas in the north, the midlands, and inner London [experiencing] the greatest cuts”.

There have been several comparisons of the scale of funding cuts across individual local authorities, among the most accessible being the Guardian newspaper’s analysis and interactive map. English local authorities were found to be facing, on average, a cut of £61 a year per person in the total central government funding they would receive between 2011 and 2014, but the range extended from over £250 per person in Hackney, Liverpool and Knowsley to North Dorset’s £2.70.

The severity of cuts correlated closely with the Government’s own Index of Multiple Deprivation (IMD), examples including Liverpool – IMD 2nd, funding cut 2nd (₤252); Manchester – IMD 4th, funding cut 5th (₤210); and Birmingham – IMD 13th, funding cut 16th (₤166). Of the 30 councils facing the severest cuts, 28 are currently Labour controlled. All of which suggests – returning to Pickles’ other bluster from his finance settlement statement – that “concerns that the poorest councils would suffer disproportionately” are not so wide of the mark after all, and certainly not as wide of it as his own 1.7%.

game

Chris is a Visiting Lecturer at INLOGOV interested in the politics of local government; local elections, electoral reform and other electoral behaviour; party politics; political  leadership and management; member-officer relations; central-local relations; use of consumer and opinion research in local government; the modernisation agenda and the implementation of executive local government.

Making Ends Meet: What Aren’t We Talking About?

Catherine Staite

Last month West Somerset District Council sent up a distress flare.  They can’t make ends meet and it is only going to get worse.  At the other end of the scale, the Leader of Birmingham City Council has announced £600m of cuts and declared that the changes which are coming will be ‘the end of local government as we know it’. LB Barnet’s ‘graph of doom’ demonstrates how rising social care costs will eat up their resources until there is no capacity to do anything else but social care and emptying the dustbins.

At INLOGOV we’ve been rather optimistic about the potential for some good to come out of the financial crisis.  We’ve been talking about how we need to build capacity, change relationships and challenge expectations – something we’re calling a ‘new model’ for public services. We are working with some very innovative councils who are embedding radical new thinking in the way that they prioritise resources and commission services. I really believe that it will be possible for them not only to survive but to thrive in this difficult climate.

Others will not be so fortunate. They may ‘salami slice’ and inadvertently lose all their innovative, creative people and therefore their capacity to change.  In some cases political and managerial leadership can’t imagine a different sort of world and so can’t act quickly enough to start building better relationships with communities, managing demand and harnessing capacity to help bridge the gap between what people need and what can be provided.  This requires a new style of local government and  very different, outward facing, political skills.

We are talking about many ways of mitigating the impact of reduced resources on the most vulnerable, but the one thing we don’t seem to talking about is streamlining the machinery of local government. Local government re-organisation – that is, merging smaller councils and moving to a world where shared services are the norm – could help to make the best use of limited capacity and save significant amounts of money but it is rarely discussed.  Many districts and some unitaries have successful shared arrangements, with chief executives and senior management teams managing up to three councils, with evident success.  Why don’t we talk about taking that further? Surely it isn’t because Mr P doesn’t like the idea.  That would recommend it to many. Perhaps it seems too difficult and painful a topic to discuss.  But if we don’t, then opportunities will be lost to make the changes in a positive way and not in a crisis, when distress flares have already gone up.

In Denmark, local government has re-organised itself successfully in recent years. Councils joined together voluntarily with their neighbours until they achieved the best possible combination of size and geography to deliver economies of scale and locally accessible services.  Perhaps we should think about doing the same thing?  If local government doesn’t take the initiative and provide its own leadership on this, no-one else will.  How can we justify the inefficiencies and unnecessary overheads of two tier areas and tiny unitaries in the current financial climate – when cuts are having a real impact on the most vulnerable?

English local government is demonstrably resilient and resourceful.  Can it also be clever, brave and altruistic?

Catherine Staite

Catherine Staite (Director of INLOGOV)
Catherine provides consultancy and facilitation to local authorities and their partners, on a wide range of issues including on improving outcomes, efficiency, partnership working, strategic planning and organisational development, including integration of services and functions.

Council Tax Benefits: A Case of Seriously Muscular Localism

Chris Game

I noticed recently that, among the links on the right-hand side of this page, we still listed the We Love Local Government blog – which, despite its having been wound up, in characteristic style, several months ago, rather pleased me. It deserves to live on, and, should its belatedly unveiled authors, Glen Ocsko and Gareth Young, happen to see this blog, they may take it as a small personal tribute to them and their … I was going to type ‘baby’, but that would make them filicidists … creation.

WLLG was written by local government officers – often critical of aspects of the world in which they worked, but who managed at the same time to love it – or at least sizable chunks of it, for quite a bit of the time. This, of course, is what made it and them different – from so many of their fellow citizens who achieve only the harshly critical bit. This blog is addressed to these gripers, in the hope that, if ever there were a sequence of events that might arouse in them a tad of sympathy for local councils, it could well be the latest episodes of the Government’s council tax benefit changes, summarised below and using as an illustration Birmingham City Council.

These benefit changes are a pivotal and controversial Coalition policy, revealing what critics claim is the true nature of its welfare philosophy, its commitment to genuine localisation, and its sheer managerial ineptitude. Details are on Birmingham City Council’s website under ‘Council Tax Support’ – so what follows is a brief summary for the late arrivals at the Taxpayers’ Ball.

From next April, the Government is abolishing Council Tax Benefit (CTB), a means-tested benefit currently paid by the Department for Work and Pensions (DWP), but administered by local government – in Birmingham’s case, £100 million to approximately 137,000 council tax payers. Replacing it will be Council Tax Support – financial support schemes determined and operated by local authorities themselves.

This ‘localisation’ of welfare sounds a commendable transfer of responsibilities from Whitehall to town hall – until you examine the attached strings. First, the policy forms a key part of the Coalition’s deficit reduction programme, aimed at reducing the current CTB bill by 10% by strengthening councils’ incentives to get people into work, and cutting the fraud and error that the DWP was unable to control. And councils will need to achieve all this immediately, apparently, as the Government would pay them 10% less for their new schemes than for CTB, creating for Birmingham a funding gap of £10.9 million.

Second, the Government decreed that pensioners receiving CTB must be protected against any reduction in support. In Birmingham this means 54,000 pensioners are protected, while 83,000 working-age recipients (those born after October 1951) shoulder potentially the whole savings burden.

So far, so centralist, for it is only here that the localist part begins, with councils able to devise their own schemes to achieve these savings, provided they do so by January 2013.

In practice, this discretion amounts to three unenviable choices: spreading the funding cut equally across virtually all CTB recipients apart from pensioners; giving the rebate to certain groups only; or continuing with the full rebate, and filling the gap either through raising council tax or finding savings elsewhere, on top of those already being demanded by the Government – for Birmingham, a possible £600 million over the next five years.

The Council’s selected option – essentially a version of the spread-the-pain-equally model – was revealed in early September in two documents: one setting out the proposed tax support scheme, the other asking for residents’ views by 2 December. Almost all working-age people could expect to pay at least 24% of their council tax – which this year would be £178 or £3.43 a week on a Band A property. Main exceptions would be those with a dependent child under six, and those receiving a disability or disabled child premium or war-related pension. A modest contribution to the scheme’s cost should come through removing council tax discounts on second homes, as permitted when the Local Government Finance Bill eventually completes its unhurried progress through Parliament.

Now here, I thought, is where the sympathy might come in – for the contemptuous treatment councils regularly receive, even from Community and Local Government ministers who are supposed to be vaguely on their side.

First, there’s the constitutional arrogance of requiring councils to prepare and consult on detailed schemes before the authorising legislation is even passed. Yes, it’s equally contemptuous of the Queen’s Royal Assent, but it seems almost standard procedure nowadays.

Then there’s the Government’s brand of centralist localism – ‘muscular localism’, as Secretary of State Eric Pickles calls it – which involves both setting all the main rules, then changing them in what ministers must know is the middle of councils’ consultations, but that to them presumably is merely a game.

In late October, weeks after most councils had formulated their support schemes and gone out to consultation, DCLG ministers announced that they’d had a quick whip-round and found an extra £100 million ‘transition grant’ for councils whose schemes were ‘well-designed’ and maintained positive incentives to work.

As they say in professional cycling, if it sounds too good to be true, then it probably is. Ministers’ idea of ‘well-designed’ turns out mainly to mean that those currently receiving full council tax support should pay no more than 8.5% of their council tax liability, or barely a third of Birmingham’s proposed 24%.

So, back to the drawing board – or perhaps not, who knows.  An unpredictable share of the £100 million would represent a fraction of councils’ 10% funding cut and complicate budget-making. Besides which, collecting costs will cancel out much of the arbitrary 8.5% tax payments: £1.21 per week on a Birmingham Band A property. The smart money is on most councils sticking with their intended schemes.

Clearly, though, ministers have been spooked by the savage impact on the poorest households of their own inflexible funding restrictions – of which they were repeatedly warned, and which might have been largely avoided, had they allowed councils not just to remove tax discounts from empty properties, but, as proposed by the LGA, to reduce even slightly the 25% single person’s discount.

But no, that was another ministerial rule: “the Government has no intention of introducing a ‘stealth tax’ on eight million people” – a benefit cut on even more, even poorer people being apparently something other than a stealth tax, or anyway one for which councils would take the blame. Now, no doubt, they’ll get additionally blamed, whether they change their proposed schemes or not – and if that lot doesn’t earn them a scintilla of sympathy, I’m at a loss to think what might.

Chris is a Visiting Lecturer at INLOGOV interested in the politics of local government; local elections, electoral reform and other electoral behaviour; party politics; political  leadership and management; member-officer relations; central-local relations; use of consumer and opinion research in local government; the modernisation agenda and the implementation of executive local government.

Tax Collection Rates: Central and Local

Chris Game

Council tax collection rates have become an annual Commons ritual, pleasingly coinciding with the first week of Wimbledon.  Party whips select a tame Government backbencher – the parliamentary equivalent of a first-round loser – to lob up a couple of juicy written questions for the high-seeded Communities and Local Government Minister to smash away, adding for good measure some unsubtle party spin. This year, though, there were a couple of interesting variations.

First, the questions were tabled not by a neophyte Tory backbencher, but by Helen Jones, four-term Labour MP for Warrington North and Shadow Local Government Minister. Second, she wanted to know about council tax arrears as well as collection rates, for each billing authority, in cash and percentage terms.

To most people, the two things are clearly distinguishable. Uncollected taxes relate to the most recent financial year and, fairly or not, can be seen as an indicator of administrative inefficiency.  Arrears are uncollected taxes over several years that are still being chased as, in principle, collectable. Presentationally, they should be more problematical, for even fruitless chasing sounds more diligent than just giving up and writing them off.

But to ministers this is a distinction without a difference: they can attach their political message equally easily to either set of statistics. Combining Jones’ two questions, Local Government Minister, Bob Neill, placed in the Commons Library a two-column table (Figure A), showing for each alphabetically listed billing authority their accumulated council tax arrears at 31 March 2011, and the total tax they were attempting to collect in 2010-11.


More helpful would have been the 2011-12 figures, which were in fact available to us all a couple of days later. Still, not to worry; other assistance was on the way. Ministers were naturally concerned that the full partisan significance of these figures might be lost, if MPs, let alone journalists, were forced to sift through all 326 of these authorities. So a Spad (ministerial special adviser) circulated the media with a list re-ranking them in order of their total tax arrears at the end of 2010-11 (Figure B).

Guessing the sections of the media likely to run their story, the Spad also added some useful quotes. The revised list was “a league table of the worst offenders”, in which “9 out of 10 of the worst authorities are Labour run”. There were some interpretative comments too from his ministerial master, Eric Pickles:

“This roll call of shame is familiar reading, with Labour councils year in, year out, topping the table of local authorities who squander millions by failing to collect our council tax. If these Labour authorities stopped complaining about the legacy of cuts left by their own party and actually chased up these tax dodgers, they could use the money to protect hundreds of frontline jobs.”

Yes, the DCLG ministerial world is apparently that simple.  All uncollected council tax is attributable to tax dodging and the compliance of lazy, inefficient and moaning Labour councils.  Oh dear – just where do you start?

First, perhaps, with the most obvious.  Yes, Labour Liverpool did top the 2010-11 arrears table, but two of the top five places were occupied by Birmingham, run until May by a Conservative-Lib Dem coalition, and Conservative Croydon. Even the Daily Mail worked out that 9 of the top 10 couldn’t therefore be Labour – albeit in a story whose snappy title left little doubt as to its content: “£2 billion of council tax left uncollected by town halls who then moan about cuts by Whitehall”.

If this arrears listing were indeed a ‘roll call of shame’, Croydon’s prominence would be embarrassing over and above its political control.  As would be expected – by anyone sensing that uncollected tax may not be entirely due to ‘Won’t Pay’, rather than ‘Can’t Pay’ – there is a consistent overall correlation between councils’ annual tax collection rates and their position on the DCLG’s own Indices of Deprivation.

Manchester and Liverpool, for example, are ranked 3rd and 4th on the national Index of Multiple Deprivation, behind Hackney and Tower Hamlets. Birmingham and Lambeth are 13th and 14th. Croydon, by contrast, is no higher than the 20th most deprived borough in London.

As we’ve seen, though, the listing provided to Helen Jones and the Commons Library ranks councils by their accumulated council tax arrears – and in cash terms, moreover, not as a percentage or efficiency measure of anything at all. Big cities, London and metropolitan boroughs are almost bound to head such rankings. If any of the “worst offenders”, Croydon included, wanted to drop down the list and, presumably, earn ministerial brownie points, they could simply change their corporate write-off policy, stop chasing these really hard-to-recover debts, and write them off. Would that genuine efficiency gains were that easy!

To make their party propaganda properly, ministers should have had their Spads rank order not councils’ arrears, but their tax collection rates – their actual tax receipts for the financial year as a proportion of the total due. We now have these figures for 2011-12, and they make interesting reading (Table 7 of hyperlink).

English local authorities collected £22.1 billion in council tax and £20.8 billion in non-domestic rates (NDR), or 97.3% and 97.8% respectively of the totals due to them. Shire districts’ council tax percentages were slightly above the overall average (98.2%) and those of London and metropolitan boroughs (96.3 and 96.1%) and unitaries (97.2%) slightly under.

Highest collection rates in Inner London were in Conservative Wandsworth (98%) and Labour Camden (96.7%), the lowest in Labour Hackney (93.7%) and Lewisham (93.9%). In Outer London, the spread was rather greater, largely due to Newham’s 89.6% – which was 4.5% lower than any other OL borough and, most oddly, 10% lower than its 99.6% NDR collection rate, the highest in London. Supposedly inefficient Croydon was precisely on the Outer London average (96.6%).

Among metropolitan districts, the only three to top a 98% collection rate were an assorted West Midlands trio – Conservative Solihull and Dudley, and Labour Sandwell – followed by Conservative Trafford and Labour Rotherham.  Lowest were Salford (91.3%) and Manchester (92.3%).

Even from this small selection of extremes, it is clear that politically the picture is more complicated than Eric Pickles would have us believe. It is also clear – and, surely, hardly surprising – that Conservative councils overall do have at least slightly higher collection rates than Labour. There may be good explanations for the variations, from year to year and across apparently similar types of authority, but the questions do need asking, which is why these statistics, properly understood and deployed, are so important. After all, if Newham raised its collection rate to that of the hardly more affluent Tower Hamlets, it would bring in an additional £4 million; if Birmingham matched Sandwell, it would collect an extra £10 million.

Of course, other questions too suggest themselves: how, for example, does local government’s £600 million council tax collection gap look when compared with those for HMRC-administered taxes? To which the answer is: not too shabby.

HMRC helpfully produces an annual report on this very subject – Measuring Tax Gaps – and the latest estimates, for 2009-10, include: direct taxes (income tax, NI contributions, capital gains tax) – £14.5 billion or 5.8%; VAT – £11.4 billion or 13.8%; corporation tax – £4.8 billion or 11.7%; beer, spirits, cigarette, tobacco duty – £2.4 billion or roughly 10%. And the total gap: just the cool £35 billion or 7.9% (Table 1.1 of hyperlink). It kind of puts local government’s 2.7% into a slightly different perspective, doesn’t it, Minister?

Chris is a Visiting Lecturer at INLOGOV interested in the politics of local government; local elections, electoral reform and other electoral behaviour; party politics; political  leadership and management; member-officer relations; central-local relations; use of consumer and opinion research in local government; the modernisation agenda and the implementation of executive local government.