Lessons from former ministers could help a new government prepare properly

Leighton Andrews

Keir Starmer’s shadow ministerial team has now started the access talks with the civil service which Prime Ministers traditionally permit in the run-up to a general election. These talks are designed to help the civil service familiarise itself with both shadow ministers and the potential policies of a new government, and to help shadow ministers understand the mindset of senior civil servants.

Not all shadow ministers transition to the same policy role in government, of course. Tony Blair’s former chief of staff, Jonathan Powell, revealed in his 2010 book The New Machiavelli how in their access talks, they had to arrange for one Permanent Secretary to meet two different shadow ministers – the one who currently had the portfolio, and the one they intended to do the job if New Labour won the election.

There is no manual on how to be a minister, and new ministers have often found themselves taking time to adapt to their new roles, aided by their private offices whom they meet on their first day after their appointment. Interviews contained in the Ministers Reflect archive of the Institute for Government, now almost 150-strong, confirm the centrality of the private office to a new minister’s life. They help them settle in, introduce them to the routines and artefacts of ministerial life, and prepare them for their first performances in the role. But private offices are double agents, warns former Conservative Cabinet Minister Ken Clarke, feeding information to ministers on the running of the department and feeding information back to the Permanent Secretary on the new minister.

The civil service is not, most former ministers believe, a conspiracy designed to stop ministers carrying out their objectives. Most praise the support they had from civil servants. But there is a genuine tension between the activist desire of ministers to ‘make a difference’ and the long-established processes of the civil service machine. My research in the Ministers Reflect archive suggests that over the last quarter-century, ministers have taken a stronger interest in issues of delivery and implementation, and ministers from all parties have come to express frustration with the delivery capacity of the civil service.

The interest in delivery and implementation has been driven from the centre of government: the Prime Minister’s Office, the Cabinet Office and also the Treasury. New Labour established a Prime Minister’s Delivery Unit. The Coalition abolished it – a mistake, admitted David Cameron and his fixer Oliver Letwin later – and then created an Implementation Unit to take things forward. Ministers developed their own techniques for checking their department’s delivery performance. Of course, an interest in delivery does not itself mean delivery has got better!

Traditionally ministers were appointed to leadership roles without any formal training. Learning was something you did on the job., Ministerial training is now on the agenda, and there have been training sessions organised both informally outside the government machine and more recently within it. But former ministers tend to believe it is their prior political activity which gets them appointed as ministers, while it is their prior work experience which helps them navigate their roles.

Ministers are appointed to positions of leadership by prime ministers and first ministers. Of course, it is what they do with that position that matters, and not simply their possession of authority deriving from appointment. Former Conservative Cabinet Minister Eric Pickles tells new ministers ‘don’t occupy the post, do something with it’. Former Labour Home and Foreign Secretary Jack Straw reminds them ‘you’re not just a place-holder’ .

Ministers perform a range of forms of leadership work. Their leadership identity – their ministerial mindset – necessarily develops over time as they work to understand their role. Their leadership takes a number of forms – collective, as members of a ministerial or Cabinet team; departmental, in a dual leadership role with their Permanent Secretary, Director General of divisional director; or as system leaders (for example in Education or Health). They perform as leaders publicly and privately; they take leadership decisions; they carefully manage their time as leaders. At some point, for whatever reason, they exit the leadership stage.

Will we see a new set of UK ministers soon? Are some now set for the exit? Time will tell. But time spent learning from the experience of former ministers is never wasted. After the minister is appointed, there’s little time left for learning….or life outside the job, come to that.

Leighton Andrews’ book Ministerial Leadership is published by Palgrave Macmillan on 17 February. More information here: https://link.springer.com/book/10.1007/978-3-031-50008-4

Leighton Andrews is Professor of Practice in Public Service Leadership at Cardiff Business School and teaches and researches government and leadership. Formerly Minister for Education and Skills and Minister for Public Services in the Welsh Government from 2009-16, he was Assembly Member for the Rhondda from 2003-16. www.leightonandrews.live

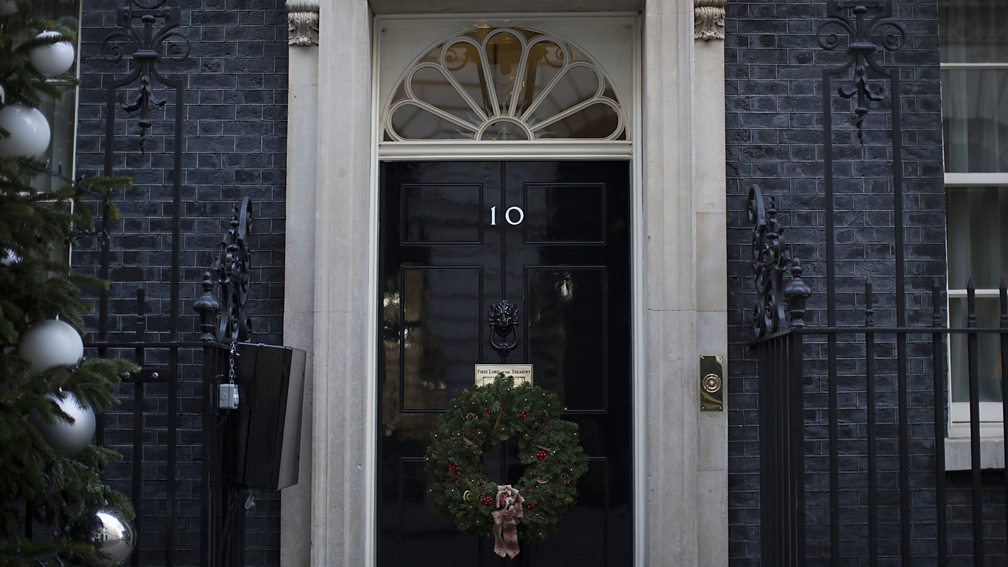
Picture credit: https://www.bbc.co.uk/programmes/articles/1tvcrzdvsbtj4pQQ1g7N2Tn/rare-photos-from-inside-number-10-downing-street

Voter ID – Part 2: How poisoned, how curative?

Chris Game

In the Electoral Reform Society’s recent review of the King’s Speech the first “conspicuous omission” identified, ahead of democratically reconstituting the Lords and electoral reform, was the repeal of Voter ID – “an unnecessary step backwards for our democracy and should be scrapped before it causes any more damage”.  Though I’m an ERS member, that’s not my personal view – as I’ve previously indicated, here and elsewhere – which is partly why I embarked on what has become a two-part blog, of which this is the second and – I promise! – final instalment.

Rationalising post hoc, the first part summarised the key data – published mainly by the Electoral Commission in its June Interim Analysis of the Voter Identification returns from Returning Officers, its September Demographic Analysis Research, plus its specifically Voter ID-related policy-and-practice recommendations. This second instalment covers, or at least references, some of the varying and more eye-catching reactions to all these data.

The first of which – partly for its comprehensiveness, but also because it provided the blog’s chosen title – is the early September review published on behalf of the All-Party Parliamentary Group (APPG) of senior MPs and Peers on Democracy and the Constitution and funded by the Joseph Rowntree Reform Trust. Undertaken by a cross-party panel chaired by Jon Nicolson (SNP), its four main conclusions were that:

  1. The voter-ID system, as it stands, is a “poisoned cure”, disenfranchising more electors than it protects. It quotes the well publicised statistic of there having been just eight convictions/cautions for personation in person since 2013, plus that detailed in the earlier blog of more than 14,000 possibly entitled voters having been turned away by ‘greeters’ in May before even entering the polling station – sufficient, arguably, to have swung the result of up to 16 constituencies in the 2019 General Election.
  2. The regime’s inherent ambiguity creates a real risk of injustice and potential discrimination.  Most obvious – “shamelessly obvious” to quote the Guardian’s Polly Toynbee in her coverage of the topic – was the selection of documents acceptable as ID, discriminating particularly, but not only, against young persons: Oyster 60+ passes [requiring proof of name and address] acceptable, but not student IDs, library cards, bank statements, etc.  The panel also noted that “independent observers” had recorded evidence of racial and disability discrimination at polling stations, with “non-white people being turned away even when they had qualifying ID, while some white people were permitted to vote without showing ID at all.”
  3. The regime lacks the flexibility necessary to avoid injustices – being over-reliant on decisions made by polling clerks and presiding officers, against which there is no formal right of appeal.
  4. The problems identified are systemic, but not fundamental – meaning that, with targeted reforms, the voter-ID regime can, as in many other states, be an asset to UK democracy. That was my emphasis, and, for what it’s worth, with all Europe and almost all developed countries requiring in-person voters to use photo ID, the panel give less emphasis to this point than I would have. A corollary of that point, however, is that these countries have polling station staff familiar with the demands of voter ID, and there is growing evidence of the need to address with some urgency the recruitment, training and retention of electoral staff.   

Overall, the panel’s conclusion is that the regime should remain in place, subject to three main structural reforms:

  1. Permit electors to ‘cure’ a failed ID check by utilising an existing mechanism in UK law and signing a declaration attesting to their identity and right to vote (as in Canada).
  2. Broaden the range of accepted identification documents and in doing so set clear criteria for deciding which forms of ID are accepted.
  3. Provide better training for polling station officers.

It’s a lengthy production (well over 100 pages, incl. research appendices) and a recommendable one for anyone new to the topic, not least in reminding us how the VID debate was actually kicked off – by a 2010 BBC Panorama investigation, leading eventually to a 2015 High Court case in which Tower Hamlets’ then Labour (and today Aspire Party) Mayor, Lutfur Rahman, was found guilty of involvement in a string of “corrupt and illegal electoral practices”, one of which was ‘personation’.  

Whereupon the Cameron Government instructed its ‘Anti-Corruption Champion’, Sir Eric Pickles, to prepare a report examining electoral fraud – one of whose 50 recommendations was that it should consider options for electors having to produce personal ID before voting at polling stations. Which led in turn to the 2018/9 trials, which reported a degree of increased public confidence in elections where VID was required – but not, as the All-Party review notes (p.9), that “electoral fraud ranked consistently last in public perception of problems around elections” [and administrators’ perception – see table below], or that they are “far more concerned about political funding and the redrawing of constituency boundaries than about personation”.

If the legislation did eliminate personation, the APPG’s view was that this came at the cost of “disenfranchising” electors: preventing or discouraging certain electors from voting – considerably more than the recorded 14,000 or so without ID who failed to return after being turned away by polling station staff. Excluding those turned away by party political ‘meeters and greeters’, this number was considered for several reasons to be “a significant underestimate”.

The democratic cost, in the name of preventing in person personation – occurring, on average 0.88 times p.a. – was to deny at least 14,000 people the opportunity to cast their ballot, which is “unacceptable and unjustifiable”.

Politically, however, the Panel reckoned that even these probably undercounted numbers of non-returnees could potentially impact on a General Election result – two West Midlands examples being Sandwell and Walsall, where 1,135 and 797 electors (respectively) were turned away.

There is, obviously, a great deal more, but almost simultaneously other contributions were appearing on the scene, perhaps most noteworthy being the Local Government Information Unit’s The Impact of Voter ID: The Views of Administrators. Based mainly on a survey of 171 electoral administrators who helped deliver the May 2023 elections, some of these ‘behind the scenes’ views are almost inevitably predictable: that VID is just the latest of the pressures added to the burden of electoral administrators already contending with resource constraints, complex legislation, tight timetables, temporary staff recruitment, etc.; and that a General Election offers an “opportunity for serious disruptions” (p.5).  

Perhaps most striking, though, appearing on the Introduction page (6), but without a word of direct reference, is the following bar chart. The words follow in the remainder of the report: yes, administratively elections in England have serious weaknesses: staffing pressures caused by “short timetables, convoluted legislation, inefficient processes and inadequate resourcing.” (p.11).  Administrators’ question for this research is how voter ID has impacted on these issues, as well as, of course, on “personation in the polling station”.

And my carefully considered conclusion, following this attempted overview of the welter of reports and evaluations that appeared several weeks ago now?  I should have done what I’ve habitually done for years in comparable situations: relied on the House of Commons Library, whose estimable staff – here Neil Johnston and Elise Uberoi – produced a characteristically thorough (and, unlike mine, unopinionated) 59-page Research Briefing covering pretty well everything I’ve attempted to. And, to quote Forrest Gump, that’s all I have to say about that!

Chris Game is an INLOGOV Associate, and Visiting Professor at Kwansei Gakuin University, Osaka, Japan.  He is joint-author (with Professor David Wilson) of the successive editions of Local Government in the United Kingdom, and a regular columnist for The Birmingham Post.

Voter ID – A “Poisoned Cure” and Other Verdicts

Chris Game

It’s easy to claim, but there are times when I miss not having classes of students to endeavour to entertain – partly because, at least from a distance, it can seem rather easier now than back when I had that responsibility.

One gift I’d certainly have used during this year’s exam revision period was the YouTube rap video made by T-Dawg – aka Broadland and South Norfolk Councils’ Managing Director, Trevor Holden – ‘reminding’ intending voters in the May local elections to take photo ID with them to the polling station. Like the whole topic, the video received a mixed reception, but it certainly got my vote (sorry about that!) as an introduction to this split-blog’s attempted overview of the profusion of recently released Voter ID material. I’ve at least flick-read most of it, so you won’t have to worry about not doing so.

First, though, an additional declaration of personal interest, referring back to that  opening paragraph. My students weren’t, of course, learning directly about ‘political literacy’, but high on my short list of ‘research stats I’ve managed to remember for more than a few weeks’ was the depressing finding in the All-Party Parliamentary Group (APPG) on Political Literacy’s 2021 report that, of a 3,300 sample of secondary school teachers in England, only 1% [felt] “fully prepared” to teach courses aimed at developing young people’s political literacy.

The ”fully”, omitted in some reports, was in the question and doubtless partly explains the dispiriting response. But anyway the finding was highlighted by the APPG, led directly to the creation of the social enterprise Shout Out UK (SOUK), and these two bodies’ influence is clearly evident in some of the Electoral Commission’s recommendations for more focused information and awareness raising.

There had, of course, been earlier assessments of May’s elections – principally the Electoral Commission’s Interim Analysis in mid-June, reporting the anonymised returns from the Voter Identification Evaluation Forms (VIDEF) that Returning Officers were required to complete (see table below), plus results of three YouGov pre- and post-election public awareness surveys of between 1,700 and 3,700 adults each.

This first, stat-heavy part of the blog will present, in highly summarised form, some of the key data, with the second covering some of the more recent interpretative contributions – including that of the All-Party Parliamentary Group, from which I’ve appropriated the blog’s slightly giveaway title.

First, some scene-setting stats, taken from the final report. The total electorate was 27.3 million, ballot box turnout 32%. For the record, Labour took 33% of the vote and control of 70 councils; Conservatives 28.6% and 33; Lib Dems 37% and 20.  5.2 million postal ballots were initially issued to 19% of the electorate, 3.5 million (67%) of which were returned, of which 89,000 were rejected, mainly for missing or mismatched signatures or dates of birth. OK, it’s only 2.6%, but, after making the effort, it was higher than I might have guessed.

 Key findings from the analysis included that:

  • Immediately post-election, in areas with elections, 92% of people in England were aware they now needed to show photo ID to vote at a polling station. They weren’t asked, however, if that awareness extended to knowing that they couldn’t obtain ID – e.g. the Voter Authority Certificate (VAC) – on polling day itself.
  • Awareness was significantly lower (74%) among those who didn’t already have an accepted form of ID – and, unsurprisingly, among youngest age groups (82% for 18-24 year olds), Black and minority communities (82%), etc.   
  • Approximately 89,500 people applied for a VAC before the 25 April deadline, some 28,000 certificates being subsequently used – i.e. under one-third of the 250,000 to 350,000 estimated likely not to have any other acceptable ID.
  • At least 0.25% of people (c.14,000) who had tried to vote at a polling station were not issued with a ballot paper because of the ID requirement, but this excludes those who reacted to the ID reminder before they could be recorded in the data – thereby inevitably underestimating, as do the post-election analyses generally, the actual impact of the voter ID requirement.

This was essentially the ‘headline’ picture we had to content ourselves with over the summer, until quite suddenly, come September, there was a whole lot more – and it seems logical, if not strictly chronological, to start with the Electoral Commission’s full-scale Voter ID Demographic Analysis Research. The analysis aimed to identify patterns in areas where relatively higher or lower proportions of intending voters were turned away from polling stations due to the new ID requirement.

18 authorities with apparently relatively socioeconomically diverse wards were selected, including the West Midlands’ Coventry and Sandwell – the latter being the sampled borough with the nationally highest “initially turned away” percentage of 3%.  The Census-based ‘proxy’ variables measured were unemployment, ethnicity, household deprivation, and social renters.

Hyper-summarising, the analysis suggested there was “a potential linear relationship” between each selected socio-economic variable and the proportion of voters initially turned away and those who didn’t return to vote. These results are obviously tabulated, but also graphed, as illustrated in what is described as the “moderate relationship” between ethnicity and the proportions initially turned away.

Overall, 13 of the 18 authorities showed at least a moderate relationship between the independent variables and the proportion of voters initially turned away, and 6 exhibited “strong relationships between one or more independent variables”. Strongest correlations were with areas having a high proportion of non-white British individuals, higher deprivation, and higher unemployment.   

Following this specifically Voter ID-focussed report, the Electoral Commission had published in June its overall Report on the May 2023 Local Elections in England, which it updated in early September. It made nine main recommendations, including increasing awareness of the support available for disabled voters, and improving data collection at polling stations.  

Four, however, related specifically to voter ID: review the list of accepted ID; improve access to the Voter Authority Certificate (see above); improve options for voters who don’t have or can’t access any accepted form of accepted ID – e.g. allowing ‘attestation’ by a named and verified elector; and polling station staff to continue to collect voter ID impact data at future elections.

Which brings us to about mid-September, already some way over this blog’s preferred length, and quite the wrong time, therefore, to address the “poisoned cure” and other reactions to these primarily statistical analyses – which will follow, with luck, fairly shortly.

Chris Game is an INLOGOV Associate, and Visiting Professor at Kwansei Gakuin University, Osaka, Japan.  He is joint-author (with Professor David Wilson) of the successive editions of Local Government in the United Kingdom, and a regular columnist for The Birmingham Post.

Voter ID – the warning lights are flashing

Picture credit: https://www.electoral-reform.org.uk/why-the-governments-mandatory-voter-id-plans-are-a-terrible-idea/

Jason Lowther

Previous columns have urged a cautious approach to the introduction of photographic voter ID in England.  The May 2023 elections provided the first nationwide test of the system, and early analyses are highlighting some significant issues. 

Elections took place in 230 areas in England and around 27 million people were eligible to vote.  This week, the Association of Electoral Administrators (the people in councils who actually deliver elections) issued their post-match analysis, highlighting ‘the fragility of the system’ and recommending a fundamental review of the country’s electoral arrangements.   

With less than four months between the enactment of the new legislation and polling day, which included new statutory duties on accessibility as well as voter ID, councils faced a huge and risky task to administer the new system effectively.  They also faced significantly more paperwork, with new forms to track electors unable to vote and new data capture requirements.  The AEA report significant impact on polling officials: ‘many of our members reported POs feeling overwhelmed by paperwork and the time it takes to complete throughout polling day and at the close of poll’.

The AEA report reveals that the government’s website to provide free photo ID to those needing Voter Authority Certificates (VACs) failed to work properly from its launch in January and many functions were still not available by the deadline to apply for a VAC for 4 May poll.  Updates were still being issued two weeks before polling day.  Almost 90,000 people applied for VACs by the deadline, well short of the Electoral Commission’s earlier estimate of 250,000 – 350,000 applications based on the proportion of local election voters who did not have suitable ID.  Many didn’t know they would need one – just over half (57%) of the overall population and those who said they did not already have photo ID were aware of VACs in May, according to the Electoral Commission.

The types of photo ID acceptable under the legislation proved rather esoteric.  Passports are accepted, but what about a passport from Zimbabwe or a British format immigration document?  London Oyster 60+ cards are accepted, but not the Merseytravel Over 60s pass which has similar application checks.  Photo IDs issued by councils themselves, such as taxi licences and gun licences, were presented but could not be accepted. Similarly police warrant cards, NHS and other emergency services photo ID were presented but unable to be accepted.

The Electoral Commission’s interim report on the election was issued on 23rd June.  They found that immediately before polling day, 87% of people in England (excluding London, where there were no elections) were aware that they needed to show photo ID to vote at a polling station – implying that around 3.5 m potential voters were not aware as the poll approached.  Awareness was lowest amongst young people, BME communities, those who haven’t previously voted in local elections, and people who didn’t have the necessary forms of photo ID.

To avoid voters queuing for a ballot paper and being turned away, in some areas ‘greeters’ were appointed to meet electors as they arrived and check whether they had an accepted form of photo ID with them.  Others provided posters and banners to explain the requirements outside polling stations.  Polling stations with greeters recorded a smaller proportion of people ‘turned away’ inside the polling station compared to those without greeters.  As a result of voters receiving advice outside the polling stations, and because of some other data issues, we should treat statistics on numbers of electors unable to vote with caution. Data collected inside polling stations shows that at least at least 0.7% of people (39,000 voters) who tried to vote at a polling station were initially turned away but around two-thirds of those people (63%) returned later in the day and were able to vote.  In some councils more than 1 in 100 electors were turned away.

More worryingly, the Electoral Commission found that 4% of people who said they did not vote in these elections gave an unprompted reason related to the ID rules, and the proportion of non-voters giving an ID-related reason rose from 4% to 7% when survey respondents were selecting from a list of reasons.

It was not possible to capture reliable demographic data on people who were not able to vote because of the ID requirement because electoral law did not allow polling station staff to collect demographic information about individuals who were turned away.  In the EC survey, disabled people and those who are unemployed were more likely than other groups to give a reason related to ID for not voting.

Voter confidence doesn’t seem to have been massively improved.  In fact, the EC found 68% of people were confident that the May elections were well run, compared to 73% in 2022.  For those who said they were not confident, the most common reason selected (by 46%) was that “some people were unable to vote due to the ID requirement”.

We await the Electoral Commission’s full report in the autumn.

Meanwhile, I close with an interesting comment made at the National Conservatism conference on the 15th May 2023 by former Secretary of State for Business, Energy and Industrial Strategy, Sir Jacob William Rees-Mogg:

Parties that try and gerrymander end up finding their clever scheme comes back to bite them – as dare I say we found by insisting on voter ID for elections.  We found the people who didn’t have ID were elderly and they by and large voted Conservative, so we made it hard for our own voters and we upset a system that worked perfectly well.

Jason Lowther is the Director of INLOGOV. His research focuses on public service reform and the use of “evidence” by public agencies.  Previously he worked with West Midlands Combined Authority, led Birmingham City Council’s corporate strategy function, worked for the Audit Commission as national value for money lead, for HSBC in credit and risk management, and for the Metropolitan Police as an internal management consultant. He tweets as @jasonlowther

Oops!  We lost two Mayors – let’s overthrow a sensible system

Chris Game

I assume it was the 2021 mayoral election results that finally clinched it. With the Conservatives winning just two of that year’s 13 mayoralties to Labour’s 11, it was time to enact the party’s 2019 manifesto pledge – “to continue to support the First-Past-The-Post (FPTP) system of voting, as it allows voters to kick out politicians who don’t deliver, both locally and nationally”.  Specifically, the Supplementary Vote (SV) system – despite also, like electoral systems generally, featuring the kicking-out of politicians – had to be replaced for mayoral and Police and Crime Commissioner (PCC) elections asap.

True, the counting of electors’ supplementary – second preference – votes had just enabled West Midlands Conservative Mayor, Andy Street, to be re-elected with the useful perk of a narrow overall majority of votes cast, along with the party’s rising star, Tees Valley’s Ben Houchen, who’d swept in with nearly 73% of first preference votes.

No supplementary second round necessary there, but nor should there have been, reformers reckoned, in Cambridgeshire & Peterborough, where the established Conservative Mayor, James Palmer, had been a victim of the dastardly SV ‘system’. He’d comfortably led Labour’s Nik Johnson after the count of first preference votes – by nearly 18,000 votes or 8%. Yet, by some foul trickery, or possibly because he simply wasn’t as broadly appealing his opponent, after the counting of relevant second preference votes, he’d fallen behind: 48.7% to new Mayor Johnson’s 51.3%.  Despite Government Ministers repeatedly claiming that “the candidate with the most votes” lost, he hadn’t. He’d won – he just wasn’t Conservative.

Anyway, Palmer threw what looked like a wobbly, promptly retired from politics, and SV elections for Mayors and PCCs would be retired with him, though not in time for last May’s Mayorals, which very nearly produced a Croydon re-run of that Cambs & Peterborough result. First count: Jason Perry (Con) 34.8%, Val Shawcross (Lab) 32.7%. Second count: Perry 50.4%, Shawcross 49.6% – the candidate with the leadership-resonant first name just edged it.

By then, though, the FPTP legislation was well under way. The next Mayoral elections – this May – would use FPTP, as will next May’s PCC elections. It seemed a good time for a review of the whole SV lifespan, facilitated by the invaluable statistical records of my polling specialist friend, David Cowling.

Quickish review: the Supplementary Vote is obviously not a proportional system, which would be tricky when electing single Mayors, Police & Crime Commissioners, etc.  Rather, it’s a simplified majoritarian system, enabling voters to rank their two most favoured candidates on the ballot paper in order of preference.

If no candidate gets over 50% of first preference votes on the first count, just the top two candidates continue to a run-off, thereby encouraging candidates from the outset to seek support beyond their core supporter base. The winner may still get less than half the total vote, but will need significantly wider support than under FPTP, and especially under FPTP with a lowish turnout.

Both, however – ultra-topical insert – are more democratic than this past weekend’s Spanish ‘mayoral’ elections, in which Barcelona Mayor Ada Colau, almost certainly the nation’s best-known mayor both at home and abroad, is seeking a third term of office … but as Leader of a two-party socialist coalition – for Spanish mayors aren’t even elected by ‘the people’, but indirectly by fellow councillors.

The name – Supplementary Vote – may have been new when it was ‘invented’ by an early 1990s Labour Working Party, but essentially similar ‘preferential’ systems had been quite widely used internationally for ages. France’s Presidential ‘double-ballot run-off’ was one example, but most obviously there was the Alternative Vote – the actual subject of Winston Churchill’s senseless but oft-recycled quote, about it rewarding “the most worthless votes given for the most worthless candidates” – although today’s Conservative critics have no difficulty unearthing and redirecting it to SV.

I’m old enough to recall lecturing about the SV’s UK ‘invention’ by a Labour Party working party in the early 1990s and the even then revered ‘psephologist’, the late Sir David Butler, getting uncharacteristically incensed about it – calling it “silly”!  But his sphere of matchless expertise was parliamentary elections, with turnouts at the time of consistently over 70%. Even they, though, have slipped a bit since, and well over a third of today’s MPs won less than 50% of their constituency vote, and that’s an awful lot of voters left feeling unrepresented.

Local (including mayoral) election turnouts, however, are proverbially in another ballpark – and this is probably the blog’s key point. Except when they coincide with parliamentary elections, they average around 40%, and that’s on good days. PCC turnouts, unsurprisingly, are significantly lower still – not one of the 39 areas in England and Wales managing even 51% in May 2021, and Durham and Wiltshire not quite achieving 17%.  All of which, under FPTP, will mean large percentages of the votes of the most civically conscientious and politically committed citizens being ‘wasted’ and, arguably even more importantly, the mandates of the elected mayors and PCCs correspondingly diminished.

And then there’s the loss of the visual aids – for SV also produces what I only recently discovered are called ‘Sankey charts’, illustrating how the second-round count both produces a winner able to claim a statistical majority of positive votes and a dramatic reduction in the proportion of ‘wasted votes’ – on the part of voters choosing not to make use of their possible second choice. Good, isn’t it!

The Supplementary Vote, then, still favours the two main parties, but, returning to recent history and as shown in the following table, one in three of the 67 SV Mayoral elections going to second counts were won by Lib Dems, Independents and other parties. Labour won by far the most mayoral contests, but they also lost most in second counts. All of which contributes to SV hovering around mid-table in global democratic rankings of electoral systems – nothing to shout home about, except when compared with FPTP’s ranking as ‘least democratic’, apart from maybe Djibouti’s ‘Party Block Voting’.

SV’s statistical merits apply in principle to any elections, but particularly to a set in which two-thirds of turnouts were under 50% and nearly a third under 40% (see table). First, it hugely reduces the number and proportion of so-called ‘wasted votes’ – those cast for neither of the leading two candidates – and secondly it ensures that the winning candidate can claim the majority backing not necessarily of all voters, but at least of those the system counted.

My presumptuous guess would be that West Midlands PCC Simon Foster likes knowing, and possibly even mentioning now and then, that he was elected with 53.7% of the vote, rather than 45.5%. And, while I don’t know any of these people, that Surrey PCC Lisa Townsend (one of 12 women PCCs, if you were wondering) definitely prefers her 58% to 33.5%.

Time to start closing, by checking out the arguments Ministers sought to make to justify their replacement of SV with FPTP – or, rather, plundering the critique the Constitution Unit’s Alan Renwick and Alejandro Castillo-Powell made at the time.

  1. That SV increases the number of spoilt ballots – possibly, very fractionally; but, if so, why not work on improving ballot paper design?
  2. It allows ‘loser candidates’ to win – stupid argument (see above); they won the election they were required to contest.
  3. It reduces the accountability voters have in expressing a clear choice – but increases it by saving them from calculating how best to cast their single vote ‘tactically’ to elect or defeat a particular candidate.
  4. “FPTP is the world’s most widely used electoral system.”  Tricky – needs its own separate blog; also a bit silly. Depends a bit on whether you mean number of countries or number of voters. India, Pakistan, Bangladesh and the US give FPTP a head start. More to the point, a 650-Member legislature isn’t the same as a single elected mayor or PCC.
  5. SV is an “anomaly … out of step’ with other elections in England.” True, it was decisively rejected in the 2011 referendum for the election of MPs, but these are the country’s only public elections to executive offices. In short, they’re completely different.  

None of which, of course, stands the remotest chance of influencing, never mind changing, anything … but it was quite enjoyable to ‘research’ and write!

Chris Game is an INLOGOV Associate, and Visiting Professor at Kwansei Gakuin University, Osaka, Japan.  He is joint-author (with Professor David Wilson) of the successive editions of Local Government in the United Kingdom, and a regular columnist for The Birmingham Post.

Picture credit: Theresa Thompson at www.flickr.com/photos/theresasthompson/

Local councils must work harder at enabling women to be councillors

Picture: Haringey Council’s 2022 cabinet

Jason Lowther

Local councils can and must do more to enable women to be councillors. Haringey’s new cabinet shows that this can be done, but fifty years after all government elected officials across the UK were finally elected under universal suffrage, new research shows barely a third of local councillors and MPs are women, whereas earlier research showed less than a quarter of Police and Crime Commissioner (PCC) candidates were women.   This matters not only in terms of democratic fairness, but because politicians’ characteristics impact on public policy.

The research published last week by the Fawcett Society and Democracy Club reflects councillor representation in August 2022 across the UK.  To collect the data, they had to scrape individual council websites since (incredibly) there is no official record of councillors’ gender (or other protected characteristics).  This is because the relevant section of the Equality Act 2010 has still not yet been enacted and in any case as drafted would apply only to candidates in national elections.  This is in contrast to council staff, where the Equality Act applies and has led most councils to capture and publish reasonably detailed assessments of workforce equality issues – as shown by the recent SOLACE / Shared Intelligence report, ‘Understanding and Improving Equality, Diversity and Inclusion in the Local Government Workforce’ which we discussed on the blog last autumn.

The Fawcett Society / Democracy Club results show no party yet has parity of representation between women and men, but some are doing much better than others.   The highest proportion of women is found in the Labour Party (47%) and the lowest in the Conservative Party (29%), the SDLP, DUP, and Ulster Unionist Parties. 

Source: Gender representation on local councils, Fawcett Society and Democracy Club (2022)

At individual council level, the highest proportions of women councillors were found in Haringey (65%), Rossendale (61%), Brighton and Hove (56%), Lewisham (56%), and Southwark (56%).  In contrast, Perth and Kinross, Pendle, Comhairle nan Eileen Siar and West Berkshire each have 15% or less of the council made up of women councillors.

One effect of having fewer women decision makers may be that issues that disproportionately affect women are given insufficient attention.  Policymakers play key roles in promoting status-based policies.

Recent research by Professor Francesca Gains (University of Manchester) and Professor Vivien Lowndes (Inlogov) published in the journal Politics & Gender in 2021 analysed the effect of Police and Crime Commissioner’s gender on policymaking around violence against women and girls (VAWG).  An earlier quantitative phase of their research found that policy prioritisation was linked to Police and Crime Commissioners’ own gender, with female PCCs twice as likely to prioritize VAWG.  Their later research analysed how this difference occurred, identifying ‘seven sets of rules that have shaped policy prioritization in favour of VAWG: the right to make key appointments; the requirement to set policy priorities; the obligation to utilize equalities duties; the power to commit resources; the expectation of partnership working with other agencies; the commitment to hold operational police officers to account; and the maintenance of diverse channels of contact with victims of crime and the wider public’ (Gains and Lowndes, 2022, p. 396).

To improve the situation, the Fawcett Society / Democracy Club report makes recommendations to government, political parties and local councils.  For councils, the key actions are:

  • implement parental leave policies, to make being a councillor more accessible to those with caring responsibilities;
  • ensure that caring and dependency allowances reflect the real cost of childcare and are accounted for separately from ‘main’ members’ allowance;
  • pilot alternative ways of working including online and hybrid engagement mechanisms to enable councillors with caring responsibilities to carry out their duties more effectively; and
  • adopt codes of conduct, based on the model developed by the LGA in 2020

Local councils can only be truly effective when they represent the communities they serve.  The Fawcett Society report is a timely reminder that we have a long way to go, but the first steps are clear and practical.

Jason Lowther is Director of the Institute for Local Government Studies (INLOGOV), University of Birmingham

Reference

Gains, F. and Lowndes, V. (2022) ‘Identifying the institutional micro-foundations of gender policy change: A case study of police governance and violence against women and girls’, Politics & Gender, 18(2), pp. 394-421.