Birmingham – second city’s acceptable, but second most unequal?

Chris Game

Google “Birmingham – Britain’s second city” and you get 110,000 results; for “Birmingham – Britain’s third city” just three – all ignorant, obviously prejudiced, or both. By contrast, “Manchester – Britain’s second city” gets 895 results, only just outscoring “Manchester – Britain’s third city” with 866. QED – unofficial as the title is, if there’s going to be a second city, it’s Birmingham. Simples!

Except it’s not – not if you live and work in Birmingham, anyway. In vox pops and even proper opinion polls, Manchester more often than not edges it – and, as you may sense from the opening paragraph, we can get ever so slightly defensive about it. Which is why, if we’re offered ‘second city’ status, we generally welcome it – if only to stick it to Manchester.

Second most unequal city, however, is altogether different; and second most unequal city in the second most unequal country in Europe sounds, to me anyway, awful. Yet statistically that’s what Birmingham is.

Latest evidence comes in Cities Outlook 2013, the annual report on the economic performance of UK cities by the urban policy think tank, Centre for Cities. Now in its sixth edition, Cities Outlook is wide-ranging and influential, having played a major part in promoting the key role of cities, and particularly city-regions, as drivers of economic growth and recovery.

For policy purposes, this city-region emphasis is understandable, but it does make the title, Cities Outlook, a bit misleading. For it’s not in fact a comparative survey of 64 UK cities and their respective local authorities, but of 64 things called PUAs – Primary Urban Areas, or the built-up areas of cities, which may cover a whole bunch of authorities.

It’s fine for studying trends over time, but less so for comparing, say, Coventry and Birmingham, because Coventry PUA is the city, with its population of 319,000, while Birmingham PUA includes Dudley, Sandwell, Solihull, Walsall and Wolverhampton – and a population of 2.4 million. So you have to keep remembering: ‘Birmingham’ is actually Birmingham-plus.

Though entitled Cities Outlook 2013, the report’s data were collected back when we fondly imagined we were emerging from a mere double-dip recession, rather than slithering into a triple-dip one. The report assesses how its 64 city/PUA economies weathered the two dips, which in Birmingham’s case could be described as OK-ish. Not great; we’re in the half of cities more, rather than less, severely affected in both recession periods; but there are plenty of places that economically have had it much worse.

The trouble with OK-ish is that, while it may be mildly reassuring, hovering just below mid-table in any league doesn’t get you many headlines. So I tried looking for measures where Birmingham was near the top or bottom of a table.

In itself, of course, it’s easy. In any table measuring sheer quantity, Birmingham-plus is so large that it’s got to be right up there. Not surprisingly, we have the second highest population, second highest public and private sector employment, second largest housing stock, and second grossest CO2 emissions.

Not helpful. We need things measured in percentages or ratios – like inequality.  Cities Outlook uses a proxy indicator for inequality, dividing its cities into neighbourhoods with average populations of 1,500 and counting the percentages of Jobseeker’s Allowance (JSA) claimants in each neighbourhood. A city’s inequality is the gap between the neighbourhood with the highest JSA claimant percentage – assumed to be the poorest or most deprived – and that with the lowest.

In November 2012, the highest Birmingham-plus neighbourhood claimant rate was 24.1% and the lowest 0.4%, giving a gap of 23.7%, second only to Glasgow’s 25.4%. Obviously, there are other possible measures – household income, for example, or even personal wealth, as in last week’s other circumstantial inequality evidence, the Birmingham Post Rich List (see below). But JSA disparities are easier and less contentious. If you accept, as most statisticians do, their broad validity, Birmingham is currently the most economically unequal city in England, and second most unequal in the UK.

Though inequality isn’t directly related to size, large cities are almost bound to be more unequal than medium-sized and smaller ones, and six of the 10 largest cities are indeed among the 10 most unequal. London, though, was only 7th, Newcastle 9th, Manchester 13th and Liverpool 23rd, all with inequality gaps of less than 20 per cent. The truth is that, just as several of the smallest cities – Hastings, Gloucester, Ipswich – are by no means the most equal, the largest don’t have to be as unequal as some of them are.

And essentially the same is true of nations. There are numerous measures of national income inequalities, and, if you’re into visual aids, one of the most vivid depictions of Britain’s extreme economic inequality is that based on the regions into which, for statistical purposes, EU nations are divided: NUTS (Nomenclature of Units for Territorial Statistics). The NUTS 3 level comprises ‘small regions’, the UK’s 139 consisting mainly of upper-tier and unitary authorities.  For each NUTS 3 region the average individual Purchasing Power is calculated and standardised (PPS), and a country’s income inequality is the difference between its highest PPS region and the lowest.

game table

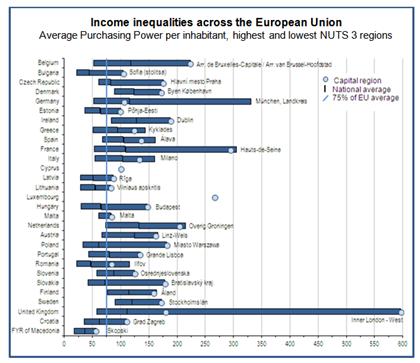
Source: Office for National Statistics

The UK national average PPS is 110.6, that in the highest region (Inner London – West) 596, and in the lowest regions (Wirral and West Wales) 57 – a tenfold inequality that is almost twice that in Germany and France, three times that in Italy and Spain, and five times that in Denmark, Finland and Sweden.

Dramatic as these ratios are, it should be emphasised that they are derived from workplace, rather than residential, data: individuals’ incomes are related to where they work, not where they live. The much more widely used measures of national income inequality are those based on the Gini coefficient or ratio, developed by the Italian sociologist, Corrado Gini. He was Mussolini’s favourite statistician, with some dubious ideas about nations having life cycles, and ‘young’ nations fulfilling their destiny by expanding at older nations’ expense, through a combination of wars and cross-breeding with younger races.

Happily, his stats were less flaky, and the Gini coefficient of national income distribution is widely used around the world, generally based in more developed countries on disposable, post-tax income. Data are collected through household surveys, and the coefficient runs from a hypothetical zero or perfect equality, where everyone has exactly the same income, to a similarly hypothetical 1, where one person has the lot.

In the latest statistics published by the 34-nation OECD (Organisation for Economic Co-operation and Development), the overall coefficient is 0.31, and the range extends from Slovenia (0.24) and Denmark (0.25), through the US (0.38) and Turkey (0.41) to Mexico (0.48) and Chile (0.49). Taking the EU-27 alone, highest is Portugal’s 0.35, closely followed by the UK on 0.34.

So Birmingham is the second most unequal city in the second most unequal country in the EU – which doesn’t altogether surprise me, but certainly isn’t something I’d want to celebrate. Nor the OECD, who are pretty clear what their figures represent: “High income inequalities typically imply a waste of human resources, in the form of a large share of the population out of work or trapped in low-paid and low-skilled jobs.”

Yes, I can see that, but then I’m not one of the 50 on the Birmingham Post’s West Midlands Rich List, published by pleasing coincidence in the same week as Cities Outlook. The net worth of the lucky 50 rose last year by just the 13.8% or £3.46 billion. That’s right, the single-year increase of these 50 mainly-male Midlanders alone equalled Birmingham City Council’s total budget, or roughly half of the real-terms funding loss of all English councils put together over the 2011-15 spending cycle.

Which, say our business leaders, is “very good news … [for] with wealth creation goes job creation and this is to be applauded.”  You can almost hear Thatcher, can’t you: “Our job is to glory in inequality”.  Remember the trickle-down theory? The rich perform a public service by getting richer still, because their prosperity would automatically trickle down to the poor. There are many still waiting for that trickle to reach them, and who must be relieved that the City Council’s ‘living wage’ policies at least sound as if they make sense.

game

Chris is a Visiting Lecturer at INLOGOV interested in the politics of local government; local elections, electoral reform and other electoral behaviour; party politics; political  leadership and management; member-officer relations; central-local relations; use of consumer and opinion research in local government; the modernisation agenda and the implementation of executive local government.

Councillors: Engage more and engage differently, but not at the expense of the basics

Karin Bottom, Catherine Mangan and Thom Oliver

This month saw the ‘Communities and Local Government Committee’ release its report on the role of the modern councillor. Focusing on  the impact of the Localism Act (and associated  developments in recent years),  Clive Betts MP,  Chair of the Committee,  suggested that local representatives are now spending less time in council and more in the community. As a result, they now shoulder the majority of responsibility for ensuring that  that their local communities have the tools to make the most of the localities in which they live. While the Report’s findings held few surprises, it did suggest that those we elect to be the local democratic voice of our communities must embrace this challenge and meet it head on. This position resonates with early findings from an INLOGOV project concerned with local engagement and the role of the local representative.

Firmly grounded in the belief that councillors’ responsibilities and remits vary, the current climate suggests they require a more nuanced and responsive skill set than ever.  In this sense, elected representatives must be outward looking, open to new ideas and welcoming of new approaches, but they must take care not to throw out the baby with the bath water.  Instead, our research suggests that what councillors need to do is integrate new learning into their existing repertoire of behaviours, while at the same time being more dynamic and responsive in their increasingly frontline role.[i]

For respondents, one of the main challenges they felt they faced was engagement. Whereas it is natural for all councillors to ‘do engagement’, a variety of approaches were evident in our research and for those who had moved into executive positions, the role shift was accompanied by community activities having to be curtailed. Respondents were very clear that the Localism Act was beginning to have an impact, for example in the mediating role that  has now been allocated to councillors: this meant developing skills as a community organiser and ultimately being on top of a great volume of information while managing a number of resources and contacts. This form of community engagement, though hard, was thought to have clear  rewards: a number saw the benefits of having shared aims and  a deeper understanding of the people they represented,  which in turn provided greater insight into the experience of being on the receiving end of council services; in contrast others thought wider community engagement created opportunities to lead opinion and ultimately change behaviour, for example one councillor worked with environmental groups to shape the ward’s attitude towards refuse collections and recycling.

Our interviews also surfaced information suggesting that that the majority of traditional communication methods continue alongside a slow evolution to greater online engagement and use of social media. While one councillor referred to sending regular email shots and creating a web page to articulate local information, activities and updates,  another described  how Facebook had enabled him to engage with people – often young people – who  generally chose not to participate in politics and local policy conversations. Finally, a number of councillors explained that twitter enabled them to aggregate opinions en mass, engage in debates and learn information they would otherwise be unaware of,  while some with cabinet responsibilities stated that this particular medium was unique in that it enabled them to keep on top of their portfolio while also providing opportunities to build and consolidate relationships they would otherwise not have had time to address..

One factor that was evident in almost every interview was that councillors always needed to be aware of the bigger picture: different methods worked in different situations and knowing a ward’s story or the history behind a particular community group could make the difference between successful and unsuccessful engagement. Just because a particular approach might work in one instance, there is no assurance it will work in another, despite apparent similarities. So, while councillors may see their responsibilities increasing and their community role broadening, it is vital that they maintain depth in their representative activities: if they don’t, potentially successful initiatives run the risk of failing.  

The authors are grateful to the School of Government and Society, University of Birmingham, for providing funds to assist in this research. With thanks also to NLGN for their contribution to this work.  For further information about the research project, contact Karin A. Bottom: [email protected]

bottom-karin

Karin Bottom is Lecturer in British Politics and Research Methods at INLOGOV, University of Birmingham.  Her core research areas comprise parties (particularly small and the BNP), party systems and party theory.  She is particularly interested in concepts of relevance and how national level theories can be utilised at the sub-national level.

Portrait of OPM staff member

Catherine Mangan is a Senior Fellow at INLOGOV.  Her interests include public sector re-design, outcomes based commissioning and behaviour change.  Prior to joining INLOGOV she managed the organisational development and change work for a not-for-profit consultancy, specialising in supporting local government; and has also worked for the Local Government Association, and as Deputy Director of the County Councils Network.  She specialises in adult social care, children’s services and partnerships.

thom

Thom Oliver is a Postdoctoral Research Fellow at Oxford Brookes Business School.  He completed his PhD, exploring the representative role of councillors on appointed bodies, at INLOGOV in 2011. He currently lives in Bristol and has recently rejoined INLOGOV as an Associate.  Follow his Twitter account here, and read his own blog here.


[i] Research to date provides initial findings from interviews in three councils (one London Borough and two Metropolitan).  Interviews comprised a broad mix of age, seniority, roles and experience. Approximately equivalent numbers of men and women were interviewed.

You couldn’t make it up – except DCLG just did

Chris Game

Did you see manager Arsène Wenger’s explanation of Arsenal’s feeble performance against Manchester City last Sunday?  While most players are galvanised by home supporters and see playing at home as an advantage, Arsenal’s apparently are scared by theirs. “They have a great desire to do well, so maybe they’re a bit too anxious that they don’t respond completely to the expectation level of the crowd.”

A strong bid, certainly, for this week’s You-couldn’t-make-it-up prize, were it not for the Department for Communities and Local Government (DCLG), who, not satisfied with inventing their own measure for disguising the severity of their grant funding cuts to councils, have now disguised it still further by double-counting. If the whole grant-slashing exercise weren’t so serious, the ineptitude really would be laughable. Ridicule aside, it can only serve to validate and reinforce the allegations of unfairness that core city leaders in particular have been making.

Nick Forbes, Newcastle City Council leader, kicked off in November, writing personally to David Cameron to complain about the ‘unfair’ impact of funding cuts on councils like Liverpool with cheap housing and therefore a low council tax base. Then on December 19th, local government finance settlement day, the leaders of all seven English core cities – Birmingham, Bristol, Leeds, Liverpool, Manchester, Newcastle and Sheffield – wrote jointly to Local Government Secretary, Eric Pickles, demanding an urgent meeting to address the “looming financial crisis” their authorities were facing.

The scale of the potential crisis was illustrated by reference to the Jaws of Doom’ graph – Birmingham’s version of Barnet Council’s now famous and similarly apocalyptic ‘Graph of Doom’, produced by the London borough to shock residents, but particularly Ministers, into realising that by 2020 councils would be facing a £16.5 billion shortfall, with no money left for anything apart from children’s services and adult care.

The ‘Jaws of Doom’ graph appears in Birmingham City Council’s budget consultation document (p.8) and does indeed resemble the gaping jaws of a crocodile, attacking from stage left, but unable to swallow the monstrous £600 million budget deficit for which the council estimated, last October, it was heading – and now, following the finance settlement, closer to £625 million.

jaws of doom

This is on top of the £275 million of mainly ‘efficiency and transformational’ savings, including a 25% staffing cut, already made over the past two years, and that have brought the council to the point where the Labour administration, elected last May, claims further efficiency savings are no longer enough. The severity of the reductions in government grant will necessitate significant cuts in front-line services. Hence the budget consultation: outlining the Council’s proposed four-year savings programme, and seeking residents’ views on detailed service cuts for 2013/14, and on alternative council tax scenarios – a further freeze, a limited increase of under 2%, or a larger increase requiring referendum approval.

One question, however, that the consultation document neither asks nor, judiciously, attempts explicitly to answer is: IS IT FAIR?  So I thought I’d have a go.

Are Birmingham and urban councils generally, or Labour councils, or the most deprived areas, being particularly harshly treated by these grant funding cuts? Or was Pickles right, when he insisted in his finance settlement statement that “overall the average spending power reduction for councils in 2013/14 is expected to be limited to just 1.7% per household”, and that “concerns that the poorest councils would suffer disproportionately are well wide of the mark”?

Well, let’s start right there, with that phrase ‘spending power’ (SP) reduction – used by Pickles and his civil servants in preference to the ‘grant reductions’ quoted by council leaders and measured by the ‘Jaws of Doom’. Are they different? You bet. SP was introduced in 2010/11, when the new Government announced its intention to cut central government grant funding of council revenue spending by an unprecedented 28% in cash terms (nearer 40% in real terms, allowing for inflation) over four years, with 21% ‘front-loaded’ in the first two years.

To disguise the savagery of that front-loading, and to make before-after comparisons more difficult, the DCLG first restructured the whole grant allocation system, and then created ‘revenue spending power’ – a measure Ministers claimed that, by including council tax receipts, certain specific grants, and NHS social care funding, gave a fuller picture of a council’s overall financial position. Fuller, yes, but not full. If it really was a full, rather than politically beneficial, picture that Ministers wanted, they could have included income from fees, charges and investments. These, however, are income sources that tend to decline in a recession and whose addition to SP would emphasise, rather than de-emphasise, councils’ grant dependency – so nothing like as helpful as the DCLG’s contrived measure, which could instantly reduce a 28% grant cut to a 14% cut in spending power.

You’d think this was sufficient, but this year, it seems, they’ve really over-egged the pudding by double-counting council tax support in two separate elements of SP. Sadly, at the time of writing, the Department was refusing to help Local Government Chronicle journalists with their enquiries into how the double-counting occurred, and whether it was intentional or accidental. Either way, Pickles’ claim of an average 1.7% spending power cut in 2013/14 was clearly wrong and should have been about a percentage point higher.

Having changed the system and invented new terminology, Ministers’ next rule is always to describe funding reductions in overall percentages, not cash. This fools no one who gives a moment’s thought to how grant funding works, but then there are plenty who don’t.

Formula Grant – the general grant allocated in the annual finance settlement – is calculated in four blocks, the two key ones being Relative Needs, to compensate for areas’ differing service needs, thereby broadly reflecting economic and social deprivation; and Relative Resources, reflecting the strength of an area’s council tax base and ability to raise its own revenue. In combination, these two elements mean some councils are much more reliant on central government grant than others. The more deprived the area, the greater is its need for council services, the lower its council tax base and tax receipts, and therefore the higher the proportion of its revenue spending that needs to be funded by central grant.

Overall in 2012/13, 27% of councils’ revenue spending is funded through council tax. But that proportion ranges from averages of 16% and 22% among Inner London and metropolitan boroughs to over 50% among shire districts. Even neighbouring councils’ grant/tax ratios can differ considerably – like Birmingham’s 84% grant/16% council tax and Solihull’s 67%/33%. What can be presented, therefore, as a uniform 10% grant cut across the country means for Birmingham a budget cut of 8.4%, for Solihull one of 6.7%, but for some shire districts barely 2%. Not so uniform after all.

The reforms to specific or targeted grants have hit councils in deprived areas relatively harder still. Some grants specifically conceived for deprived communities, like the Working Neighbourhoods Fund and area-based grant, have been run down or scrapped altogether. In contrast, the Council Tax Freeze grant to councils agreeing to follow the Government’s tax-freeze policy comprises a 3.5% addition to a council’s existing tax revenues, so benefiting most those with higher tax bases. Likewise, the New Homes Bonus Scheme, funded by top-slicing the central grant to all authorities by equal proportions, benefits disproportionately those in the south, where the bulk of the building is.

Obviously, there have been and will continue to be numerous other technical changes in the grant funding system, with criss-crossing impacts on different kinds of councils. Even a year ago, though, the Audit Commission’s Tough Times report was clear that “there is a strong link between local deprivation and the scale of funding reductions”, with “deprived areas in the north, the midlands, and inner London [experiencing] the greatest cuts”.

There have been several comparisons of the scale of funding cuts across individual local authorities, among the most accessible being the Guardian newspaper’s analysis and interactive map. English local authorities were found to be facing, on average, a cut of £61 a year per person in the total central government funding they would receive between 2011 and 2014, but the range extended from over £250 per person in Hackney, Liverpool and Knowsley to North Dorset’s £2.70.

The severity of cuts correlated closely with the Government’s own Index of Multiple Deprivation (IMD), examples including Liverpool – IMD 2nd, funding cut 2nd (₤252); Manchester – IMD 4th, funding cut 5th (₤210); and Birmingham – IMD 13th, funding cut 16th (₤166). Of the 30 councils facing the severest cuts, 28 are currently Labour controlled. All of which suggests – returning to Pickles’ other bluster from his finance settlement statement – that “concerns that the poorest councils would suffer disproportionately” are not so wide of the mark after all, and certainly not as wide of it as his own 1.7%.

game

Chris is a Visiting Lecturer at INLOGOV interested in the politics of local government; local elections, electoral reform and other electoral behaviour; party politics; political  leadership and management; member-officer relations; central-local relations; use of consumer and opinion research in local government; the modernisation agenda and the implementation of executive local government.

City deals: A missed opportunity?

Martin Stott

Today is the deadline for the submission of the second round of ‘City Deals’.  Twenty cities and city regions are putting proposals to DCLG based around four ambitious objectives to:

    • Boost local economic growth
    • Rebalance the economy spatially and sectorally
    • Decentralise the powers and levers cities need to drive local economic growth and
    • Strengthen their governance and leadership

When they were originally announced by Deputy Prime Minister Nick Clegg in a speech in Leeds in December 2011, City Deals were part of the carrot to encourage large cities to opt for elected mayors. Devolution of major new powers and budgets to new city leaders were promised. Unfortunately with the exception of Bristol, the electorates didn’t play ball. But DCLG pressed on and the deals were announced in July 2012, with Birmingham, Bristol, Leeds, Liverpool, Manchester, Newcastle, Nottingham and Sheffield – thereby ironically, cutting the new mayor in Bristol, George Ferguson (who wasn’t elected until November 2012), out of the process. At the time of the DPM’s announcement, there was a sense that this might be a real and significant constitutional change, in tandem with the arrival of the new city mayors. But between the launch speech and the reality of policy on the ground, things became a lot more prosaic, as the agreements struck in 2012 lay bare.

As ever with central-local government relations, the reality has in no way matched the original hype and  in a time of retrenchment generally and ever smaller budgets for local government in particular, DCLG have been in no position to  provide anything very much in the way of new resources. Staff in Councils and Local Enterprise Partnerships (who are key players in the proposed new ‘city deals’ because of their focus on private sector led economic growth) comment that ‘there is no real money in it’, and that the process and likely outcome is similar to that seen in the negotiation of Local Public Service Agreements (LPSA) and the abortive ‘Total Place’ initiatives under the last Government.

There is one striking difference between city deals and LPSA’s, picked up by the Green Alliance in their report Green Cities; using city deals to drive low carbon growth. Whereas LPSAs all had a climate change/green economy strand in them, the city deals struck with the ‘big eight’ cities have this dimension largely as an add-on, if that. The Green Alliance found that only Leeds framed its approach to growth with a low carbon vision for the city and that apart from Newcastle, few deals acknowledged the role of tackling climate change in securing resilient economic growth. Bristol, a city whose image has been predicated on an at least vaguely greenish tinge, has a City Deal that makes no mention of the subject.

Now the programme is being extended to a ‘second wave’ of twenty localities from ‘Sunderland and the North East’ to Plymouth. The group is made up of the 14 next largest English cities (after the ‘big eight’) plus a further six – such as Greater Cambridge and Milton Keynes – which recorded the highest population growth between 2001 and 2010.  One of the striking aspects of this group of cities – the smaller and fast growing ones – is that they in many cases already have a significant ‘green economy’ dimension, or are cities whose location  brings opportunities waiting to be exploited, such as Hull and Teeside. But if the poor record of the first round of City Deals is any kind of baseline – and with the second round of city deals focussing on a single initiative rather than a range of measures – the prognosis for more than a handful ending up taking advantage of this crucial part of the ‘rebalancing’ of the UK economy looks pretty bleak.

stott

Martin Stott was Head of Environment and Resources at Warwickshire County Council until the autumn of 2011, when he concluded a 25 year career in local government.  He has recently become an INLOGOV Associate.

Making Ends Meet: What Aren’t We Talking About?

Catherine Staite

Last month West Somerset District Council sent up a distress flare.  They can’t make ends meet and it is only going to get worse.  At the other end of the scale, the Leader of Birmingham City Council has announced £600m of cuts and declared that the changes which are coming will be ‘the end of local government as we know it’. LB Barnet’s ‘graph of doom’ demonstrates how rising social care costs will eat up their resources until there is no capacity to do anything else but social care and emptying the dustbins.

At INLOGOV we’ve been rather optimistic about the potential for some good to come out of the financial crisis.  We’ve been talking about how we need to build capacity, change relationships and challenge expectations – something we’re calling a ‘new model’ for public services. We are working with some very innovative councils who are embedding radical new thinking in the way that they prioritise resources and commission services. I really believe that it will be possible for them not only to survive but to thrive in this difficult climate.

Others will not be so fortunate. They may ‘salami slice’ and inadvertently lose all their innovative, creative people and therefore their capacity to change.  In some cases political and managerial leadership can’t imagine a different sort of world and so can’t act quickly enough to start building better relationships with communities, managing demand and harnessing capacity to help bridge the gap between what people need and what can be provided.  This requires a new style of local government and  very different, outward facing, political skills.

We are talking about many ways of mitigating the impact of reduced resources on the most vulnerable, but the one thing we don’t seem to talking about is streamlining the machinery of local government. Local government re-organisation – that is, merging smaller councils and moving to a world where shared services are the norm – could help to make the best use of limited capacity and save significant amounts of money but it is rarely discussed.  Many districts and some unitaries have successful shared arrangements, with chief executives and senior management teams managing up to three councils, with evident success.  Why don’t we talk about taking that further? Surely it isn’t because Mr P doesn’t like the idea.  That would recommend it to many. Perhaps it seems too difficult and painful a topic to discuss.  But if we don’t, then opportunities will be lost to make the changes in a positive way and not in a crisis, when distress flares have already gone up.

In Denmark, local government has re-organised itself successfully in recent years. Councils joined together voluntarily with their neighbours until they achieved the best possible combination of size and geography to deliver economies of scale and locally accessible services.  Perhaps we should think about doing the same thing?  If local government doesn’t take the initiative and provide its own leadership on this, no-one else will.  How can we justify the inefficiencies and unnecessary overheads of two tier areas and tiny unitaries in the current financial climate – when cuts are having a real impact on the most vulnerable?

English local government is demonstrably resilient and resourceful.  Can it also be clever, brave and altruistic?

Catherine Staite

Catherine Staite (Director of INLOGOV)
Catherine provides consultancy and facilitation to local authorities and their partners, on a wide range of issues including on improving outcomes, efficiency, partnership working, strategic planning and organisational development, including integration of services and functions.

Elected Mayors: The Wrong Solution to the Wrong Problem

Catherine Durose

Only one eligible voter in every three participated in the local elections in May 2012, the lowest turnout since 2000 and despite a context of austerity and swingeing public spending cuts. The recent elections for Police and Crime Commissioners saw turnout slump to a record low for a national poll, averaging at 15%. To quote a Guardian editorial, ‘lack of engagement is the most eloquent of all the political messages…. and one that the parties need to take most seriously. Voters are fed up, not fired up’. Collapsing turnout is perceived as part of a wider decline in traditional forms of political participation, this trend has been labelled as a ‘democratic deficit’ and it is this ‘problem’ that elected mayors are seen as offering a fix to by as simplifying local democratic accountability and offering greater visibility for citizens.

In the referenda held in May 2012, the rejection of elected mayors was near unanimous. The average turnout was low at 32% with over 60% of those who participated, voting for the status quo. The turnout can be, in part, explained by the uncertainty and confusion amongst the electorate about what they were being asked to vote on (the powers which elected mayors would have was, and remains, unclear). But, the size of the ‘no’ vote suggests, at the least, a lack of enthusiasm about electing more politicians. Indeed, voters in Hartlepool have now decided to scrap the position of a directly elected mayor after three terms of office.

Bristol is an exception, by a narrow margin of 7%, it was the only one of the ten cities to vote in favour of an elected mayor. Yet, the Bristol mayoral election, held on 15 November 2012, only received a turnout of 27.92%. Of the fifteen candidates who contested the elections, only one was female and one was non-white. The newly elected mayor of Bristol, George Ferguson, whilst depicting himself as an independent, has previously sat as a Liberal councillor and contested a seat at two General Elections for the Liberal Democrats.

In thinking about why citizens are ‘fed up’ with local democracy and why the idea of elected mayors was a turn-off, perhaps we should take a look at those contesting and winning these elections. As in Bristol, mayors do not represent a radical departure from the professionalised political class or indeed the mainstream political parties which citizens are increasingly dis-engaged from: Boris Johnson in London, Ian Stewart in Salford and Peter Soulsby in Leicester, are all former MPs; Joe Anderson in Liverpool is a former Leader of the council.

I would argue that elected mayors are the wrong solution to the wrong problem. The currently proposed fixes in the constitutional reform agenda, including elected mayors, to deal with the ‘democratic deficit’, are clearly not producing changes which citizens are interested in engaging with. Perhaps this is because the assumption that underpins such fixes – that citizens are apathetic about politics – is incorrect. If we challenge this thinking, then many of the proposed fixes seem like the wrong solution to the wrong problem. If we instead recognise that many people feel that representative politics doesn’t represent them or indeed engage with the important issues that affect their everyday lives, then a different problem with a potentially different solution emerges.

One means of responding to a decline in traditional forms of political participation is to offer different opportunities to engage democratically. Broadening the range of democratic engagement fits with re-thinking what citizenship means: it’s less a ‘status’ which people possess and more a ‘practice’ that people participate in. Looking at data on levels of different forms of civic activity in the UK suggests there is a healthy base of existing participation and an appetite for more. The Hansard Audit of Political Engagement suggested that 14% of people are already active, but 51% felt that getting involved could make a difference; 14% of these were considered as ‘willing localists’, people who were not actively involved but were willing and likely to do so locally.

But how can we tap into this latent demand? First, local authorities and other public bodies need to stop ‘second-guessing’ citizens.  Recent research highlighted that whilst two thirds of local councils felt that the community would be unmotivated to participate more locally, less than 20% of them had formally assessed communities’ interest.  Second, we need to acknowledge that a lot of current opportunities for ‘participation’ replicate some of the problems of local representative democracy by acting as ‘mini town halls’ offering only tokenistic consultation of citizens, failing to recognise Sherry Arnstein’s seminal observation that “there is a critical difference between going through the empty ritual of participation and having the real power needed to affect the outcome of the process”. Third, to look for alternative ways to mobilise citizens and communities. I recently attended Locality’s annual convention – the organisation now recruiting and training 500 senior community organisers, along with a further 4,500 part-time voluntary organisers, over four years spent working with community host organisations. For Locality, this initiative is about ‘building a movement’. Speaking to organisers, they see their challenge as mobilising social action and generating a sense that change is possible. I have seen the impact of organising first-hand in Chicago, and it was inspiring to hear the impact the programme is already making there. If an elected mayor is to make a difference to local democracy, it won’t be as a visible manifestation of Politics, it will be about embracing and supporting these new social movements.

Catherine Durose is Senior Lecturer and Director of Research in the Institute of Local Government Studies at the University of Birmingham.  Catherine’s research focuses on the changing relationships between the state, communities and citizens.