Shailen Popat
What happens when city managers from Ghana and governance experts from the UK sit around the same table? Ideas spark, assumptions are challenged, and new ways of working begin to take shape. That’s the story behind the Ghana City Managers Community of Practice (CoP) – a bold experiment in international collaboration that’s changing how we think about public management. The full article published in the Education in Practice journal can be found here.
Why This Matters
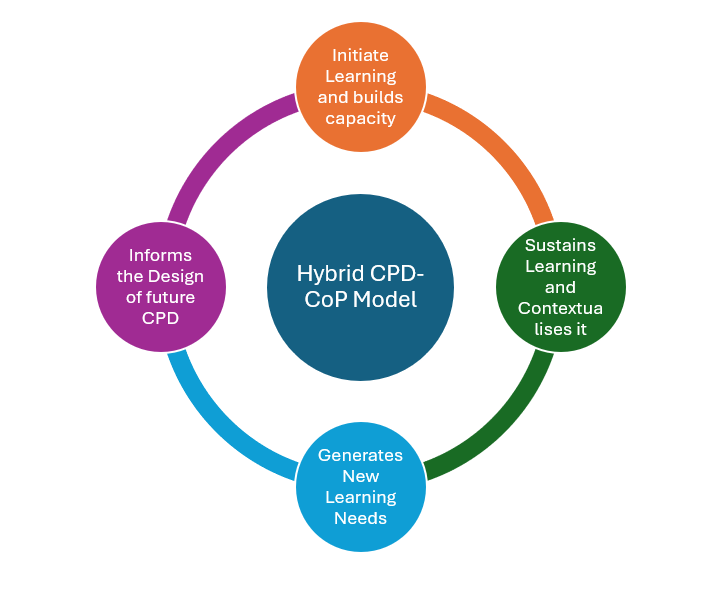
Public managers everywhere face “wicked problems” – issues like urbanisation, climate resilience, and service delivery that defy simple solutions. Traditional training often falls short because it’s one-off and disconnected from real-world complexity. Enter Communities of Practice: long-term learning networks where practitioners and academics share experiences, co-create solutions, and build trust. They’re not just about knowledge – they’re about relationships and sustained engagement. CoPs are powerful because they bridge the gap between theory and practice. They allow managers to learn from each other, adapt ideas to local contexts, and build confidence in tackling complex challenges. For countries like Ghana, where decentralisation and urban growth create both opportunities and pressures, this approach offers a way to strengthen governance without imposing external models.
The Big Idea
In March 2025, the University of Birmingham hosted 14 senior Ghanaian officials for a week of immersive learning. Backed by the UK’s International Science Partnerships Fund, the visit wasn’t a typical study tour. It was a strategic intervention to launch a transnational CoP – one that blends academic insight with practical experience and positions both Ghana and the UK as partners in governance innovation.
The goals were clear:
- Forge lasting institutional partnerships
- Co-design training materials rooted in Ghanaian realities
- Build capacity through comparative insights
- Shape future research on urban resilience and inclusive governance
This initiative reflects a broader shift in development practice – moving away from top-down technical assistance towards partnership-based models that prioritise mutual benefit and knowledge reciprocity.
Inside the Week: What We Did
The programme kicked off with a high-energy plenary featuring voices from both sides of the partnership: Prof. Samuel Bonsu (GIMPA), Dr Nana Ato Arthur (former Head of Ghana’s Local Government Service), and Mo Baines (CEO, APSE). Their message was clear – governance challenges may differ, but the principles of collaboration and accountability are universal.
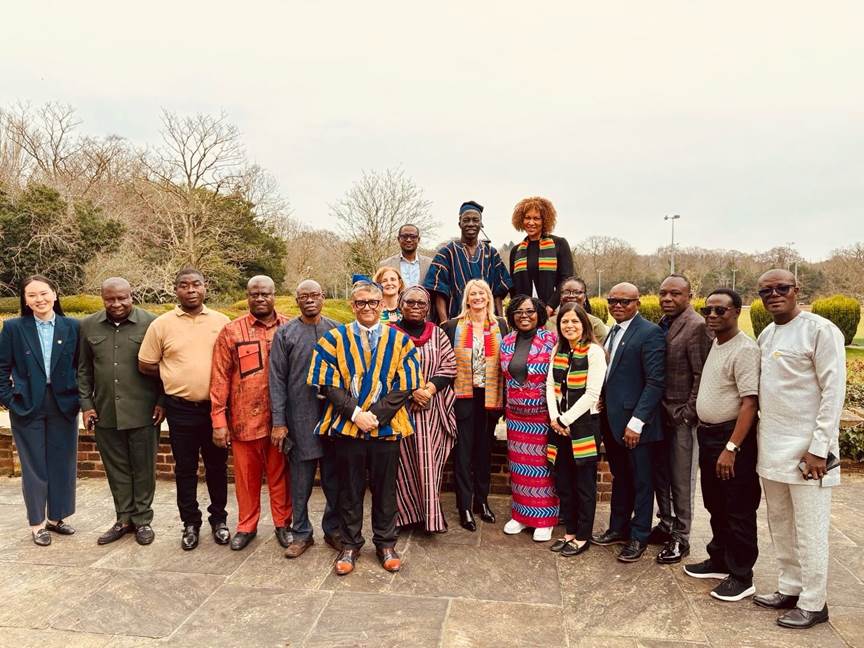
Photograph of the CPD participants and some trainers at the Edgbaston Campus
Workshops tackled decentralisation, participatory planning, and sustainable cities. These weren’t lectures – they were conversations, with Ghanaian managers sharing frontline realities and UK experts offering comparative perspectives. Institutional visits added texture: at the West Midlands Combined Authority, delegates explored regional governance and economic development strategies; at Birmingham’s Lord Mayor’s office, they saw the symbolic power of civic leadership in action. The week ended with a roadmap: virtual meet-ups, annual exchanges, and joint research projects. Participants left not just with ideas, but with commitments to keep the momentum going.
What Changed?
The impact was immediate and tangible:
- Partnerships Deepened: UoB, GIMPA, and Ghana’s Local Government Service agreed on joint research and staff exchanges
- Capacity Built: Delegates gained practical insights into governance models they could adapt at home
- Training Co-Created: New modules blend academic theory with Ghanaian case studies – tools designed by practitioners, for practitioners
- Policy Influence: Senior officials pledged to embed lessons into local reforms
- Research Horizons Expanded: Themes like digital governance and urban resilience emerged as priorities for future collaboration
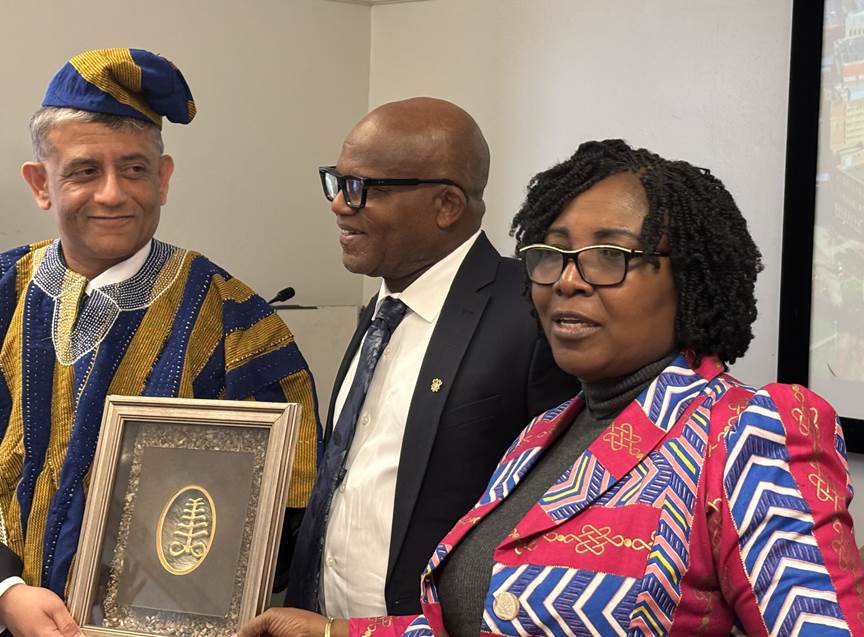
The Head of the Ghanian Local Government Service, Dr Stephen Nana Ato Arthur and the Chief Director of the Office of the Head of the Local Government Service, Madame Felicia Dapaah Agyeman-Boakye, honouring Shailen at the end of the CPD in Edgbaston.
Why It’s Different
This isn’t about exporting UK models or ticking boxes for donor reports. It’s about mutual learning and knowledge democracy – valuing local expertise as much as global frameworks. It’s also about universities stepping up as conveners of global networks, using their resources and credibility to drive real-world change. The co-designed training materials exemplify this ethos. They combine global frameworks with Ghanaian case studies, creating tools that are contextually grounded and practically useful. This approach aligns with calls to decolonise development practice – moving away from prescriptive solutions towards collaborative innovation.
What’s Next?
The Ghana CoP is just the beginning. Plans are underway to bring in managers from other African and UK cities, creating a richer, more diverse learning ecosystem. Future funding bids will build on the success of this pilot, ensuring the network grows and thrives. For INLOGOV, this story is a call to action: let’s champion collaborative governance, not as a buzzword, but as a practice that transforms institutions and communities. The challenges facing public managers are too complex for isolated solutions. By investing in relationships, shared learning, and co-production, we can create governance systems that are adaptive, inclusive, and resilient.
Dr. Shailen Popat works as an Assistant Professor in Public Policy and is the Director of the MSc in Public Management at the University’s Institute of Local Government Studies. He completed his PhD at the University of Oxford and his thesis explored the sensemaking processes of School Principals when enacting a significant new policy. He specialises in supporting public managers to enact policies in a manner that can be effective in their context and is a founding partner of a partnership between the University, GIMPA, and Ghana Local Government. Known for his student-centred approach and ability to explain complex concepts in a comprehensible manner, Shailen is considered to be an outstanding lecturer and tutor and was awarded the accolade of ‘Teacher of the Year’ at the 2022 University of Birmingham Teaching Awards, and in 2023 he was awarded a Senior Fellowship of the UK Higher Education Academy for his Educational Leadership.