Conservative and Labour council tax claims: both right, and both deceptive

Chris Game

It used to be a toss-up which would come first: the political parties launching their local election campaigns or the letter in The Times claiming its author has heard the first cuckoo of Spring. Sadly, with the cuckoo’s drastically declining population both here and worldwide, it’s the politicians that usually win these days, but perhaps it’s some kind of compensation that they can generally be relied upon to produce some distinctly cuckoo-like behaviour – as in daftness, rather than parasitism.

David Cameron chose Nuneaton in Warwickshire for his launch of the Conservatives’ campaign, which electorally certainly made sense. With the most non-Conservative areas in several traditional counties having become unitaries, Warwickshire is one of the few genuinely marginal counties around, with the Conservatives maybe having the edge in votes, but Labour having run the county council for longer in recent years as a minority administration. Come to the West Midlands in April, though, and you have to confront the Aston Villa relegation issue. Cameron was “sure it’ll be alright in the end”, which in the circumstances, and especially as he was careful not to define “end”, was also not daft. Some of his other views, though, did seem to suggest that he might have just migrated in from Africa.

The Government’s Localism Act had empowered local government, he asserted, so local elections now mattered more than in the past … “We’ve given councils much, much more freedom …”. It was the double emphasis that took the biscuit. It must be really, really difficult for most councils, having seen their grant funding slashed year by year, and having just implemented their fourth round of spending cuts to meet budget and tax ceilings effectively dictated by the Government, to identify quite where all this freedom and electoral meaningfulness are hiding.

However, it’s not the function of an INLOGOV blog to engage in partisan knockabout – no, really, it’s not. This one’s serious purpose is to try to inject a bit of factual clarification into what looks like becoming a pretty heated debate about council tax – a little ironically, talking of electoral meaningfulness, when very few of the councils holding elections are actually billing authorities.

In neighbouring Worcestershire, for instance, should electors in Bromsgrove and Malvern Hills vote as if to punish their tax-collecting Conservative councils for rejecting Cameron and Pickles’ “clear moral imperative” to freeze their council taxes for the sake of “hard-working families and pensioners”? That presumably would be a demonstration that local elections mattered. Or should they reward Conservative Worcestershire for taking the Government’s one-off grant (equivalent to a one per cent rise in council tax) and freezing the much bigger portion of their tax bill?

It’s a definite complication for the Conservatives, who would have liked to be able to contrast phalanxes of blue councils, which had obediently taken the grant and frozen their tax bills for a further year, with loads of red and orange/yellow ones that had ignored their “moral imperative” and increased theirs. There was no lack of ministerial arm-twisting (proverbial, I presume) and other threats and pressures to which Conservative council leaders were subjected, but at the end of the day, as the Sunday Telegraph was one of the first to document, the figures just didn’t turn out right.

In a mid-March survey of all 353 English councils, the Telegraph found first that a total of 124, or more than a third, were increasing their council tax bills as a way of raising revenue. Secondly, more than half of these offending councils (64) were Conservative – that’s more than one in three of those the party currently controls. Some, moreover – as can be confirmed in a more recent House of Commons briefing paper (Appendix 7) – were seriously big and embarrassing names.

The three tax-raising counties were almost bound to be Conservative, and indeed are – Cambridgeshire, Surrey, and a particularly interesting A N Other. The six London boroughs were more mixed. There were 2 of Labour’s 18 – Lewisham and Harrow; 1 of the Lib Dems’ 2 – Kingston-upon-Thames; and 3 of the Conservatives’ 11 – Bromley, Croydon, and, with the biggest increase of all at over 3%, Wandsworth. As for A N Other, the Sunday Telegraph seemed almost salivatingly pleased to note that the Tory miscreants “included Oxfordshire County Council, which is David Cameron’s local authority, and Runnymede Council in the constituency of Philip Hammond, the Defence Secretary.”

None of this, of course, is going to stop the Conservatives exhorting us in virtually every campaign speech to vote Conservative for lower council taxes. But listen carefully to what they actually say, like Cameron himself on Friday: “On average, on a Band D bill, Conservative councils continue to charge lower levels of council taxes than Labour or Lib Dems.” And it’s perfectly true. It generally is. And, unless you stop and think about it for a few moments longer than most voters are probably likely to give it, it’s seriously misleading.

As, in a very similar way, is Labour’s counter-claim that we should vote for them, because, to quote Hilary Benn, Shadow Secretary for Communities and Local Government, from last year’s election campaign and no doubt from this year’s as well: “Households in Labour-controlled authorities pay on average less council tax per year than those in Tory and Lib Dem areas”.

Note the small, but hugely significant, difference: Conservatives: average Band D; Labour: average per household/dwelling. If I were preparing students for an exam, I might suggest they use a mnemonic – say, Bullingdon and Downing Street for Band D – but I’d also try to get them to think it through, because it’s really not brain-hurting stuff.

The tax base for council tax is a ratio system based on 8 valuation bands, centred around Band D (properties valued, in 1991, at ₤68,000 to ₤88,000). Band A properties (under ₤40,000) pay 6/9 (2/3) of Band D; Band B 7/9, and so on up to Band H (over ₤320,000) paying 18/9 (2x) of Band D. Councils calculate their tax base by weighting the number of dwellings in each band to Band D, and report their budget headlines in terms of ‘Council tax for council services (Band D)’.

Band D has thus become a benchmark for comparative purposes, and it is perfectly reasonable for the Conservatives to use it – reasonable but disingenuous. Not so much because only a small minority of properties (15% in England) are actually in Band D, but because, exacerbated by the absence of any revaluation since 1991, the mix of property bands across authorities and regions nowadays varies starkly. In my own authority of Birmingham 66% of properties are in Bands A and B, and just 8% in E to H combined. Neighbouring Solihull has 29% in Bands A and B, and also 29% in E to H. In the North East there are 55% Band As, in the South East 9%, in London 3.6%.

All of which obviously means that, to raise any particular sum of money in an authority with mainly Band A to C properties requires a higher Band D tax than in one comprising many E to H properties. The average bills paid per household will vary similarly – being generally higher than the Band D figure in more affluent and Conservative-inclined areas, and lower in less affluent or Labour-inclined ones. Hence Labour’s equally disingenuous preference for average tax bill figures. Two contrasting Inner London boroughs provide an illustration. Kensington and Chelsea: Band D – £1,086; average tax per dwelling – £1,190; Tower Hamlets: Band D – £1,189; average tax per dwelling – £787.

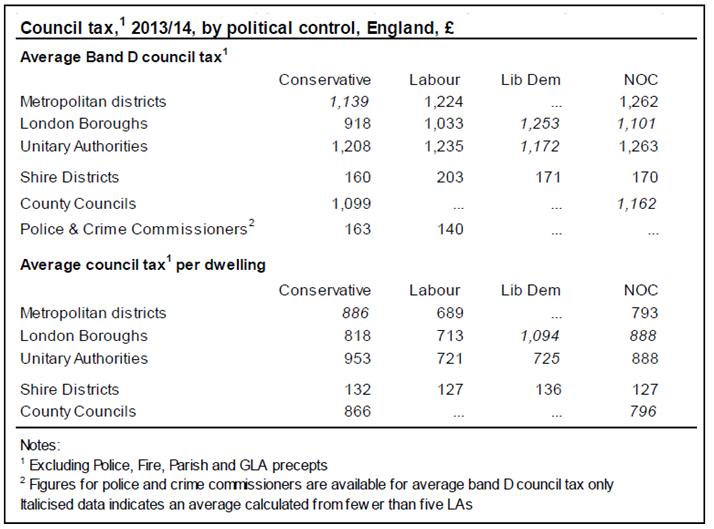
The parties have been playing this rather irritating game seemingly forever, and at one time it fell to party researchers or friendly academics to have to ascertain councils’ political control, decide whether it had been long enough to influence budgetary and tax policy, and produce the necessary statistics. In recent years, possibly irritated at hearing the same arguments repeated year after year, the estimable House of Commons Library staff (and notably Matthew Keep) have taken over, and a table on page 9 of the research briefing referred to above and reproduced here enable us, and, if they choose, MPs to compare the figures for ourselves.
game table apr 22

They show that, in all comparisons in which more than 5 authorities are involved, the average band D council tax is lower in Conservative-controlled authorities than in those controlled by Labour, the single exception being Police and Crime Commissioners, where the lower levels were set by Labour. But in all cases the average council tax per dwelling is lower in Labour-controlled authorities. It’s difficult to say just what, if anything, this proves, but it surely means that we need hear no more of these particular claims. In your dreams!

game

Chris is a Visiting Lecturer at INLOGOV interested in the politics of local government; local elections, electoral reform and other electoral behaviour; party politics; political leadership and management; member-officer relations; central-local relations; use of consumer and opinion research in local government; the modernisation agenda and the implementation of executive local government.
The 2013 local elections – a preview and protest

Over the next two weeks, the INLOGOV blog will be featuring a range of posts related to the local elections. Check the blog regularly for all the expert commentary, and follow us on Twitter to stay up to date.

Chris Game

There’s a view – shared by, among others, the Electoral Commission, the members of the 2007 Councillors Commission, and me – that voters’ lives would be easier and their turnout at least a smidgeon higher, if the 4-year cycle of local elections were uniform across the whole of England, and based on all-out or ‘whole council’ elections for all councils being held on the same ‘Local Elections Day’ (LED).

There could be one LED either every four years, or, if it were felt preferable, every other year: with LED1 being for voters to elect members of their ‘most immediate’ councils – districts, unitaries, London and metropolitan boroughs – and LED2 for those in two-tier areas to elect their county councils and the London Assembly. Neither LED would coincide and be forced to share the stage with a General or European Parliament election.

There would be several benefits. The election campaign, both by the political parties and in the media, would have to give greater attention than at present to local government issues and the performance of local councils and councillors, which should in turn raise the public’s awareness and understanding, and in some their inclination to vote.

Just as importantly, all voters in the same type of local authority would have the same number of opportunities to elect their councillors, and, even if they chose not to use those votes, they’d at least know each year whether they had a vote not to use. At present, voters in a district that elects its council by thirds, with elections in three years out of four, can have three times the number of voting opportunities as those in a neighbouring district with all-out elections. There seems, to me at least, something seriously unbalanced about a system of local democracy in which ministers think uniform frequency should apply to bin collection but not to voting opportunity.

End of protest (well, nearly), and time to look at what will be happening where on Thursday 2nd May. For this is the first in a short series of blogs by INLOGOV colleagues over the next fortnight or so on different aspects of this year’s local elections, and so will endeavour to set the scene. Which, in truth, really shouldn’t take that long, because there can rarely have been a local election year involving fewer local authorities.

Indeed, it takes almost as long to explain why this is, but, since it illustrates my case about the system’s pointless complexity, I’m afraid I’m going to – though I’ll let you off with England only. It has to do with the (usually) 4-year election cycles referred to above, in which 2009, 2013 and 2017 can be seen as the 4th years. In Year 1 – 2010, 2014 – we have elections for the met boroughs, who have to elect their councils by thirds; for the roughly one-third of unitary and shire district councils who have chosen to; for the London boroughs, who are required to have all-out elections; plus a few elected mayors. About 160 authorities involved in total.

Year 2 – 2011, 2015 – is the big year, when the national media have a better excuse than usual for pretending that local government is staging a mini-General Election for their benefit. We have the mets, all districts (even those choosing all-out elections can’t choose the year), most but not all unitaries (don’t ask – I told you it was designed to baffle), and a few more mayors. About 280 authorities in all. Year 3 should be a near-repeat of Year 1, with Londoners electing the Mayor and Assembly, instead of borough councils, plus, from 2016 and assuming they still exist, Police and Crime Commissioners.

And so we come to this year, Year 4, in which we have just the 27 remaining county councils, a few all-out unitaries, a couple of mayors, and a stray from Wales. And that’s it – not just in England, but in the whole UK. Which sounds as if it might represent something of a let-off for any party struggling in the opinion polls – but in this case it almost certainly doesn’t.

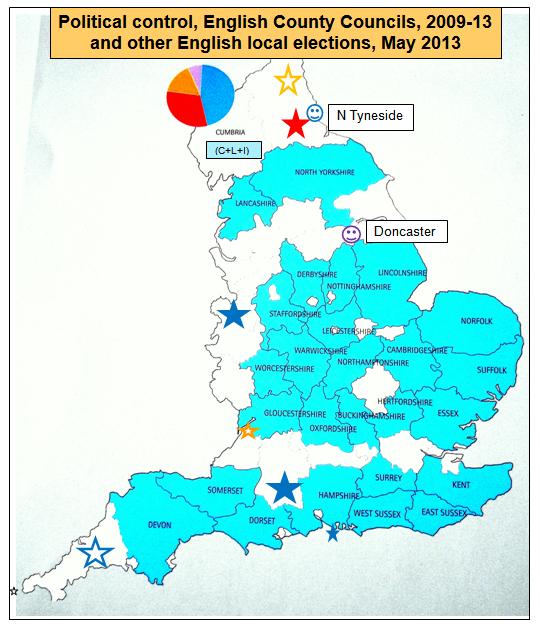
Although I do have, I promise you, several more artistic offerings on my office walls, on the door there hangs – courtesy of the Local Government Chronicle and the incomparable local elections experts, Professors Rallings and Thrasher – a poster mapping the political control of all GB councils. An inset map on the poster focuses solely on the county councils, and it seemed a good place to start.

game map apr 13

Ignoring the added symbols for the moment, this potentially multi-coloured map comprised, when it was produced at the start of the current political year, just the one colour – blue for Conservative majority control – and some white spaces. The latter, moreover, actually dilute the true extent of one-party domination among these big, upper-tier councils which, it should be remembered, are responsible for roughly 90% of local government revenue spending in their respective areas, compared to the 10% contributed by the 201 lower-tier districts. For, with one exception, the apparently blank spaces are not non-Conservative controlled counties, but single-tier metropolitan and unitary authorities. That exception, the one county where in May 2009 the Conservatives didn’t take majority control, is Cumbria, where they are comfortably the largest party but lead an interesting power-sharing administration of Conservatives, Labour and an Independent, with the Lib Dems in official opposition.

There is in fact now a second exception in Derbyshire. Labour-dominated since 1981, it was numerically the Conservatives’ narrowest capture in 2009, with 33 of the council’s 64 seats. In the past few months, though, they have lost that overall majority, with one councillor having to resign for unsavoury personal reasons and another switching allegiance to the UK Independence Party (UKIP). Not the best position from which to enter what was always bound to be an uphill battle to retain control.

Those 2009 elections took place when Labour’s standing nationally was about as low as it could get. The Government was in disarray, there were leadership plots against Gordon Brown, some ministers were in trouble over their expenses, others were resigning like proverbial rats from an apparently sinking ship – and that was in the week before the elections. In the pre-election opinion polls the Conservatives were 16 points ahead: 39% to Labour’s 23% and the Lib Dems’ 19%. As they generally do, the election results reflected the polls, and the Conservatives, already the dominant party in this tier of local government, gained blanket control by taking Derbyshire, Lancashire, Nottinghamshire and Staffordshire from Labour, Warwickshire from Labour minority control, and Devon and Somerset from the Lib Dems.

Today, the voting intention opinion polls are not quite as bad for the Conservatives as they were in 2009 for Labour, but they’re hardly encouraging. They show the Conservatives trailing Labour by about 11 points, with 30% to 41%, while their Lib Dem coalition partners are battling it out with UKIP on around 12%. I’ll be looking in more detail in a later blog at what these national standings and other considerations signal for actual changes in control among the counties, but I want to conclude this preview by mentioning the other elections that are taking place.

The added stars on the map identify the 8 unitary authorities holding elections. Five are from the most recent generation of unitaries and were until 2009 upper-tier county councils in the two-tier part of the structure. Their extraordinary scale – for what is the supposedly ‘local’ government in their areas – earns them the biggest stars on the map. Two – Shropshire and Wiltshire – are currently solidly blue for majority Conservative control, and Durham is equally solidly Labour. Labour also controlled neighbouring Northumberland for its last ten years as a county council, and must hope at least to regain its position as largest party and end the present minority Lib Dem administration. Cornwall’s last years as a county council were spent under majority Lib Dem control, but the Conservatives now lead a coalition administration with the Independents and may have their sights set on the overall majority that they’ve never so far achieved.

The Isle of Wight was also a county council until 1995 and also in its final years controlled by the Lib Dems. The party today, though, is reduced to just four councillors, and it is the Conservatives who have a majority. Bristol, even by UK standards, is an electoral oddity. The Council voted recently – to the relief of pretty well all concerned – to switch from election by thirds to all-out elections, coinciding with the election of the city’s mayor. But not, sadly, until 2016, which means that, for barely comprehensible reasons, it is the single authority this year to be electing only a third of its council. This necessarily restricts the scope for change, but there could still be sufficient for the Lib Dems to lose their minority control and for Labour to regain its position as largest single party.

All of which leaves just the odds and sods. The smiley faces on the map are the two elected mayors hoping for re-election, and there will be more about them in the next blog. The Welsh elections are for a new Isle of Anglesey council – postponed from last year, following a period in which the former council had to be replaced by appointed commissioners and a programme of recovery and democratic renewal undertaken.

And the barely visible little star off the coast of Cornwall is, of course, the Isles of Scilly. The 21-member, entirely Independent, council can legitimately claim to provide a range of services not just equivalent to but, as a surviving water and sewage authority, greater than that of any mainland unitary authority. They’re not, strictly speaking, a unitary, but they’re counted as one by the Office for National Statistics, and on St Mary’s at least, if not perhaps on all the ‘Off Islands’, they too will be voting on 2nd May.

game

Chris is a Visiting Lecturer at INLOGOV interested in the politics of local government; local elections, electoral reform and other electoral behaviour; party politics; political leadership and management; member-officer relations; central-local relations; use of consumer and opinion research in local government; the modernisation agenda and the implementation of executive local government.