The 13 NOC counties and unitaries: runners, riders and results

[This post, incorporating the final results, was updated by the author on 5th June 2013]

Chris Game

In May 2010 David Cameron and Nick Clegg took just five days to form their national coalition. By contrast, starting in June 2010, the Belgians took 18 months to form theirs. English local government falls between the two.

It’s well over a month now since the national media completed their coverage of the local elections. They’d added up the seats won and lost by the various parties, calculated the national vote share they’d have received if the elections had been held in different parts of the country, and how many seats they’d have won in a 2015 General Election – but they left as unfinished business the 13 county and unitary councils they conveniently lumped together in their tables as ‘NOC’ (No Overall Control). And, though it was a short sprint by Belgian standards, it took most of that month for most of us to learn, in several of these 13 cases, the answer to that basic question the elections were supposedly about: who will actually govern?

The reasons are various: more parties, plus variegated independents, involved in negotiations; party leaders losing their own seats, or having to be re-elected or deposed at party meetings; and, above all, the fact that any inter-party agreements can only be officially implemented at pre-scheduled Annual Council Meetings, which, in some of the affected councils, only took place in the last week of May.

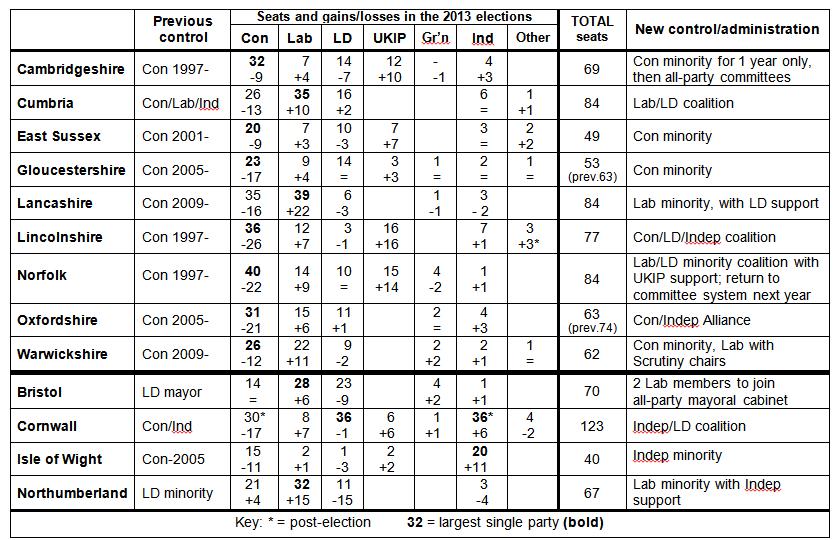
This blog attempts to fill in the gaps. It’s a kind of ‘runners and riders’ guide to the 13 county and unitary councils in which no single party has a majority of seats: how they got that way, and what subsequently happened.
game table june 2013

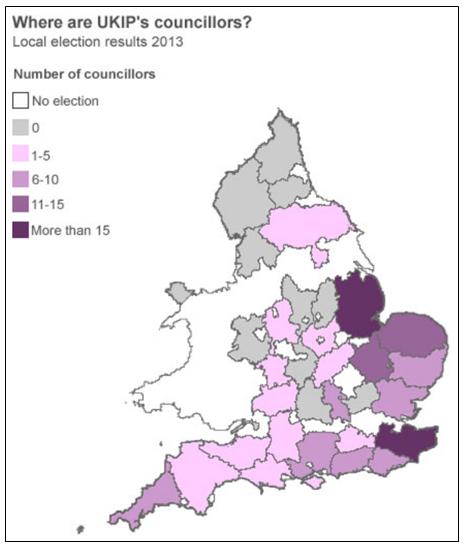
First, the counties, in alphabetical order. CAMBRIDGESHIRE, along with Lincolnshire, Norfolk, and to a lesser extent East Sussex, was one of the previously staunchly Conservative counties that became hung largely as a result of being UKIPped. As the BBC map shows, this was a much patchier experience than was suggested by some commentators at the time – with 7 of the 27 counties still having no UKIP councillors at all and only 4, all in the south and east, having more than 10.
game map may 17

Source: BBC News

The Conservative leader, Nick Clarke, was one of those who lost his seat to UKIP, and the party’s remaining 32 seats left them well short of a majority. The new leader, Martin Curtis, wanted to go it alone as a minority administration, but the Independents ruled that out, while Labour and the Lib Dems refused to join UKIP in supporting an Independent-led non-Conservative rainbow coalition. Eventually, the Conservatives got half their cake: Curtis will head a minority administration for 12 months, but then UKIP’s preference, for ‘opening up’ council decision-making, kicks in and cabinets will be replaced by all-party committees.

In CUMBRIA, previously run by a Con/Lab/Independent coalition, the elections effectively reversed the standings of the Conservatives and Labour, with the latter regaining their customary position as largest party, and the slightly strengthened Lib Dems in the role of potential kingmakers. Under a new leader, Jonathan Stephenson, they opted for coalition with Labour, deputy leadership of the council, and four cabinet posts.

EAST SUSSEX is a much smaller council than Cambridgeshire, but proportionately the party arithmetic is broadly similar. Here, though, the other parties seem readier to accept a Conservative minority administration, and, as in Cambridgeshire, although a Conservative-UKIP deal could have produced a majority, none appears to have been seriously pursued.

GLOUCESTERSHIRE was a hung three-party council from 1981 to 2005, with Lib Dems generally the largest group – before, in 2009, the Conservatives suddenly took 42 of the then 63 council seats. The reduction of 10 seats, accompanying boundary changes, and the prospect of at least some recovery by Labour and possibly the Lib Dems led close observers to predict a return to NOC, and they were right. The Conservatives, though, will continue in office as a minority administration, and the Lib Dems as the main opposition party, miffed reportedly at a suspected Con-Lab deal over Scrutiny Management and other committee chairs.

Meanwhile, the county’s badgers, temporarily reprieved last autumn from the Government’s planned cull, seem to have lobbied with some effect in the elections, the new council voting by 25 to 20 with 7 abstentions to oppose the cull, now due to start later this month.

In LANCASHIRE Labour either controlled the council or were the largest party from 1981 until 2009, and were hoping to regain majority control in one go. Sensing a lifeline, the Conservatives tried talking with anyone who might be interested in forming what would presumably be an anti-Labour coalition. But the Independents didn’t want an alliance with anyone and in the end the Lib Dems agreed to support a Labour minority administration – support that will include Labour’s budget, but not necessarily much more.

LINCOLNSHIRE Conservatives are unused to coalition politics, but the party’s leadership reacted quickly to the loss of nearly half its seats by negotiating a coalition deal with the Lib Dems and Independents, before the 16 new UKIP members could even elect themselves a leader. In the week they spent doing so, the party’s regional chairman pooh-poohed on their behalf any coalition with the Conservatives, and effectively condemned them to opposition from a starting point that might have yielded rather more. The Lincolnshire Independents group were also outsmarted – three of their number breaking away to join the coalition, one with a seat in the cabinet, with rumours that others could follow them into what is still a group-with-no-name.

Across The Wash, in equally traditionally Conservative NORFOLK, the outmanoeuvred group were the Conservatives themselves. At a full council meeting, the party’s re-elected leader, Bill Borrett, apparently thought he had an agreement with the Lib Dems at least to abstain in any vote, thereby enabling him to head a minority Conservative administration. He hadn’t, and nor was he able to nail down a more explicit coalition agreement with the Lib Dems involving some key specified posts. By far the largest group thus finds itself in opposition to a minority coalition of Labour and the Lib Dems based on just 29% of council members.

UKIP’s 15 votes were needed to get this deal off the ground – plus support from the Greens and an Independent – and the UKIP group describes itself as part of the coalition. That part, though, involves no cabinet seats, but rather the achievement of a Cambridgeshire-style agreement to abolish cabinet government and return to a committee system this time next year.

Before the Conservatives swept into power in 2005, OXFORDSHIRE had been a hung council for 20 years. Labour’s comeback was limited, and, on a now a significantly smaller council, the Conservatives finished within one seat of retaining their overall majority – a position they’ve restored thanks to a CIA: a Conservative/Independent Alliance probably less alarming than it initially sounds. No cabinet seats are involved, but three Independents have agreed to work with a Conservative minority administration in the kind of ‘confidence and supply’ arrangement that many thought was as far as Cameron and Clegg would dare to go in 2010, and indeed to which they may still, before 2015, conceivably turn.

In WARWICKSHIRE Labour, though never the majority party, have regularly run the council as a minority and were hoping to regain this position. They didn’t, but they did do a deal with the Conservatives, the outcome being a Conservative minority administration, headed by the council’s first woman leader, Izzy Seccombe, with Labour holding the Scrutiny chairs, and the Lib Dems and Greens out in the cold, complaining of a stitch-up.

Now to the four hung unitaries. In BRISTOL Labour became again the largest single party and has agreed that two of its members should join Mayor George Ferguson’s all-party cabinet, which will now comprise 2 Labour members, 2 Lib Dems, I Conservative, and I Green. That may sound straightforward, but it most certainly wasn’t. Last November a similar proposal, though supported by Labour councillors, was overruled by the local party and eventually by the National Executive, and had cost the group its leader, Peter Hammond. It seems a sensible decision, but it would be surprising if that sentiment were shared universally within Labour circles.

In CORNWALL, as in Lincolnshire, some candidates continue running around long after the electoral music has stopped. Here, one of the elected Conservative members defected after 10 days to the Independents, bringing the latter group up to parity with the Lib Dems. This proved, though, less crucial than it might have, as both groups were already in discussions over some form of agreement – one possibility being an all- or multi-party rainbow alliance that could be presented to the public as a ‘Partnership for Cornwall’. What actually emerged was more mundane: an Independent/Lib Dem coalition with the more or less positive support of Labour, UKIP and Mebyon Kernow (the Party for Cornwall), the Conservatives having rejected as tokenism a scaled-back offer of two cabinet seats.

The ISLE OF WIGHT was once a Lib Dem showcase, controlled by the party either as a majority or in coalition for 16 years until 2005. It seems like history now, though, and this year’s election was largely about the exchange of seats between the Conservatives and Independents – the latter at least slightly helped by Labour and UKIP not contesting every seat that they might have done. The Island Independents, led by Ian Stephens, one of the possible beneficiaries of these arrangements, took over as easily the largest group, and will run the council as a minority administration – for the first time since 1973-77.

Having dominated the former county council, Labour will run unitary NORTHUMBERLAND for the first time as a minority administration, with the support of the three Independents – one of whom will be back as Chairman of Audit, the post she held as a Conservative councillor before resigning from the party following alleged victimisation by a senior colleague. And to think, there are some who say the local government world is boring.

game

Chris is a Visiting Lecturer at INLOGOV interested in the politics of local government; local elections, electoral reform and other electoral behaviour; party politics; political leadership and management; member-officer relations; central-local relations; use of consumer and opinion research in local government; the modernisation agenda and the implementation of executive local government.


Why don’t people vote?

David Craven

In an event that could be completely predicted, last week’s local elections have seen an average turnout of between 30% and 35%, almost unchanged from last year’s. The now-traditional question of why people do not vote in local elections will be asked once again.

There is a stunning lack of knowledge about local politics. Almost nobody knows to which party their councillors belong, never mind their names. I asked a few people here in Birmingham, all of whom regularly vote in local elections, and most weren’t sure how often elections take place, how many candidates per ward there are, or even which party is in control of the city council. (The trick question was when I asked whether they planned to vote in this year’s election: there are no elections in Birmingham this year, but nobody knew this). This admittedly unscientific straw poll reinforces what is a common belief, that local elections simply aren’t important in most people’s minds, at least important enough for people to know things about them.

There are other posited explanations: a more mobile workforce means that people are less likely to take an interest in local politics; the fact that local politics is more widely considered to be corrupt or more wasteful than national politics; the safe-seat situation depressing the belief that a person’s vote actually counts for anything. Everyone has their own reasoning, and there have been many things written both in academia and in the media.

One way we can try to see whether these reasons are factors is by-elections. If people voted based on perceived importance of the elections then by-elections should see similar numbers of people turn out to vote: the reality is very different. It is rare for more people to vote in by-elections than in the previous general election, with only fourteen British by-elections having increased turnouts since 1945, compared with the same number of British by-elections taking place in the current parliament alone. In those latest elections, turnout was down by about 20% on the general election, bringing it to an average of 37.2%, a typical local election turnout in recent times. In case one thinks this is a fluke, turnout during the previous parliament in by-elections was down by 15% on the previous general election.

My personal theory is that it is media coverage, or rather the lack thereof, that influences whether people vote. Before a general election there is near-blanket coverage, ensuring that everyone knows about the election, knows when it is, and has some idea of what the main parties claim to want to do should they be elected. Before a local or European election, however, there is very little in the way of media coverage from the national television networks, the source of most of the nation’s news, and believed by people to be the most trustworthy. The local newspaper industry is dying quicker than the national newspaper industry, and local television is consistently unwanted (although that isn’t stopping the government from trying again, so there is no real help from these quarters. The national media are neither interested nor really able to focus on local issues, and these issues become marginalized. Faced with a dearth of information and a lack of interest from others, we stop considering local elections, European elections, by-elections, and so on, and they do not even register in our minds. This third of the population that votes in general elections but not local elections suffer from a kind of local disenfranchisement, where they do realize that they should vote, but the reasons seem to get lost when they need to vote for something that doesn’t appear in the headlines on TV.

I’ll finish with one more possible reason: what if the general election fills many people with a spirit of camaraderie, that the country is going out to choose a government? If that’s the reason that some people vote only in general elections, then it will be very difficult to convince them otherwise.

craven-david

David Craven is a Royal Society Research Fellow and Birmingham Fellow in the School of Mathematics at the University of Birmingham. His interests are primarily in mathematics, although branch out into chemistry and social choice theory.

UKIP exceeds expectations but what do the results tell us?

Karin Bottom

It is now clear that UKIP exceeded most expectations in the local elections on May the 2nd, garnering around 26 per cent of the vote. Yet as the dust settles, we must now ask what these results mean? Of course, at this stage it is hard to be sure and a certain amount speculation is involved but one thing is clear, the mainstream has a fight on its hands.

To label UKIP’s support as mere articulation of protest is naive, simplistic and lazy. More to the point, the ‘protest label’ implies that any vote for parties outside the mainstream – whatever their hue – is pathologically wrong and requires correction: this is not healthy analysis. While a number of voters may well be sending a message to their usual party of choice or just the ‘big three’ in general, a proportion of the population does appear to support UKIP and what it stands for. The sentiments which underpin much of the party’s support are also hard for the mainstream to swallow, particularly on the left and though all three are beginning to see the bigger picture and respond, they can’t escape from the fact that they are all linked with the problems the country faces right now: Labour is seen as responsible while the Conservatives and Liberal Democrats are denigrated for not reversing the situation. UKIP on the other hand claims to offer the electorate solutions and has no track record of failure, a very attractive quality which – given the right circumstances – can facilitate substantial success.

Yet, perhaps the most interesting questions concerning UKIP ask, what is it exactly? Is it a pressure group or is it a party? Hitherto labelled as a single issue organisation it has never shied away from its long-term key objective which is a retreat from the European Union. Recently though, it has expanded its arguments, rhetoric and goals. Initially marketing itself as a force for change, it now seems to hold a somewhat longer term view of its future.

Before the count was in, Farage’s discussion with Evan Davis on Radio 4’s Today Programme was particularly revealing when he when equated UKIP’s potential for bringing about change with that generated by the SDP’s success in the early 1980s. He argued that UKIP now has the capacity to be part of the political solution and this suggests that the party is developing in a new direction: indeed, the BBC’s Nick Robinson now argues that UKIP has made the transition from pressure group to political party. Only time will tell if this is the case but one thing is for sure, speculation and judgment of UKIP will only intensify.

Next year’s elections to the European Parliament and the 2015 General Election will certainly go some way in establishing the nature of UKIP and the type of organisation it really is; but in the meantime, its message is resonating with a sizeable proportion of the electorate and the mainstream is not sure what to do.

bottom-karin

Karin Bottom is Lecturer in British Politics and Research Methods at INLOGOV, University of Birmingham. Her core research areas comprise parties (particularly small and the BNP), party systems and party theory. She is particularly interested in concepts of relevance and how national level theories can be utilised at the sub-national level.

Elected Councillors: How much influence and power are they able to exercise?

John Raine

What might we expect of the county councillors we elected yesterday? Will those elected be able to implement the various initiatives they have pledged in their campaigns? In this respect, we might reasonably be a tad sceptical for a number of reasons.

First, councils no longer occupy the core local policy-making role of previous times. Nowadays there is more emphasis on multi-agency partnering in local public policy-making so that key matters are often decided in conjunction with other local public, voluntary and private sector organisations. While this may be beneficial in ensuring more ‘joined up’ public services, without doubt it has weakened the power and influence of elected councillors.

Second, the ‘cabinet’ model, introduced a decade ago, under which an elite group of councillors lead on policy-making, has also disempowered other councillors. While some can be influential internally on scrutiny committees reviewing policy and holding the cabinet members to account, many others act mostly as ward representatives and without much opportunity at all to contribute to decision-making.

Third, many of the services are now provided as ‘shared services’ with neighbouring councils and other local public organisations; others have been contracted out or are tied up in long-term public-private-partnership arrangements. While this may have reduced costs, it has also become more difficult for individual councillors to be influential in relation to those services since any proposed changes have to be re-negotiated with other partners and may involve complex contractual issues that are expensive-to-unpick.

Fourth, the move by councils to establish front-line, multi-service, ‘customer contact centres’ and public websites that not only provide information but also allow the public to interact directly, e.g. reporting maintenance and other problems, has diluted the role of the councillor as conduit to getting matters remedied. Indeed, in the digital era of sophisticated telephony and CRM systems, the elected councillor may well be last to learn about the problems that previously they might have championed on behalf of the public.

Fifth, the on-going austere financial climate facing councils means that there are generally less resources for new initiatives unless there is the prospect of efficiency improvements and financial savings in return. Moreover, lack of money provides a convenient excuse for the political leadership and officers to say ‘no’ to other councillors whose ideas happen not to find favour.

Overall, then, one might conclude that, despite all the rhetoric from government about ‘localism’ and about the empowerment of councillors as community leaders, the power and influence of those we eleced yesterday to make a significant difference will unfortunately seem quite limited. But candidates for councillorship should not be deterred; ‘where there is a will there is a way’! And for those elected and with sufficient commitment and determination to confront the obstacles and to press their cases for change effectively, there is certainly much to be done to make councils work better and more for the benefit of those they represent.

raine

John Raine is Professor of Management in Criminal Justice at INLOGOV. He has been involved in criminal justice research, consultancy and teaching at Birmingham for some twenty-five years and has a strong track record of commissions for the Home Office, Lord Chancellor’s Department/Department for Constitutional Affairs/Ministry of Justice on aspects of policy and practice within the criminal (and civil) justice sectors.

Thursday’s local elections: Catzilla and the county councils

Chris Game

I really wish sometimes – OK, occasionally – that I still did my British Government undergraduate lectures. This would be revision season, with lectures atypically well attended, by previously unseen students hoping for hints about exam questions. And there’d be the local elections, and the opportunity to point out once more that, as students, many of them could not only register twice, at home and at their term-time address, but also in these elections vote twice – and try to persuade them to do both at least once.

It’s not easy. Post-election opinion polls tell us that in the 2010 General Election, for example, 56% of 18-24 year olds didn’t vote, compared to 35% of all electors and only 24% of over-65s. They don’t usually tell us, though, that most of those 56% couldn’t vote, because they weren’t even registered. The Electoral Commission can, though, and their statistics on the inaccuracy of electoral registers are alarming. Using known population growth rates, the Commission reckoned the April 2011 registers, showing an electorate of around 45 million, were 15% inaccurate, that at least 6 million people in GB were unregistered, and among 17-24 year olds the non-registration rate was 44%.

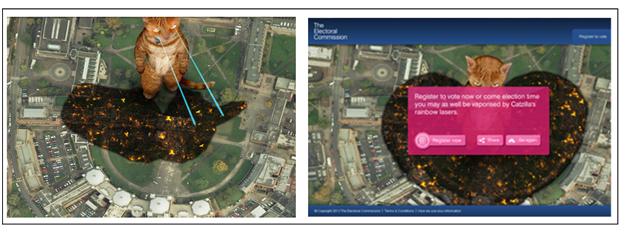
The Commission runs regular campaigns to promote registration, this year’s being clearly aimed at these elusive young people. I’m not sure about its effectiveness, but I’d certainly use it, and I can recall few visual aids of whose student appeal I would be more confident. ItsYourVote is a website whose home page comprises a satellite image of the UK, and a warning that “Without a vote, you have no say in what happens in your local area”. To learn what fearful fate that might be, you enter your postcode, whereupon the satellite homes in and you discover that, should you fail to register, “come election time, you may as well be vaporised by Catzilla’s rainbow laser eyes”, or possibly seized by a massive disco fairground grabber, or swept up by a giant ice cream scoop.

catzilla
Source: ItsYourVote

The Daily Mail thinks the website “absurd” and an appalling waste of public money. But I fear it misses the subtlety. While obviously the ice cream scoop is a bit silly, you can see that Catzilla, though provoked by the under-registration of Birmingham University students, has been impressively selective in his vaporisation of our Edgbaston campus – wiping out the Law faculty and the entire University administration, but leaving untouched, for instance, the Muirhead Tower and my civic-savvy, fully registered INLOGOV colleagues.

As it happens, the Commission’s efforts would be wasted on most of our students this year, for, as noted in my elections preview blog, this is the one year in four when the metropolitan boroughs like Birmingham, along with most unitary authorities and shire districts, don’t elect any of their councillors. This leaves just 37 councils in England plus one in Wales holding any kind of local elections this week, and, with that first blog having at least briefly covered those in the 8 unitaries and the mayoral elections in Doncaster and North Tyneside, the remainder of this one will focus on the 27 county councils.

They were previously elected in 2009, when Labour’s standing in the opinion polls was desperate – 16% behind the Conservatives, at 23% to 39%, with the Liberal Democrats on 19%. Reflecting those figures, the Conservatives, the dominant party anyway in this tier of local government, won nearly nine times as many seats as Labour – 1,261 to 145, with the Lib Dems taking 346 – and took majority control of every one of the 27 councils except Cumbria, where they became the leading party in a Conservative/Labour/Independent coalition.

2009 is therefore the baseline against which to assess the prospects and eventual performance of the various political parties, whose standings in the polls today are, of course, dramatically different. In this week’s Sunday Times YouGov poll, Labour have a 9% lead (40% to 31%) over the Conservatives, with the Lib Dems and UK Independence Party (UKIP) level on 11%, and the Greens on 3%. These figures indicate a Conservative –> Labour swing of nearly 13% since 2009, and no swing at all between the Conservatives and Lib Dems. It’s a blunt measure, but about the best we have for assessing the electoral chances of the major parties.

In the same poll, incidentally, UKIP leader, Nigel Farage, gets a higher rating as a party leader – 44% saying he’s doing a good job – than Cameron (36%), Ed Miliband (29%), or Nick Clegg (21%). Partly because of headlineable findings like these, and partly because they are a real, but unpredictable, threat to all parties in these elections, UKIP have, as Karin Bottom noted last week, been attracting the bulk of media attention. In terms of seats, though not councils, gained, they will undoubtedly be among Friday’s winners – indeed, it’s about the one knowable thing about them – but mainly because they’ve virtually nothing to lose.

UKIP like boasting of their “army of councillors sitting on borough, town, county and parish councils across the UK”. This army, though, would make Gideon’s little band of soldiers that took on the Midianites seem like a legion. In fact, its massed ranks contain just over 100 town and parish councillors (out of 75,000) and about 30 on principal authorities – including 11 (out of 1,800+) on county councils. And there’s a similar economy with the truth in its manifesto claim that “where UKIP is in charge of local government, we use that power to cut costs … we believe that council taxes should go down, not up”. Back on Earth, the only local government of which UKIP has ever had charge is Ramsey Town Council in Huntingdonshire, Cambs., and since taking ‘power’ in 2011 they have ‘slashed’ the council tax precept by +28%, from £42.56 on Band D to £54.61 in 2012-13.

Council tax rates are, quite properly, a big issue in these elections, but hardly a straightforward one. First, Coalition Government ministers have from the outset done their utmost to set – that is, freeze – all councils’ tax and spending totals themselves, by bribing them with limited and potentially disadvantageous freeze grants. Second, it is the districts, not the county councils being elected this week, who are the billing authorities who will have sent out the bills and be trying to collect the taxes, even though it’s the counties who do about 90% of the actual spending.

Third, this year, although almost all counties obediently accepted their one-off grant deals and froze their tax precepts, well over a third of the districts refused them and raised their tax bills – more than half of whom were Conservative-controlled. So, does a voter in one of these ‘naughty’ districts, urged by David Cameron to vote Conservative for lower council taxes, punish the council that raised its tax or reward the county that didn’t?

It’s nothing like as simple as, for instance, street-lighting. It’s not, perhaps surprisingly, a statutory obligation for any council, but, if your street lights are being dimmed or switched off in the interests of economy, it’s almost certainly the county who control the photo-electric timers. So, either way, if you approve of the cost and carbon savings, or disapprove of jeopardising safety and security, you know how to vote.

So how many of the 27 counties, all Conservative today, will be differently controlled come Friday? In Cumbria, the one that half got away in 2009, Labour in recent years has usually had a plurality, if rarely a majority, and will be looking to regain that position of largest single party. However, a Conservative Police and Crime Commissioner (PCC) was elected in November, and, as elsewhere, Ed Miliband’s claim to be “fighting for every vote” is undermined by the party fielding 14 fewer candidates than in 2009, while Greens are up from 15 to 31, UKIP from 4 to 52, and, in another sign of the times, the British National Party (BNP) down from 41 to 9.

While becoming largest party may be fine in Cumbria, in the four councils Labour held virtually uninterruptedly from 1981 until 2005, anything short of winning back majority control will surely count as failure. Derbyshire was numerically the Conservatives’ narrowest capture, with 33 of the council’s 64 seats, and they have already lost that overall majority, with one councillor having to resign for unsavoury personal reasons and another switching allegiance to UKIP. Even a modest swing should do. Nottinghamshire is much trickier, for in 2009 Labour lost seats variously to the Conservatives, the Lib Dems, UKIP (in Ashfield), and assorted Independents, especially in Mansfield. A straight swing of even 10% from the Conservatives might not be enough, but a repeat of those with which they won by-elections in Worksop and Rufford certainly would. In Lancashire too Labour need almost to reverse the trouncing they suffered at the hands of all parties, including the Greens and BNP. A 5% swing from the Lib Dems in Burnley, where they have already won back one seat in a by-election, and a 10% swing from the Conservatives elsewhere should do it – even without ousting the notoriously independent Idle Toad, Tom Sharratt, from his South Ribble fastness.

If Lancashire was a trouncing, Staffordshire was a bloodbath, from which Labour crawled out with just 3 of its former 32 seats. With nearly two-thirds of divisional boundaries having been changed, it is difficult even to assess the scale of the task of regaining majority control from such a tiny base, the most promising guide being perhaps the results in the three districts that held elections last year. In both Cannock Chase and Newcastle-under-Lyme Labour took majority control of the council by gaining a total of 15 seats from the Conservatives, Lib Dems, and in Newcastle also from UKIP. In Tamworth too they won seats from the Conservatives, and across the three councils there was an average Conservative –> Labour swing since 2009 of 14%, which, repeated on Thursday, would indeed have been sufficient, without boundary changes, for Labour to reverse the horrors of 2009. In November, on the other hand, the electorate – or a very small portion of them – preferred a Conservative PCC.

Had the Lib Dems gone into opposition in 2010, rather than national coalition, they too would be aiming to regain the councils they lost in 2009: Somerset, Devon and, although it became a single-county unitary at the same time, Cornwall. But two years of depressing opinion polls and local election results are taking their toll, and Devon, for example, seems to be one of several counties in which UKIP candidates will outnumber Lib Dems. Indeed, Ilfracombe, in Lib Dem hands for years, appears to be being surrendered without even a defence.

Somerset, where almost all contests are between the Conservatives and Lib Dems, and the latter were in majority control for most of the period between 1993 and 2009, is a much stronger prospect. Again, extensive boundary changes make projections difficult, but even a 5% Conservative –> Lib Dem swing on existing boundaries would be enough for the Lib Dems to regain control. But, as noted above, there’s been no perceptible swing at all, and the easy victory of an Independent in the Avon & Somerset PCC election may suggest that this is particularly promising territory for independents and smaller parties.

As for the rest, it might seem that in these uncertain times, if a case can be made for Staffordshire being recoverable by Labour from a councillor base of three, almost anything is possible. Well, yes – but realistically, even a really good result for Labour would probably be limited to depriving the Conservatives of their overall control in a few more councils. One could be Warwickshire, which, as a minority administration Labour have run for longer in recent years than have the Conservatives, and another Northamptonshire, one of apparently a small handful who are all claiming to have “the lowest council tax set by any of the 27 shire counties in England”.

Clearly they can’t all be right, and, this being an academic blog, I feel it’s appropriately pedantic to close by citing the relevant House of Commons note reporting that Northamptonshire’s Band D equivalent precept of £1,028.11 is in fact only third lowest, behind Staffordshire (£1,027.25) and Somerset (£1,027.30).

game

Chris is a Visiting Lecturer at INLOGOV interested in the politics of local government; local elections, electoral reform and other electoral behaviour; party politics; political leadership and management; member-officer relations; central-local relations; use of consumer and opinion research in local government; the modernisation agenda and the implementation of executive local government.