The Road to A Soft Brexit

Jon Bloomfield

The election result has been a game changer. The electorate has turned down the Theresa May/Daily Mail offer of a hard Brexit and the threat of walking away from the negotiations with the European Union. The issue did not get the in-depth discussion during the election that it should have, but the result is a rebuff to Mrs. May and all her Government Ministers claiming that ‘no deal is better than a bad deal.’

The new parliamentary arithmetic means that the road is now open to negotiate a soft Brexit. That means accepting the result of the 23rd June referendum but recognising that for reasons of economics, geography, history and culture a close working partnership between the UK and the Continent is in the interests of both parties. Hence, the UK should seek a partnership and cooperation arrangement with the EU across a whole range of areas – the economy, security, culture, the environment, research – where the UK has vital interests with our closest neighbours.

Furthermore, events are pushing the EU as well as the UK in that direction. Firstly, after the latest terrorist horrors in Manchester and London, who is seriously going to suggest that the UK should pull out of its intelligence sharing and security cooperation with European police and counter-terrorism services? A handful of little Englander ideologues will object to UK cooperation because it is overseen by the European Court of Justice but that will not resonate on many doorsteps. Secondly, the disastrous performance of President Trump in Saudi Arabia, at NATO and the G7 has given renewed momentum to the desire amongst European leaders for greater self-reliance. The swift declaration with the Chinese government upholding their joint commitment to the Paris agreement on climate change after Trump’s announcement of US withdrawal is an early example. Thirdly, the election of Emmanuel Macron as the new French President adds a powerful, new political figure pushing for collective action at the European level.

Until now the main political obstacle has appeared to be migration. The May government has argued that the UK must pull out of the Single Market and the Customs Union because membership of either is incompatible with the UK controlling its own migration policy. This view is regularly echoed by EU leaders and Commission President Juncker who talk about Single Market membership requiring adherence to the four principles of the Treaty of Rome, including the free movement of labour. Yet the way to combine a migration policy that is fluid enough to preserve economic dynamism and rigorous enough to inspire public confidence lies in articles 48 and 49 of the original treaty of Rome. Article 48 states that “freedom of movement for workers shall entail the right (a) to accept offers of employment actually made; (b) to move freely within the territory of member states for this purpose.” Article 49 calls for “the achievement of a balance between supply and demand in the employment market in such a way as to avoid serious threats to the standard of living and level of employment in the various regions and industries”.

In other words, these have to be managed processes. The treaty is not a neoliberal free for all. Freedom of movement is specifically tied to agreed, contracted employment and recognises the need to balance labour supply and demand. Here is the basis for a serious negotiation between the UK and the rest of the EU.

Importantly, this is the view of Jean Pisani Ferry, the author of Macron’s Presidential policy programme and now his chief economic adviser. Nine months ago Ferry wrote a pamphlet for the influential Breughel think tank with four other senior EU policy makers entitled Europe After Brexit. The authors argue that in an increasingly volatile world, neither the EU nor the UK have an interest in a divorce that diminishes their influence, especially as the balance of economic power shifts away from the North-Atlantic world. They propose a new form of collaboration between the EU and the UK, a continental partnership which would consist of participating in the movement of goods, services and capital and some additional labour mobility, as well as in a new system of inter-governmental decision making and enforcement of common rules to protect the homogeneity of their deeply integrated economies. On migration, the Brueghel authors see it primarily from a functional, economic rather than constitutional/political viewpoint. Hence managed labour mobility is required for the interdependent parts of the European economies to function smoothly and to enable firms to transfer staff to other countries easily, but there is no legal necessity for unrestricted labour mobility. Ferry’s co-authors are policy and political heavyweights including Norbert Röttgen, the Christian Democrat Chairman of the Foreign Affairs Committee of the German Bundestag and Andre Sapir, an adviser to two previous European Commission Presidents. Thus, there is intellectual heft behind the case for pursuing a managed migration policy within the framework of the Single Market. Currently, the 10,000 lorries a day that pass through Dover are the most visible indicator of how interdependent the UK and Continental economies have become. That is why it is so crucial to both the UK’s and Europe’s economic well-being that this tariff-free, seamless trade is retained. There is a viable political path here for a soft Brexit and now there is also a window of opportunity.

Throughout the election Jeremy Corbyn’s team took the political initiative. He should keep this momentum and bring the new parliamentary arithmetic to bear. For starters, his Labour negotiating team should:

* bring together all MPs regardless of party who want to pursue the soft Brexit option. They should re-draft the terms of the UK negotiating position and seek to win Parliamentary approval for it.

* open informal discussions with Pisani Ferry in France, Röttgen in Germany and other key players across Europe.

Calls for a second referendum are dead. They hampered both the Liberal Democrats and the SNP in the election. But what is on the cards is the negotiation of a proper, collaborative partnership with the EU. It will be complicated and difficult but the opening is now there. Can a progressive alliance come together to take it?


Jon Bloomfield is an Honorary Research Fellow at INLOGOV and an expert on EU funding, European and EU issues of regional and local government who carries out research on the EU and contributes to INLOGOV’s post-graduate programmes.
The forgotten local elections – Conservatives defied predictions here too

Chris Game

You’d not have known it from the national media, either before Election Day or since, but the 650 parliamentary contests weren’t the only ones taking place in the UK last Thursday. It was the year in local government’s four-year election cycle that almost all English district and unitary councils – 279 of 293 – had elections, and there were votes too for six mayors, for many parish and town councils, plus the odd local referendum.

There were no council elections in London, Scotland or Wales, but English voters – many doubtless to their surprise – were confronted by up to five ballot papers. Those in Bedford, for example, had votes for an MP, a mayor, two borough councillors, up to 11 parish councillors, and a referendum on their Police and Crime Commissioner’s proposal to increase Council Tax – the first ever of its kind. The proposal – specifically for a 15.8% increase in the Police and Crime Commissioner’s portion of council tax – was rejected by nearly 70% to 30%: Yes 91,086; No 207,551.

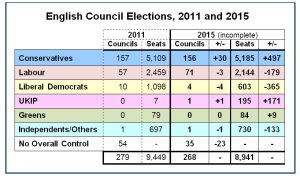
These multiple ballots offered electors the obvious opportunity for split-voting: one for their MP or national government, and another more personal, local or protest vote. Minor parties and independents in the council elections could be expected to be chief beneficiaries, but, as shown in the nearly complete results table, that was another ‘expert’ prediction largely confounded.

Blog 11th May

9,500 local elections are even trickier to predict than 650 parliamentary ones, and few are daft or brave enough to try. Those who do will start from the baseline of four years ago – 2011 here – when these actual seats were last fought, compare that year’s results with current national opinion polls, and hope.

2011 was surprisingly good for the Conservatives, a year into their far from popular Coalition with the Liberal Democrats. They gained votes from disaffected Lib Dems, and the coinciding electoral reform referendum galvanised their own supporters. This time, though, the national election effect was expected to boost the turnout of Labour and Lib Dem voters.

The poll standings of both main parties had dropped significantly since 2011. But, with the Conservatives the more damaged by UKIP’s dramatic rise, and defending twice as many seats as Labour, the latter was predicted to make most net gains, with the Lib Dems not suffering “too badly” in losing perhaps “around 50 seats”.

If these predictions echoed those for the General Election, then so did the outcome. The Conservatives were unambiguous winners of these local elections, Labour not just net, but absolute, losers, and the Lib Dems suffered as painfully as they did nationally.  UKIP made progress, but less than it hoped, and the Greens flatlined.

For the Conservatives, their more than 30 gains – mostly, it should be noted, councils previously under arithmetically No Overall Control – will take the local headlines. Two particularly satisfying results, though, will be the retained control in their only two metropolitan boroughs – Solihull and Trafford – both with additional seats. Solihull Greens lost a seat, but, with the Lib Dems losing two, they are still the official opposition.

Conservative unitary council gains include Basingstoke & Deane, Poole, and Bath & North East Somerset, where there are now two Greens, but 14 fewer Lib Dems and a first-time Conservative majority. Districts won include traditionally Independent Babergh, Suffolk, also for the first time in its 41-year history; Amber Valley, Gravesham and North Warwickshire straight from Labour; Hinckley & Bosworth from the Lib Dems; Gloucester, St Albans, Scarborough, Winchester, and Worcester.

Further Labour losses to No Overall Control included Walsall metropolitan borough and the unitaries, Plymouth and Stoke-on-Trent. There was a little compensation perhaps in hanging on to a knife-edge majority in Bradford, thanks to Independents, UKIP and Respect all losing seats, and gaining majorities in unitary Stockton-on-Tees, and, after a suspended recount and overnight rest, Cheshire West & Chester.

Labour is also now largest party on Brighton & Hove council, since 2011 the UK’s first to be run by the Greens. As in the General Election, the Greens’ recent membership surge didn’t really translate into hard results, though they will be encouraged by seven gains in Labour-dominated Bristol, bringing them within touching distance of official opposition.

This time UKIP was the history maker. UKIP leader Nigel Farage had failed to become Thanet South’s MP, but his party reduced Thanet district’s Labour councillors from 24 to 4 and, with 33 of its own, won overall control of its first principal council.

Good Lib Dem news was at a premium all weekend, but enough of Bedford’s conscientious voters gave their mayoral ballot paper X to Lib Dem Dave Hodgson to re-elect him comfortably for a third term as the borough’s mayor.

In other mayoral votes, Peter Soulsby was re-elected for Labour in Leicester, Gordon Oliver for the Conservatives in Torbay, and Mansfield’s three-term Independent Tony Egginton was succeeded by his Mansfield Independent Forum colleague, Kate Allsop.

Another Independent, Mike Starkie, was elected as the first mayor of Copeland in Cumbria, while in Middlesbrough three-term Independent Ray Mallon has retired and is replaced by Labour’s Dave Budd – though only after a second preference count and the rejection of large numbers of spoilt ballots, presumably from the many Labour members who, despite the result, want the mayoral system abolished.

In these mayoral elections at least, then, there’s something for almost everyone: Labour, Conservative, Lib Dem, and Independent.

Chris Game - pic

Chris Game is a Visiting Lecturer at INLOGOV interested in the politics of local government; local elections, electoral reform and other electoral behaviour; party politics; political leadership and management; member-officer relations; central-local relations; use of consumer and opinion research in local government; the modernisation agenda and the implementation of executive local government.

Make elections work for you: check the polls, but follow the money

Chris Game

Spoiler alert: this is a blog about elections, but not local elections – mainly because it’s about election betting, and, with one conspicuous exception, which will be mentioned, our modern-day local election contests and candidates are rarely of sufficiently general interest to attract much serious fixed odds betting.

My prompt was the Conservatives’ recourse to their apparently hastily conceived Campaign Plan C – following the failures of A: negative, personal and increasingly counter-productive attacks on Ed Miliband; and B: daily, unexplained and increasingly implausible financial treats for everyone from NHS patients and rail users to volunteers and better-off housing association tenants.

Plan C involves drawing on – or alarmingly, in the latter case, ‘weaponising’ – the proven, if contrasting, electioneering skills of famous grey man, soapbox campaigner and former PM, John Major, and safe seat candidate and London Mayor, Boris Johnson.

Let’s start with Johnson, the opening paragraph’s ‘conspicuous exception’. You can currently get odds of 33/1 both on his being the next London mayor and next Deputy Prime Minister, and a very short 1/50 on his becoming MP for Uxbridge and South Ruislip – which in itself gives a small hint of the huge growth in recent years of so-called novelty betting in general and political betting in particular.

We wagered over £1 million on Prince George’s arrival in 2013 and could well top that this time. Current shortest odds are on a blonde female, eventually named Alice, born on April 25, with 50/1 on triplets and 1000/1 on the hapless infant being named Boris. But royal births are peanuts compared to political betting. Bookies reckon we laid out £30 million on the 2010 election, £50 million on the Scottish independence referendum, and predict this election will be the first UK non-sports betting event to break £100 million.

With William Hill’s taking bets online of £200,000 and over the counter of £50,000 on a hung parliament – at 2/9 and 1/8 respectively – it suggests some clearly see it as an easy earner, and they could be right. The odds on these big bets may be short – £50,000 at 1/8 would win just £1 for every £8 staked, or £6,250 plus the returned stake. But that doesn’t necessarily make them unattractive compared, say, to the 8/1 (£8 for £1 staked) you could get on an improbable coalition involving the Scottish Nationalists.

The attractiveness of particularly these short odds bets obviously depends on whether you think the bookies can predict the results of election races as skilfully as they can horse races and football matches. Put another way, and the main topic of this blog: who are generally more reliable – pollsters or punters?

Step up, John Major, the country’s most electorally successful living Conservative, thanks to his historic triumph in the 1992 General Election. Averaged out, the then four main final polls put Labour ahead on 39%, the Conservatives on 38%, and projected a comprehensively hung parliament. Next day, Labour managed just 35%, while the Conservatives won nearly 43% and a Commons majority of 21 seats. Major became the only UK party leader ever to win 14 million votes – nearly a third more than Cameron in 2010 – a hung parliament was postponed for another 18 years, and ‘shy Tories’ had arrived as a pollster’s nightmare. For a young and still mistrusted polling industry it was a humiliating setback.

It has, as the current campaign daily demonstrates, recovered, grown, and evolved methodologically almost beyond recognition. At the same time, particularly with the proliferation of smaller parties, both polling and seat prediction have become considerably more hazardous. All political pollsters, however, are parts of large commercial companies. Screw up, and their other clients immediately know, so generally they’re highly rigorous and pretty good – provided you judge them reasonably.

They’re not predictors or forecasters. They take time-specific opinion snapshots, with different interrogatory cameras – some using online panels, some random digit phone dialling – of what they hope are politically as well as demographically representative samples of the whole electorate. But because they’re samples, mostly of between 1,000 and 2,000, not much more than 19 times in 20 will any single response be within 3 per cent (plus or minus) of what it would be, had the whole population been surveyed.

This means two things: first, roughly every 20th finding or poll will be outside that +/- 3 per cent margin of error; second, that ‘rogue poll’ will invariably attract more media attention than the rest put together.

That’s almost certainly what happened in the last fortnight of the Scottish referendum campaign. Of nearly 40 polls published between June and the September 18 polling day, only two put the Yes vote ahead. The coverage given to particularly the first of these polls was enough, though, to prompt all three major party leaders to panic in concert, rush up to Scotland, and make desperate vows and commitments they’re still regretting.

It doesn’t, though, explain why the averaged five final polls put the No vote on 49.2%, with a lead of just 4.2% – when the actual result was 55.3% to 44.7%, and a No lead of 10.6%. Poor methodology, very late change, shy No voters, whatever – the pollsters got it wrong.

And they got it as badly wrong – or, in fairness, their Israeli counterparts did – in this year’s perhaps most publicised elections: those in March to the Israeli Knesset, called early by Prime Minister and Likud Party leader, Benjamin Netanyahu.  The averaged seat projections of the final seven polls published before Israel’s five-day pre-election poll ban gave Likud 22 seats and its main opposition, Isaac Herzog’s two-party Zionist Union 26 – prompting newspaper headlines like the Daily Telegraph’s ‘Bye-bye for Bibi?’.

The three exit polls suggested that the four-point gap had been closed in the final few days’ campaigning, but none came anywhere near the actual result of a six-seat lead (30-24) to Likud/Netanyahu. In what is a 120-seat legislature, with 10 parties having at least five seats, forming a government is tricky, but, in these matters anyway, Israelis are more patient than we are, and the permitted 42 days have been extended to allow Netanyahu until May 6 to name his.

Those ‘Bye Bye, Bibi’ headlines, however, weren’t the only ones. Gambling sites and the more refined ‘prediction markets’ were giving Netanyahu “an 81% chance of being re-elected”, and offering the equivalent of fractional odds of 1/6 on his winning and 4/1on losing.

It could have been a replay of the Scottish referendum. Over that final ten days, while English politicians and pollsters were over-reacting, the betting odds, overwhelmingly predicting No throughout the campaign, hardly wobbled: around 7/2 against Yes, and 1/4 for No. Indeed, one firm paid out a six-figure sum on a No bet three days before polling day.

These cases of the betting industry having a better sense (no apologies; pun deliberate!) of what’s actually happening aren’t the exceptions that prove the rule; they are the rule – a rule, moreover, that’s logically to be expected. Pollsters ask about our voting intentions and opinions, whereas bookies and bettors focus only on results and outcomes. Above all, though, they back their judgement with their money. So watch the polls carefully, as the bookies do, but if in doubt, then, as Americans might say, follow the frogskins (greenbacks for the alliteratively inclined).

At the time of writing – Wednesday 22nd – there have been 11 new polls since last Thursday’s BBC1Opposition Leaders’ debate. Five put the Conservatives ahead in percentage votes, five Labour, and one had them tied on 34 per cent.  There have also been seven poll-based seat forecasts: five showing the Conservatives ahead, two Labour.

No division among the bookies, though. The best seat-number odds being offered on Labour by any of Oddschecker’s 24 bookmakers were 21/10, while the best on the Conservatives were 1/2. Next PM, though, is very different: Miliband was 3/4 and shortening; Cameron 11/8 and drifting – rather like his party’s campaign.

Chris Game - pic

Chris Game is a Visiting Lecturer at INLOGOV interested in the politics of local government; local elections, electoral reform and other electoral behaviour; party politics; political leadership and management; member-officer relations; central-local relations; use of consumer and opinion research in local government; the modernisation agenda and the implementation of executive local government.

Hilary Benn – not always so brilliant, or even believable

Chris Game

“Later, I heard that Hilary Benn had been appointed [as a Minister for International Development in a 2003 Blair reshuffle]. Lucky old Hilary. That’s the second time he’s stepped into my shoes, but I can’t complain. He’s brilliant.”

Deliverer of this unusually effusive politician’s compliment was the actor playing Chris Mullin, the former Sunderland Labour MP and junior minister, whose well-received diaries were recently adapted into one of the more surprising of recent London theatre hits, A Walk On Part: The Fall of New Labour.

Well, with due respect to Mr Mullin, his hero hasn’t been so brilliant – or even, apparently, honest – in his attempts to spin this year’s council tax figures to his party’s advantage.

On April 16, Mr Benn, Labour’s Communities and Local Government Spokesperson, posted a news items on Labour’s official website, headed ‘New figures reveal residents in Labour areas pay less council tax than in Tory or Lib Dem areas’.

Nothing remarkable there, I agree.  It could have been an early April headline from pretty well any year since Labour decided that tax-raising was an embarrassing activity for a social democratic party to be engaged in.  Still, I did wonder where the ‘new figures’ came from, as the only ones I knew of that analysed by political control were those helpfully produced by Matthew Keep in the House of Commons Library (Council Tax 2012/13 – Standard Note: SN/SG/6276).

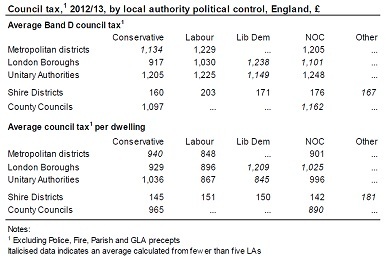
As a politician, Mr Benn sees no need to source his ‘new figures’ or the ‘research’ that produced them, but they are at such variance with those of the Commons Library – as in the table reproduced below – that they are worth comparing, or contrasting, more closely.  It may be, of course, that Mr Benn’s data are somehow more complete than those in the table, or maybe differently calculated – in which case it’s a particular shame that we weren’t informed.

Benn: ‘In Labour local authorities, the Band D council tax rate is £81 lower than in Tory areas and £42 lower than in Lib Dem areas’.
Commons Library: Wrong.  In ALL Labour authorities – all types and therefore all collectively – average Band D council tax is HIGHER than in Conservative authorities and, higher too than in Lib Dem authorities, with the exception of London borough, of which they control just two.

Benn: ‘Households in Labour-controlled authorities pay on average £220 less per year than those in Tory areas and £101 less than those in Lib Dem areas’.

Commons Library: Partly wrong. Households in Labour-controlled London and metropolitan boroughs and unitaries do pay less on average than those in Conservative areas, but the difference is much less than £220 p.a., and in shire areas those in Labour-controlled districts pay slightly more. Comparisons with Lib Dem authorities vary more by type of authority.

None of this, it should be emphasised, is surprising.  Indeed, the surprise would be if the picture painted by Mr Benn’s figures really were true. The truth, however, is that this is one of the more irritating ritual arguments in which the major parties engage every year in the period between council tax-setting and the local elections. It has become an inevitable by-product of the way in which our unreformed tax system works – as I sought to explain in this space last April.

The tax base for council tax is a ratio system centred around Band D: Band A paying 6/9 (2/3) of Band D; Band B 7/9, and so on up to Band H paying 18/9 (2x) of Band D. Councils calculate their tax base by weighting the number of dwellings in each band to Band D, and report their budget headlines in terms of ‘Council tax for council services (Band D)’.

Band D has thus become a benchmark for comparative purposes, and it is therefore perfectly reasonable that the Conservatives tend to use it – as they could with this year’s Commons Library figures – to claim that average Band D tax rates are normally lower in Conservative than in Labour or most Liberal Democrat areas.

Reasonable, but disingenuous. Not so much because only a small minority of properties (15% in England) are actually in Band D, but because, exacerbated by the absence of any revaluation since 1991, the mix of property bands across authorities and regions nowadays varies starkly. In my own authority of Birmingham 56% of properties are in Bands A and B, and just 14% in Bands E to H combined. Neighbouring Solihull has 19% A and Bs and 41% E to Hs. In the North East there are 56% Band As, in the South East 9%, in London 3%.

All of which obviously means that, to raise a certain tax income in an authority with mainly Band A to C properties requires a significantly higher Band D tax than in one comprising many E to H properties. The average bills paid by tax payers will vary similarly – being generally higher than the Band D figure in affluent and Conservative-inclined areas, and lower in poorer or Labour-inclined ones.

Hence Labour’s equally disingenuous preference for using average tax bill figures as their political comparators.  North East: Average Band D council tax £1,525; average tax bill per household £1,072. South East: Average Band D council tax £1,475; average bill per household £1,381. As the anthropomorphic Russian meercat, Alexsandr Orlov, would confirm: simples!

Mr Benn, though, wasn’t finished. His ‘research’ had also revealed that more Conservative than Labour councils had rejected the Government’s one-off grant in exchange for freezing or reducing their council tax in 2012/13. “16 Tory councils have increased council tax this year, as opposed to 15 Labour councils”.

This really is foolishness, on several different levels. First, is Benn really suggesting the 15 Labour councils were wrong: that they should have cravenly fallen in with the Government’s capping policy and accepted the one-off grant, even if they judged it detrimental to their residents’ longer-term interests? If so, it’s interesting that we didn’t hear more about it at the time, when Eric Pickles and his fellow Ministers were positively bullying Conservative councils into obedience.

Second, aren’t the numbers of councils controlled by the respective parties just a tiny bit relevant here?  The Conservatives have roughly two-and-a-half times as many as Labour, which makes the 16-15 comparison look a bit lame.

Third, if Benn really is following Pickles’ line – that it was councillors’ moral duty in these austere times to freeze council taxes – it’s presumably worth taking account of the percentage increases imposed by the respective groups of offending councils, and how close they came to exceeding the 3.5% that would have triggered a referendum.

The full list was published by the Local Government Chronicle on March 21, and, by my calculation, the average Conservative council increase was under 3%, while Labour’s average – with 8 of their 15 going for the full 3.5% – was 3.27%.

Mr Benn’s brilliance, it would seem, is more in the field of international relations than local government finance.

Chris is a Visiting Lecturer at INLOGOV interested in the politics of local government; local elections, electoral reform and other electoral behaviour; party politics; political  leadership and management; member-officer relations; central-local relations; use of consumer and opinion research in local government; the modernisation agenda and the implementation of executive local government.