Queen Cersei and the evaporating Revenue Support Grant

Chris Game

Next week is the last week of Hilary Term, or revision week at the end of Spring Term, as it’s known here at the UoB and most other universities who feel no great affinity to the probably inappropriately named 4th Century St Hilarius of Poitiers. Over the many years in which I lectured undergraduates, I used rather to like it: end of the course/module in sight, legitimate chance to share and spread gossip about approaching local elections, lecture attendances boosted by students desperate for exam hints. Plus, nowadays, plenty of discussion-prompting visual aids – one of which is the pretext for this blog.

SIGOMA is not – disappointingly perhaps – an African hip-hop band, but less catchily the Special Interest Group of Municipal Authorities (outside London) within the Local Government Association. Yes, even the brackets are part of the full name – which has to convey that its 45-council membership comprises most major urban authorities in the North, some in the Midlands, plus the ‘South Coast regions’ of Plymouth and Portsmouth. The 45, claim SIGOMA, share similar characteristics and can therefore advantageously speak with a collective voice – moreover, with one that, particularly following the Coalition’s changes to the local government funding system, needs to be distinctive from that of the LGA with its responsibility for somehow representing the interests of all its 400+ member authorities.

These funding changes, argues SIGOMA, are so divisive, and their impacts so damaging to areas with characteristics like those of its members, that they threaten to set region against region in the manner of – well, Game of Thrones.  As even non-followers of the popular TV series may be aware, the US fantasy drama chronicles the violent dynastic struggles for control of the Iron Throne of the Seven Kingdoms of Westeros. SIGOMA’s spoof YouTube video is Game of Cuts Winter is Coming for Councils – and, at under 2½ minutes to Game of Thrones’ soon-to-be-five seasons, it’s inevitably (even) less subtle.

The Sean Bean character, Lord ‘Ned’ Starp, Warden of the North (possibly Steve Houghton, Leader of Barnsley MBC, SIGOMA’s administrative base?) and his mate from the Coastal Ports, protest that “our people are already on their knees … the sick have no one to care for them, and our children nowhere to read …”, while the spokesperson for “the hamlets of Bucks and Berks” remonstrates that they too are suffering, with “not enough funding to keep our tables supplied with swan and game”.  But sadistic Queen Cersei of the South and her incest-conceived son, King Joffrey, are unmoved: “All the regions have had to make their sacrifices. The money has been spread evenly and you will cope, for the sake of the Seven Kingdoms”.

Doubtless, Local Government Minister Kris Hopkins’ family arrangements are altogether more conventional, but his presentation of the 2015-16 finance settlement last December suggests similarly briefed scriptwriters:

“The local government settlement is fair to all parts of the country – north and south, rural and urban, city and shire – therefore every council should be able to deliver sensible savings while protecting frontline services for local taxpayers … Those facing the highest demand for services continue to receive substantially more funding. For example, Middlesbrough has a spending power per household of £2,441 which is £871 more than the £1,570 per household in Windsor and Maidenhead.”

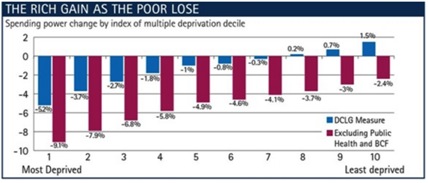
As noted in my recent blog assessing that settlement this has been the standard – and increasingly disingenuous – government line for the past five years. That blog, though, was largely about ministers’ ploy – what one might call the ‘spending power sleight of hand’ – to mislead the media and public from the outset about the true severity of their cuts to the funding of the local government sector as a whole.  SIGOMA’s current campaign – Protecting Vital Services – is about the discriminatory distribution of the cuts within the sector, and particularly the impact of the funding changes since 2013-14, which cumulatively have switched the determination of government funding from assessed needs formulae to councils’ tax-raising capacity.

The big change was the introduction of the Business Rates Reduction Scheme (BRRS). It was cautiously welcomed by local government for its devolutionary principle, but SIGOMA-profile authorities were immediately concerned that, as BRRS funding increased and Revenue Support Grant (RSG) correspondingly decreased, the big gainers would inevitably be already prosperous authorities with higher rate-raising capacities, and the gap between them and the less well-off with the highest demand for services would continue to grow.

The New Homes Bonus Scheme (NHB) story was not dissimilar. It was launched in 2011-12 to incentivise local authorities to grant planning permissions for new homes and bring empty properties back into use. For each additional home they would receive for six years an annual bonus payment equal to the council tax generated – from the government’s own funding. Again, it was cautiously welcomed, although it was obvious that authorities with higher banded housing would be the bigger beneficiaries. But no sooner was it established than the government funding bit switched to a top-slicing of RSG, and again poorer authorities have been absolute, rather than just relative, losers.

The Council Tax Freeze Grant was slightly different, in being from the beginning a disadvantageous bribe to councils to cut their spending, but its relevance in this context is that it too is top-sliced from RSG. Put just these three policies together over the three most recent finance settlements, and RSG – the principal source of central government funding of non-schools revenue expenditure and traditionally the mechanism for recognizing councils’ differing resource needs – has shrunk as a proportion of local government funding by over 5% a year.

Chart Game blog

SIGOMA calculates that over just these three years authorities with higher grant dependency and greater formula share in RSG have lost proportionately twice as much (around 20%) as those with more buoyant rates bases and greater protection within RSG (around 10%).

Incidentally, further confirmations of deprived areas suffering most harshly from the government’s cuts have been produced over the past few weeks alone in an Institute for Fiscal Studies Briefing Note, by the Association of North East Councils, and, most tellingly, in evidence from the DCLG itself in the Public Accounts Committee’s report on the Financial Sustainability of Local Authorities (paras 8ff.).

Game of Cuts doesn’t go into the intricacies of RSG that SIGOMA’s Protecting Vital Services study does, confining itself to the billboard-style message that “Since 2010 local government in England has lost more than 40% of its core funding. Urban authorities, largely in the North and the Midlands, have lost the most money as a result of these cuts.” You don’t get SIGOMA’s proposed ‘fair and sustainable’ three-block future funding model either, but both productions, in their very contrasting ways, are worth a look – even if you don’t have a bunch of students to entertain.

Chris Game - pic

Chris Game is a Visiting Lecturer at INLOGOV interested in the politics of local government; local elections, electoral reform and other electoral behaviour; party politics; political leadership and management; member-officer relations; central-local relations; use of consumer and opinion research in local government; the modernisation agenda and the implementation of executive local government.

The fairness (or otherwise) of the 2015-16 local government finance settlement

Chris Game

In choosing to announce the 2015-16 local government finance settlement just eight days before Christmas, ministers presumably hoped – as, indeed, I’d expected – that the argument about the presentation of funding and spending cut statistics for local authorities, both collectively and individually, would have died away by mid-January. However, it hasn’t, which is why I too am returning to the topic, which had its importance re-emphasised several times over the past week. First, Paul Woods, until recently Newcastle’s long-term and respected Treasurer, expressed in a Local Government Chronicle column (13 Jan.) his disappointment at the widespread:

“Acceptance being given to a low 1.8% spending power cut, as opposed to the more realistic analysis by the Chartered Institute of Public Finance & Accountancy (CIPFA) of a 6% cut. A truly independent and objective analysis of the settlement … would be unlikely to conclude that spending power has only been cut by 1.8% … [or that] as the government has claimed, the settlement is fair to north, south, urban and rural areas”.

That last ‘claim’ was a direct quote from the opening paragraph of an article that Local Government Minister, Kris Hopkins, had evidently felt it necessary to write for the same magazine (LGC 12 Jan.). Not surprisingly, it largely reiterated points from his settlement announcement – including that “councils facing the highest demand for services continue to receive substantially more funding … than authorities facing less pressure”, and that, for pooled budgets like the public health grant, “it would be perverse not to consider [all] the money as part of the funding available” to local authorities, including that actually spent by the NHS. Then, last Friday, we had the open letter from Rob Whiteman, CIPFA Chief Executive, to DCLG’s new Permanent Secretary, Melanie Dawes. After congratulating Dawes on her appointment, Whiteman attempted quite a barbed lecturette on “ethics in government”, including the need for “greater clarity” in the department’s public communications, as opposed:

“to the rhetoric and spin that has too often characterised the presentation of the numbers by DCLG and others over the past few years … [meaning that] … the public are being misinformed about official information and data. For example, describing transferred resources that still must be spent on the NHS as increasing councils’ ‘spending power’ in a way that under-reports their loss of DCLG grant is disingenuous.”

Given these developments, it seemed worthwhile using these columns – in which it is possible to include both links/references and a couple of rather striking graphs – to explain a bit more fully, if very definitely non-technically – what this dispute is about.

Grants and grant funding can seem both bewildering and paint-dryingly boring. But, at our combined average age of ten, my younger sister Jennifer and I didn’t know this, and we reckoned we’d cracked at least the essential principles – which was fortunate, as we and our mum were even more heavily grant-dependent than today’s metropolitan borough councils.

In our traditional patriarchal household, my father was the sole wage-earner, and he funded my mother through her weekly (Friday) ‘housekeeping’ grant, and us children through our weekly (Saturday) pocket-money grants. Opportunistically, through grandparental charity or the undertaking of ‘errands’ (mainly me) and ‘chores’ (J), we could increase our revenue spending power. But we could also suffer largely non-negotiable grant-loss, to pay for the upkeep of J’s pet rabbit, a cricket ball-broken window, or – seasonal touch here – Christmas gifts for the afore-mentioned grandparents.

The point is that, callow as we were, we understood perfectly the distinction between grant funding and spending power – unlike the sections of our media who either parroted or headlined not the finance settlement’s actual words – let alone its meaning – but DCLG ministers’ political message. ITV was typical: “the amount of funding councils will get in central government grants will be reduced by 1.8% in 2015-16”.

That’s what ministers hoped we’d hear, but for them the F-for-funding word has become as unmentionable in company as the Old English F-expletive. ‘Amount of funding’ is much too coarse, measurable and comprehensible. It’s far more refined – and cryptic – to talk of spending power (SP), particularly if you get to define it yourself. What minister Hopkins announced, therefore, was that “the average spending power reduction for councils in 2015-16 is just 1.8%”. Indeed, with “the additional transformation money the government is giving councils to improve services, this reduction falls to 1.6%” (emphases added). See, it’s getting even better. Moreover:

“Those facing the highest demand for services continue to receive substantially more funding. For example, Middlesbrough has a spending power per household of £2,441, which is £871 more than the £1,570 per household in Windsor and Maidenhead.”

This is the fifth year in which ministers have attempted this sleight of hand, and, to be fair, most of the media have caught on. Most did report that the 1.8% cut is not in councils’ grant-funding, but their spending power – though still only a minority explained the distinction and its significance.

It would have been like my father deciding in one of the 1950s’ sterling crises that we should all (kids included) be in it together, and imposing a three pence austerity cut in my pocket money of two shillings and sixpence (2/6 = 30 pre-decimal pence) – but overlooking that he’d already cut it by sixpence for cricketing misdemeanours, which I’d subsequently made up through errand work. As he might have explained, it was only a 10% reduction in my spending power, not the 12.5% grant cut I was claiming. Besides, he knew of better-off families in Westcliff (SE Essex’s nearly-as-posh equivalent of Windsor and Maidenhead) whose children didn’t even get weekly pocket money.

Following the Coalition’s ideological decision to reduce the budget deficit largely but selectively through public spending cuts, local government ministers in 2010-11 faced the problem of explaining to the public that they’d be cutting central government grant funding of council revenue spending by an unprecedented 28% in cash terms (40% in real terms, allowing for inflation) over four years, with 21% ‘front-loaded’ in the first two years.

The scale of ministers’ task can be seen in a simple but powerful chart in a recent House of Commons research paper, in which the dark green columns represent the savage annual average percentage cuts in councils’ grant funding, in contrast to the generally modest increases to which they’d been accustomed. Their solution: to replace the nasty dark green columns with much less alarming light green ones.

Game1 First, they – or their civil servants – restructured the whole grant system, to make before-after comparisons more difficult. They then created their Revenue Spending Power measure, which they claimed would – by including council tax receipts, certain specific grants, and NHS social care funding – give a fuller picture of a council’s overall financial position.

Fuller, yes, but not full. Contrary to what is stated in the Government’s Plain English Guide to the 2015-16 Grant Settlement (para. 3)  income from fees, charges and investments is NOT included in SP. These are income sources likely to decline in a recession and whose addition to SP would emphasise, rather than de-emphasise, councils’ grant dependency – so nothing like as politically helpful as the contrived SP measure, which could instantly reduce a 28% grant cut to a 14% cut in spending power.

Ministers, then, view SP in the same way as Humpty Dumpty in Alice Through the Looking Glass. It can mean just what they choose it to mean – or more, or less. If, say, they excluded council tax receipts from SP, any percentage grant cut would immediately become more (bad). If, on the other hand, they could include the whole of the new Better Care Fund (BCF) – a single pooled budget to incentivise the NHS and local councils to work more collaboratively – any cut would immediately become less (good).

Yes, of course it’s confusing; that’s its whole point. Present the public with two, three or more magnitudes of ‘spending power cuts’, and the chances are we’ll either turn off altogether or hear the one that’s shouted loudest: the Government’s. For 2015-16, as we’ve seen, the Government’s figure is 1.8% – or possibly 1.6%.

Neither the figures nor ministers’ form of presentation came, by this time, as a surprise, and the Local Government Association (LGA), attempting to get its retaliation in at least simultaneously, released its own figures to coincide with ministers’ announcements. These showed first that the Government’s total funding support to local authorities will be cut by 13.7% from the 2014-15 figure. It’s that F-for-funding word again, so ministers didn’t bother mentioning it, but it’s shown as a provisional figure in the Commons chart.

The LGA’s second calculation was that, if council tax income were excluded from SP – since it’s a completely different type of income from government grant – the average reduction would be not 1.8%, but 3.7%. Third, if you also exclude the NHS’s portion of the £3.5 billion Better Care Fund and include in SP only the estimated £2 billion spent on social care services by local authorities, the arguably rather truer average reduction in councils’ revenue spending power becomes 8.8%, or nearly five times the Government’s figure.  

CIPFA’s analysis, as we’ve already seen, was different again: a 6% drop in spending power – through including council tax income but excluding ring-fenced grants and the Better Care Fund. To adapt the old Punch cartoon caption: you takes your choice of definition, but you still loses your money.

And that spending power cut, to repeat, is the average for all English local authorities – and even under the Government’s SP figures, individual authorities could lose up to 6.4% of their spending power, though others would receive a nice little increase. But, especially with a General Election imminent, ministers like Kris Hopkins want to persuade us that their settlement “offers a fair deal to taxpayers all over the country; north and south, rural and urban. Councils facing the highest demand for services continue to receive substantially more funding and have about 40% higher spending power than authorities facing less pressure.”

That last sentence really is disingenuous. Any formula or block grant comprises both a redistributive element, to compensate for local authorities’ differing needs, and a negative ‘resources’ element, to reflect their differing ability to raise their own money through council tax. Even this government hasn’t contemplated abolishing the redistributive principle altogether. But let’s see how it judges that its way of doing things offers a ‘fair deal’ to taxpayers, regardless of where they live.

Again, I’ll start personally. I pay my council tax to Birmingham City Council, whose cut in spending power, according to the Government’s figures, is 6%, close to the maximum 6.4%. Cuts for other West Midlands metropolitan authorities run from Sandwell (5.1%) and Wolverhampton (5%), through Walsall (4%), Coventry (3.9%) and Dudley (2.8%) to Solihull – the sole Conservative-controlled council and, as it transpires, the only one whose SP will increase (+0.4%).

So Birmingham’s cut is proportionately the greatest, despite, as noted in Sir Bob Kerslake’s recent highly critical report on the council for the Government, having “more poor children than anywhere else in England” (p.6), and being overall one of the most multiply deprived authorities in the country.

According to the DCLG’s ranking of England’s 326 local authorities by multiple deprivation – Birmingham is 13th most deprived, Sandwell 9th, Wolverhampton 20th, Walsall 35th, Coventry 53rd, Dudley 113th, and Solihull 212th – almost precisely the same order as that for percentage SP cuts and, on the face of it, a non-obvious operationalisation of a ‘fair deal’.

Local Government Chronicle and the Association of North East Councils undertook a similar exercise on a larger scale, again using the Government’s SP measure. As shown in the chart, “the most deprived 10% of areas face a 5.2% cut while the most affluent tenth will see their funding rise by 1.5%”.

The Rich Gain As the Poor Lose With apologies for the length of this blog, that’s what this particular local-central argument is fundamentally about – a little more than just the niceties of statistical presentation.

An earlier Birmingham-focused version of this post appeared in The Chamberlain Files Chris Game - pic

Chris Game is a Visiting Lecturer at INLOGOV interested in the politics of local government; local elections, electoral reform and other electoral behaviour; party politics; political leadership and management; member-officer relations; central-local relations; use of consumer and opinion research in local government; the modernisation agenda and the implementation of executive local government.