In case you missed it: the Local Government (Independence) Bill

Chris Game

It was partly the timing. In combination, the suddenly increased likelihood of both Scottish independence and a Coalition break-up were bound to eclipse last Friday’s scheduled Second Reading of the Local Government (Independence) Bill. It was unfortunate, though.  After all, local government independence would be a pretty big deal too, wouldn’t it?

You bet it would – though, if you’re at all serious about the betting bit, I’d suggest you check the bookies’ odds first. On a Scottish Yes vote you could get 2/1, and 66/1 on UKIP winning the General Election. On local government independence the giggling bookie would probably let you name your own odds.

That’s not to say that Friday’s events in Westminster weren’t important. They were, but they need setting in context.

The LG(I) Bill, not surprisingly when you hear its content, wasn’t a Government Bill, but a Private Members’ Bill, which limited its prospects for a start. Moreover, it wasn’t a Ballot Bill, introduced by one of the 20 lucky MPs whose names were drawn in the annual backbenchers’ ballot and whose chosen Bills stand most chance of eventually becoming law, partly through being prioritised on the limited number of Fridays set aside for private members’ legislation.

The LG(I) Bill was a Presentation Bill, microscopically few of which get anywhere near the Statute Book. True, there was a Protection of Birds (Amendment) Bill that apparently passed all its Commons stages in 67 seconds during one Friday sitting. That Friday, though, was in 1976, which explains why the LG(I) Bill’s sponsor, Graham Allen, Labour MP for Nottingham North, wouldn’t have been unduly optimistic, especially after seeing the Order of Business.

On an already curtailed parliamentary day, the LG(I) Bill was listed behind four Ballot Bills, headed by Liberal Democrat MP Andrew George’s Affordable Homes Bill – aka the Bedroom Tax (Embarrassing the Coalition Amendment) Bill – which made the improbability of Allen’s Bill being debated an effective certainty.

The Affordable Homes Bill would substantially undermine one of the Coalition’s most controversial welfare reforms, by allowing poor social housing tenants to retain their ‘spare room subsidy’ until they actually have somewhere smaller to live. The Lib Dems indicated they would join Labour in supporting George’s Bill, whereupon the Conservatives, unusually for a Friday, imposed a three-line whip on their MPs.

It guaranteed an extraordinary attendance, but not the defeat of the Bill, which received an acclaimed Second Reading by 306 votes to 231.  It was a momentous loss for the Government, in substance, scale and in its damage to inter-party relations within the Coalition. Its immediate effect, though, was that debate on the second Ballot Bill was adjourned at 2.30, and Allen’s Bill wasn’t reached.

It was obviously disappointing, but not much more: at worst, maybe, only the end of the beginning.  For in Graham Allen’s epic constitutional reform agenda, the most immediate objective was already achieved. The LG(I) Bill exists. It’s in the parliamentary machine, and Allen can proceed with his next stage of trying to convince all three main parties to pledge in their manifestos to support such a Bill in the next Parliament.

It’s ambitious, but perhaps not quite as quixotic as it sounds. For Allen is also the extremely active Chair of the Commons Political and Constitutional Reform Committee, whose major project throughout the present Parliament has been to explore the case for and against the UK having, like virtually every other country, a formally codified constitution.

With, I suppose, a forgivable and topical gesture, this project has been entitled ‘A New Magna Carta?’ and its first main product – a 400-page report, compiled in collaboration with King’s College, London – was published in July and put out to public consultation – http://www.parliament.uk/new-magna-carta-consultation. 

The committee takes no views on the desirability of codifying the current heap of common law, Acts of Parliament, European treaties and unwritten conventions into a clearer, more balanced and democratic set of constitutional arrangements. That’s for us to say through the consultation process.

Rather, the report presents three blueprints of how codification could be approached: a Constitutional Code, a Constitutional Consolidation Act, and, most interestingly and set out in full in the report, a completely new written constitution by which the UK, with or without Scotland, would be governed.

‘Principles of local government’ get just one of 53 chapters in this draft constitution, but it is these principles, embodied in a statutory Local Government Independence Code – drafted, incidentally, by former INLOGOV colleague, Professor Colin Copus – that largely comprise Graham Allen’s LG(I) Bill. 

The Bill’s purpose is to declare local and central government equal to and independent of each other, to separate their finances, to regulate the local-central relationship through a statutory code, and to set out procedures restricting any future parliamentary amendment or repeal of the code.

Many of the Bill’s provisions may sound fairly unexceptional. Local authorities’ accountability, the code would assert, is to their electorates, not to Whitehall. Local authorities are autonomous, democratically-elected bodies which independently decide upon, administer and regulate public affairs and deal with all matters of concern within their boundaries that are not the statutory responsibility of another body.  A local authority’s geographical boundary can be altered only by a proposal from the authority itself or from its electorate.

These things would indeed be unremarkable in most countries, with less centrally controlled systems of local government. In our system, unfortunately, concepts like local and territorial autonomy, operational independence, and ‘all matters of concern’ are enough to seize ministers and civil servants with a collective attack of the vapours.

And that’s before we get near to the real biggie: ‘local government financial integrity’.  Local authorities, the code would declare, shall be financially independent of central government, which may not place any restriction on decisions by local authorities about the exercise of their financial powers.

Each local authority shall receive from central government an agreed and guaranteed share of the annual yield of income tax. Local authorities may, with their electorates’ consent, raise additional sources of income in their areas in any way they wish – just like the Scots, if they behave themselves and vote No.  Central government shall not cap, or otherwise limit, local authorities’ taxation powers.

All that and more is in the first of nine Schedules. These substantive proposals, though, are possibly not constitutionally the most radical. That prize would probably go to the hurdles facing any future government seeking to amend or repeal the code: a minimum ‘super-affirmative’ requirement of unanimous approval by each parliamentary House, or by a two-thirds majority of the total membership of each House.

Which is why I suggested at the start of this blog that the LG(I) Bill’s lack of progress on Friday was only partly about its timing. Even without the Affordable Homes Bill, and setting aside much of the LG(I) Bill’s own content, the idea of abolishing two of Parliament’s most precious rights – to determine the country’s level of taxation, and to change or repeal any previous legislation – would be several bridges too far for many MPs.

For the present, therefore, local government independence must be considered to have been put on hold – though not, one can but hope, indefinitely.

game

Chris Game is a Visiting Lecturer at INLOGOV interested in the politics of local government; local elections, electoral reform and other electoral behaviour; party politics; political leadership and management; member-officer relations; central-local relations; use of consumer and opinion research in local government; the modernisation agenda and the implementation of executive local government.

Councils should have the power NOT to tax supermarkets

There’s no shortage of reasons to dislike supermarkets generally and Tesco in particular – their flimsy carrier bags, their irritating BOGOFs and BOGOHOs (Buy One, Get One Half Off), their unpoliced disabled parking bays, their Everyday Value instant coffee granules. Then there are all the economic, environmental and social reasons – the ones understandably more emphasised in Derby City Council’s recent proposal that local authorities be given the power to introduce a levy of 8.5% of rateable value on large retail outlets: a supermarket or Tesco tax, as it was instantly labelled by the media.

Supermarkets, the council claims, cost local jobs, increase waste- and traffic-generated environmental pollution, damage British agriculture, undermine local economies and community life, underpay their staff, and damage public health through being the largest suppliers of tobacco and alcohol – among other things.

The council’s cabinet actually approved the policy last December, with the acknowledgment – unfortunate for an education authority – that costs could include sponsoring a Bill through Parliament to ‘Royal Ascent’ (p.3).  But, after the public were consulted and support mustered, it was only formally announced in late July, at the start of the holiday season, with the result that reaction, including from local government, has been both less voluble and less co-ordinated than might have been expected.

After all, it sounds a popular, even populist, proposal. Tesco’s sales and share price may have fallen recently, and likewise its CE and finance director – with, almost needless to add, humongous payoffs. But its tax haven use is notorious and its Fair Tax Mark of just 3 out of 15, while marginally better than the 2s of Sainsbury and WH Smith, is set in its true context by Greggs’ perfect 15.

In short, supermarkets could afford their own tailored levy – amounting to maybe 0.1% of their total income – without passing it straight on to customers. Moreover, the legislation would require that the proceeds go directly to help local economic activity and services. Certainly, most early reaction supported Derby’s initiative, in addition to the more than 60 councils from across the party spectrum that the bid claimed had already indicated their backing.

The proposal was submitted under the 2007 Sustainable Communities Act, which gives councils the opportunity to ask central government to remove legislative barriers currently preventing them optimising the economic, social and environmental wellbeing of their area. Though the Act was introduced under a Labour government, the roughly 200 proposals initially submitted were inherited by the Coalition. The nearly two-thirds judged broadly consistent with Coalition policy were grouped into Action Areas and implemented wholly or in part, and the remainder rejected. This latter group, importantly for the eventual fate of Derby’s supermarket levy, included all tax-related proposals, from chewing gum to plastic bags, on the grounds that tax decisions are the Chancellor’s responsibility and therefore made as part of the overall annual budget process.

Most of the proposals from my own local authority, Birmingham, on the other hand, were deemed less threatening, and have contributed, for example, to the introduction of Accelerated Development Zones to fund new infrastructure investment, extended financial incentives to promote renewable energy generation, the revision of legislation to enable councils to provide more allotments and community gardens, and the discretionary power to regulate vehicles parking on and damaging grass verges.

Which all sounds, for maybe three seconds, very localist and encouraging – until you wonder why on earth one of the largest local authorities in Europe should be grovelling to ministers to allow it to spend my money on providing allotments and protecting grass verges.

And so, back to the Tesco tax, which, however much it’s described as a rateable value-based levy, is to ministers going to look, swim and quack like a tax – and a tax they’ll undoubtedly claim will threaten investment, push up food prices, and hit the ‘hard-working families’ on low incomes that they’re electorally anxious to be seen protecting.

Business opinion is overwhelmingly hostile, and makes the reasonable point that most recent supermarket expansion has been through convenience stores, not highstreet-destructive, out-of-town sheds. Even local government, though, isn’t unitedly enthusiastic, particularly some of the bigger cities. Manchester quickly announced that it didn’t fit in with its economic vision for the city: “We work very hard to bring in big supermarkets because they provide much-needed regeneration. We want to encourage them, not put them off.”. Last week Kirklees took a similar view.

Levy supporters invariably mention knowingly that similar schemes are already in operation in Northern Ireland and Scotland, but neither are precisely the same as that proposed by Derby, and evidence of their success is, at best, mixed. The money raised by Northern Ireland’s Large Retail Levy on all outlets with a rateable value of over £500,000 goes directly to the relief of rates paid by small businesses, and its impact is therefore more immediately visible than would be the case in England.

And the Scottish Health Levy on ‘big shops selling alcohol and tobacco’ (otherwise known as supermarkets), threatening as it does Scotland’s boast to have the UK’s most competitive business rates regime, has become so bitterly unpopular that its axing next year has already been announced.

Scotland, though, has something else, something much more fundamental, to contribute on this topic – namely, the final report of its Commission on Strengthening Local Democracy, set up to consider “how we do democracy here in Scotland”, whatever the outcome of the independence referendum.

It defined its task as turning around 50 years of centralisation, and its many radical recommendations include tripling Scotland’s current 32 councils to around 100 of a more genuinely local, Scandinavian-style, size, with the freedom to raise more than 50% (instead of just 18%) of their income locally. To do so, they would have full local control of the whole range of local taxes – council tax, business rates, land and property transaction tax, and, if there were one, a supermarket levy.

And that, I suggest, is what English local authorities should have: the choice to tax, or NOT to tax, their own local supermarkets, without first having to beg for ministerial permission.

game

Chris Game is a Visiting Lecturer at INLOGOV interested in the politics of local government; local elections, electoral reform and other electoral behaviour; party politics; political leadership and management; member-officer relations; central-local relations; use of consumer and opinion research in local government; the modernisation agenda and the implementation of executive local government.
What happened to the NOC councils after the May elections: a moan and a puff

Chris Game

‘Five Days in May’: the time it took in 1940 for Churchill to manoeuvre the War Cabinet into a five-year World War, in 2010 to form Britain’s first post-war peacetime coalition – and in 2014 for Tower Hamlets LBC to announce its local election results. OK, I’ve exaggerated – it was actually 119 hours after the polls closed, so only 4.96 days, but still not good, even discounting the malpractice allegations.

However, as in all competitive contests nowadays, there are positives to be quarried. First, as a mayoral authority, Tower Hamlets’ key result, announced a mere 28 hours after the polls closed, was the re-election of Mayor Lutfur Rahman. And here’s the second positive: in TH that key result is effectively the outcome. Once you know the mayor and his party (Tower Hamlets First), you know the politics of the administration – just as with a majority party in a non-mayoral council.

My first moan, therefore, in the grumbly part of this blog, is less about TH’s dilatoriness than about that of too many of the 30-odd councils whose results were reported in the media as NOC – No Overall Control, and where, from the parties’ seat totals, we couldn’t deduce or guess the eventual outcome.

The BBC’s Vote 2014 table is an example of what happens nationally. It’s authoritative up to a point, listing the parties’ seat numbers and net gains or losses. But then, right at the bottom, after all the parties, the Independents,  and even the council-less, member-less Socialists, we have No Overall Control 32 (8 net gains). And, of course, it’s still there, six weeks later and possibly in perpetuity – the media’s limited interest in local elections having completely evaporated after the horse race bit.

However it’s used, NOC is an unsatisfactory term – conjuring up, for the highly-strung, alarming images of packs of out-of-control, newly elected councillors roaming the streets wreaking who knows what havoc, for apparently the next four years. It’s more seriously misleading too, as noted recently by Democratic Audit (DA), the blog run by the LSE’s Public Policy Group. NOC gives no hint that a perfectly conventional governing administration will be formed, probably within days, but signifies only that no single party has a majority of council seats.

Moreover, in excluding from the lists of councils gained and lost those in which a party has the largest, but minority, share of councillors, it distorts the parties’ true performances – this year at the expense of the Conservatives and Lib Dems. Their councils ‘won’ would increase respectively by a third (41 to 58) and a half (6 to 9), if their NOC councils were added, compared to Labour’s barely 10% increase (82 to 91).

But Democratic Audit’s greater concerns are with the bigger democratic picture, with the lazy NOC label as but one of a whole catalogue of ways in which all of us – and particularly the civically disengaged young people politicians claim to be so concerned about – are kept lamentably under-informed about all aspects of local elections.

This is the crucial point, and it stems, like so much else, from the huge difference in the public and media attention paid to national and local government. Given the pre-election scaremongering in 2010 about the dire consequences of a hung parliament – from a run on the pound to more or less the end of western civilisation – there was immense pressure on the leading players to come up with something that could be sold to us as at least short- and optimistically medium-term ‘Control’.  So we were informed of this outcome, the Coalition Agreement, almost literally within an hour of its settlement.

In local government, all too often, we’re never officially told of the outcome – not even the residents and electors of the NOC councils themselves – as was highlighted this year not just by DA, but also by Local Government Chronicle editor, Nick Golding. During its local elections coverage, LGC monitored councils’ and local newspaper websites – with not just disparate and depressing, but often downright ‘incomprehensible’, findings. It was disappointing, suggested Golding, if “perhaps unsurprising … that some newspapers buried their coverage or failed to work out how individual results could change the political complexion of an authority”.

“What was incomprehensible was the failure of many authorities to highlight their polls. Many council homepages made no reference to the elections and hid elections news in obscure corners; many seemed incapable of promptly posting the results for each ward or revealing how their chamber’s political make-up was changing as a result. Others seemed to think it was the job of someone else to tweet results.”

Of all the defining characteristics of local authorities, the one that most differentiates them from the other local bodies with whom they increasingly work, and that gives them their unique legitimacy, authority and accountability, is surely their direct election. As Golding exhorts:

“Local elections are therefore a big deal. Councils should do everything in their power both to generate excitement about the poll and ensure people know their representatives’ identity. Such tasks are not gimmicks – they are essential components of serving as place leaders. If councils cannot show an interest in their own elections, it is hard to see why their residents should.”

‘Everything in their power’!  Yes, indeed, but let’s at least start by eliminating the ‘incomprehensible’. What Golding and I find truly incomprehensible is why scores of councils should CHOOSE NOT to announce – on the home page of their websites and at the earliest opportunity – the overall result of their local elections; PLUS how, within a single click, voters and residents can find their own ward results – vote totals and percentages, turnouts, and whether gained or retained – and the equivalent for the whole council.

Ultimately, though, even more important than results are outcomes. If one party has an overall majority of seats and will in all probability form a one-party administration, this too should be indicated – with, if felt necessary, the date of Annual Meeting at which this will be formally confirmed. And, for the NOC councils considered here, there should be some brief explanation of the implications of no one party having a majority, and again an indication of when the prevailing inconclusiveness will be resolved.

Right, grumbling mainly over; time, overdue, for a change of mode – from moan to puff. As ever with local government, some authorities already do these things exemplarily – one example cited in the INLOGOV Briefing Paper for which this blog is a promotional puff, being West Lancashire BC, whose only two parties exited the elections with 27 seats each and facing a three-week hiatus until the council’s AGM. Prominently on the council’s website, within days, was a model holding statement of the “next step for the Borough’s political management structure”, explaining that the incumbent Conservative Mayor would have the casting vote at the Annual Meeting, and that therefore the new Mayor would probably be another Conservative, who in turn would have a casting vote in the determination of the Council Leader of a likely Conservative minority administration.

It was informative without appearing, given West Lancashire’s political culture, to compromise officers’ political neutrality; also predictively absolutely spot-on. It was, though, at the ‘helpful’ end of a really rather a long scale – at the other end of which were the councils who took several days even to post their election results, and those who still treat councillors’ party identifications as if they are Official Secrets, refusing to divulge even those of executive members until you go to their individual contact details.

Anyway, the thing is that such councils do exist and, to adapt the much parodied advert, I’ve crawled through their various hoops so that you don’t have to – if indeed it ever occurred to you to do so. Structured around the accompanying table, it provides in one place a record of the eventual outcomes of the elections in this year’s 30 NOC or hung councils (32 if you add  two mayoral authorities), and of how, particularly in some of the more noteworthy cases, these outcomes emerged.

2014 Election results table

Let me conclude, then, with one summary and one taster paragraph. Single-party minorities are undoubtedly the current NOC administration of choice, outnumbering 20 (13 Conservative, 6 Labour, 1 Lib Dem) to 10 two- or multi-party coalitions, the cause of the latter possibly having suffered from events at (the Palace of) Westminster. The coalitions, though, are striking for their almost Cleopatran infinite variety. The Lib Dems are involved in 8: 4 with Labour, 3 with Conservatives, and in Weymouth & Portland’s all-party administration with both. The Conservatives are involved in 6, Labour in 5, Independents, themselves of impressive variety, in 7, Greens in 1, and, depending on whom in Basildon you believe, UKIP in 1.

If there’s a positive by-product of having to ferret out from councils’ websites information that should be readily accessible, it must be the serendipity factor: you do occasionally come across quirky or gossipy stuff you didn’t previously know. Like, in alphabetical order, the new administration committed to getting on first-name terms with officers and staff (Brentwood); the political group whose acquisition of just one additional councillor necessitated a name change (Colchester); the city with probably the least love lost between its MP and council leader – of the same party (Peterborough); the council where UKIP took power from Labour and then gave it back again (Thurrock); the council whose first and only UKIP member is one Francis Drake (Weymouth & Portland); and finally, the council (some of) whose members seem least inhibited about confirming the public’s worst suspicions of politicians’ motives (Worcester).

game

Chris Game is a Visiting Lecturer at INLOGOV interested in the politics of local government; local elections, electoral reform and other electoral behaviour; party politics; political leadership and management; member-officer relations; central-local relations; use of consumer and opinion research in local government; the modernisation agenda and the implementation of executive local government.

Gerrymandering in Northern Ireland local government? Surely not.

Chris Game

It seemed obvious from the outset that Gerry Adams’ arrest in connection with the 1972 murder of Jean McConville was a momentous event with potentially massive implications: long-term, short-term, north and south of the border. So I was slightly surprised the following morning to hear a Sinn Fein spokesperson, protesting about the timing of the arrest, highlight its impact specifically on the Northern Ireland local elections. Still, with the subject having been raised, I couldn’t help recalling the gerrymandering – or even Gerrymandering – controversies that were the chief reason why these elections on 22nd May for 11 new, larger and somewhat strengthened councils hadn’t taken place, as planned, in 2011.

The postponement was regrettable, given that the process of replacing the 1973 structure of 26 emasculated district councils had already been going on for years. The NI Executive had started a comprehensive review of NI public administration in 2002, shortly before its longest period of suspension. In 2005 Secretary of State Peter Hain announced a scheme for seven politically balanced ‘super-councils’ – three nationalist-controlled, three unionist, with Belfast and its politically mixed electorate swinging between the two – which did succeed in uniting most of the parties, except Sinn Fein, but unfortunately only in opposition to the whole idea.

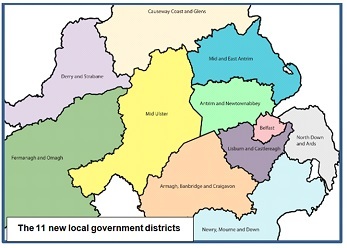
In 2008 the restored Executive split the difference between Sinn Fein and the unionists’ generally preferred 15-council structure by opting for 11, with a significant transfer of powers from central to local government, and the additional virtue of recognizable, if convoluted, place names, instead of vapid compass points: Armagh, Banbridge & Craigavon rather than ‘South’, and so on. The first elections would take place in May 2011 – or should have done, had it not been for the arguments over boundaries.

game

Traditional NI political wisdom has it that, if you want more than about, say, seven areas with roughly equal populations, no matter what number you choose, slightly more than half will have a unionist majority, and virtually all the remainder a nationalist majority. Changing demography is challenging this axiom, as may well be demonstrated in the compositions of the new councils. But, if the last elections to the old councils in 2011 had been contested on the new district boundaries, the best guesstimates are that the DUP would have been the largest party on six councils – those in the north and east, with the exceptions of Belfast and Newry, Mourne & Down – and Sinn Fein the largest party on the other five.

In one sense, these things have mattered less than might be supposed, partly because of councils’ limited powers, but also because a majority of them have long operated under similar responsibility- or power-sharing principles as the NI Assembly in, for example, their proportional allocation and rotation of committee places and chairmanships. No amount of responsibility-sharing, though, was able in 2012-13 to defuse the incendiary issue of flying the Union flag on town halls. Nor, as the details of the new districts emerged in 2008-09, did it prevent heated disputes about the proposed boundaries – particularly in, though certainly not confined to, Belfast, with its sheer size, centrality, and changing religious and political make-up.

Over the years the city’s electorate has shrunk and, like NI as a whole, has become steadily more nationalist. As a result, the once strongly Protestant council has become politically more balanced – the current make-up being 24 nationalists (Sinn Fein + SDLP), 21 unionists (Democratic, Ulster and Progressive), and 6 Alliance – although the unreformed ward structure means that it took roughly 1,700 votes to elect each nationalist member, against 1,500 for each unionist.

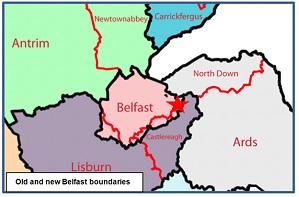
Almost any proposed configuration of larger reformed councils, therefore, would have been likely to produce a more nationalist Belfast.  Predictably enough, though, when it appeared actually to do, so too did the headline accusations of gerrymandering, particularly over the extension of the city’s southern boundaries.

game

In fairness to the relevant sub-editors, at least they were using the provocative term in more or less its correct sense – manipulating electoral boundaries for partisan advantage – even though, as the map shows, no new improbably shaped districts, resembling salamanders or any other tetrapods, were involved. In fact, the map is possibly slightly misleading, for the main added areas – parts of Lisburn in the west and of Castlereagh in the east – are mostly quite densely populated and represent an increased population of over 50,000 or nearly one-fifth, bringing the city’s total to 334,000. There was undoubtedly an argument, on the basis of the existing built-up area, for pushing the boundaries significantly further in both directions and possibly also in the north – but not one with anything like enough political traction to gain it serious consideration.

With the religious affiliation of all the city’s wards and electoral areas being available down to decimal places – from 94%+ Protestant along the Shankhill and Crumlin Roads to 97%+ Catholic in the Upper and Lower Falls, perhaps the easiest way of describing the significance of the city’s actual expansion is in the same terms. The three wards that revert from Lisburn to Belfast – Poleglass, Twinbrook and Dunmurry – are between 80 and 95% Catholic and are also larger than the two transferred wards from Castlereagh – Gilnahirk and Tullycarnet – which are 81 to 86% Protestant. These two wards are situated due south of the Stormont Parliament (see the red star on the second map) and are part of the Belfast East Parliamentary constituency – as, a little further east along Upper Newtownards Road, are Dundonald and the Ballybeen housing estate. The 8,500 Ballybeen residents, however, who constitute three wards on their own, all overwhelmingly Protestant, are not being transferred.

The gerrymandering accusations, though, that contributed most to the three-year postponement of the introduction of the new councils were made across the other side of the city, in respect of the village of Dunmurry and the multi-hatted Edwin Poots: DUP Member of the NI Assembly, Minister (in 2009) for the Environment and responsible therefore for local government, and a longstanding member of Lisburn City Council.

In a nutshell, Councillor Poots claimed the administration of which Minister Poots was a member was ‘Gerrymandering’ to the advantage of Sinn Fein in Belfast. He proposed that said Minister Poots use his authority to make what Councillor Poots claimed would be a “modest adjustment” to the recommendations of the independent Local Government Boundary Commissioner and allow Dunmurry residents to remain within what would become a comfortably unionist Lisburn & Castlereagh – a proposal that, not surprisingly, some commentators also saw as gerrymandering.

Dunmurry was not the only boundary dispute, and boundaries were not the only matters of contention. But it was key sticking point. For, until Poots and his unionist colleagues eventually backed down, there could be no final settlement of district boundaries, and no progression to the determination of ward boundaries or, unique to NI because of the requirements of proportional representation, to the grouping of wards into District Electoral Areas. In the end it seemed to come as no great surprise when in June 2010 it was announced that the 2011 local elections would be to the existing authorities – which is perhaps itself unsurprising in a state whose very existence, many would say, is a product of gerrymandering.

Chris Game - pic


Chris Game is a Visiting Lecturer at INLOGOV interested in the politics of local government; local elections, electoral reform and other electoral behaviour; party politics; political leadership and management; member-officer relations; central-local relations; use of consumer and opinion research in local government; the modernisation agenda and the implementation of executive local government.


The 2014 local elections – a preview

Chris Game

Two EU countries this May will hold local elections that coincide with their European parliamentary elections: Greece and ourselves. On Sunday 25 May Greeks vote in the second, ‘run-off’ round of elections to all their 13 regions and 325 municipalities. England, though nearly five times as populous as Greece, also has 325 lower-tier and unitary authorities. We, however, will elect mostly only fractions of fewer than half of our councils, yet still it takes seven lines of a table to summarise the 161 authorities whose voters on Thursday 22 May will probably have both a local and Euro vote. We bemoan our disappointing local turnouts, but we don’t make the system exactly voter-friendly.

game

Inevitably, the Euro elections will dominate the campaign, and the all-out London borough elections will dominate the local results. In this preview too – though less so in the longer INLOGOV Briefing Paper – all-out elections are accorded priority.

May 2010, when most of this year’s retiring councillors were elected, was Labour’s second worst parliamentary election performance in 80 years. Given a different context, though, its local and particularly its London election performance would have been justifiably celebrated – three boroughs won directly from the Conservatives (Ealing, Enfield and Harrow), seven more from No Overall Control (NOC), and more London seats than the Tories for the first time since 1998.

There’s no mystery about the national-local discrepancy – just two big reasons: the four-year electoral cycle and the General Election-boosted turnout.  The seats up in 2010 were those contested in 2006, when Labour’s estimated 26% of the national vote barely topped the Lib Dems’ 25% and was way adrift of the Conservatives’ 39%. By 2010 that 13% national vote gap had halved, bringing big Labour gains in both votes and councils – thanks partly also to hugely increased turnouts of over 60%, benefiting the large parties, especially Labour, at the expense of minor ones.

Of nearly 1,600 minor party and independent candidates in London, just 23 were elected: 2 Greens, down from 12 in 2006 (Camden, Lewisham); 1 Respect, down from 15 (Tower Hamlets – now 2); no BNP, and no UKIP – though the party has since reached double figures, mainly through Tory defections. This year turnouts will be down again, and minor party representation – including, but not only, that of UKIP – equally certainly up.

London is not a UKIP priority, and its best prospects may be in those boroughs where it already has defectors – Hounslow, Merton and Havering (from the Conservatives), Barking & Dagenham (from Labour). But UKIP influence – countrywide but particularly in London, where electors have potentially three local votes – will also be more subtly felt through vote-splitting, helping Labour to gain control, or possibly the Lib Dems to retain it, where they might not otherwise have done so.

With its long-term opinion poll lead, though, it is again Labour that will be expecting to win councils as well as seats. Back in early January, Sadiq Khan, Shadow Minister for London, announced the party’s ‘suburban mindset’ strategy, and its five Outer London ‘battleground boroughs’ – Conservative-controlled Barnet and Croydon, and the currently hung Harrow, Merton and Redbridge.

The latter are the proverbial low-hanging fruit. In HARROW Labour actually won a majority in 2010, but then, as described in a blog at the time, lost it through splits and defections, handing control to the current Conservative minority administration.  In MERTON it took minority control, strengthened it through Conservative defections to UKIP, and achieved a good result in last summer’s Colliers Green by-election.  In REDBRIDGE the Conservatives and Lib Dems signed a partnership agreement just as their leaders were doing the same at Westminster. In all three boroughs Labour will be aiming for majority control, in Redbridge for the first time ever.

In CROYDON the Conservatives narrowly retained a 4-seat majority through an electoral system rewarding nearly 19% of Lib Dem voters with no councillors at all. Here too a modest swing would give Labour an equally workable majority, and more than justify the party’s decision to employ a full-time agent.

BARNET, though, seems an altogether tougher proposition. Numerous issues have incensed residents – from the ‘One Barnet’ mass privatisation of council services, through the closures of libraries and children’s centres and the scrapping of sheltered housing wardens, to the ever-contentious increased parking charges.  But Labour has never won more seats than the Tories, and to do so would require a nearly 10% swing plus the Lib Dems clinging on to their three very marginal Childs Hill seats.

Labour’s last listed London target is the TOWER HAMLETS mayoralty, held by the controversial Independent and Labour expellee, Luftur Rahman.  Opponents have accused him of everything, from dubiously selling off and granting planning permission for the hotel conversion of the listed Poplar Town Hall to trying to buy his own re-election, but little of the mud really seems to stick and it may, if anything, boost his support. Panorama recently had a go, following which Eric Pickles sent in his inspectors – though not to report back until well after the May elections.

The other four mayoral contests all involve incumbents who were elected in 2002 and are now seeking their fourth consecutive terms: Jules Pipe (Hackney), Steve Bullock (Lewisham) and Robin Wales (Newham), all Labour, plus the Lib Dem Dorothy Thornhill in WATFORD. All four have their policy initiatives and successes, but only Thornhill can claim in addition to have totally recast the politics of her town and council.  Watford in 2002 was an apparently permanently Labour-run town. Yet its voters chose as their mayor a Lib Dem councillor and assistant head teacher, whose party coattails have since transformed the council chamber to the extent that two-thirds of members today are Lib Dems.

Returning to London, with the Lib Dems’ local election performance having collapsed almost as grimly as its national poll ratings, the party’s two majority-controlled London boroughs are bound to be under scrutiny. SUTTON they’ve held since 1990 and, although they lost one councillor to Labour, arithmetically at least they look safe for another term. In KINGSTON UPON THAMES, though, with one councillor resigning to sit as an Independent, plus a lost by-election following their disgraced leader’s imprisonment, their 2010 six-seat majority now hangs on a single seat – and on the hope that UKIP may take votes from the Conservatives in the right places.

The other all-out elections are those caused by boundary reviews, two resulting in slightly enlarged unitary councils and two in smaller district councils. MILTON KEYNES has been run in the recent past by all three major parties, and since 2011 by a minority Conservative administration.  Labour will be aiming to become at least the largest party on the new, enlarged council.  SLOUGH, it is totally safe to say, will continue to be Labour. In THREE RIVERS the Lib Dems will seek to maintain the majority control they’ve held since 1999; and in HART Labour will be wistfully recalling when it last won even a ward – in 1976.

Of the 36 metropolitan boroughs, Labour already controls 29 and so has little need of a target list here. Of the two Conservative councils, TRAFFORD looked the more vulnerable even before the recent shock resignation of Matt Colledge as both council leader and councillor. Having reduced the Tories’ majority to 3 in a recent by-election, Labour will hope to win its own for the first time since 2003. The SOLIHULL Conservatives look securer, partly because their principal challengers, the Lib Dems (now 9), have been defecting to the Greens (now 7), who will be seeking to supplant them as the official opposition.

The West Yorkshire trio of Bradford, Calderdale and Kirklees have all been hung since at least 2000, but this could be about to change.  In BRADFORD Labour’s 2012 hopes of turning its minority control into a majority were thwarted by the coattails effect of George Galloway’s parliamentary by-election victory for Respect. The coattail councillors all resigned last October to become Independents, and Labour should make it this time.

KIRKLEES and CALDERDALE travel in parallel. Five years ago, both boroughs were run by Conservative minorities, which were replaced by Labour-Lib Dem coalitions, which were succeeded in turn by Labour minority administrations. In both boroughs all three main parties have groups numbering at least double figures – a measure of the difficulty any one party has in trying to win an overall majority. Arithmetically Kirklees looks the more attainable for Labour, but the party would probably have to take seats from the Conservatives, Lib Dems and Greens. In Calderdale, in the wards being defended that require swings of less than 10% to change hands, Labour is unlikely to be the chief beneficiary, having finished in second place in 2010 in just three to the Conservatives’ ten.

In STOCKPORT, the Lib Dems now have only minority control of their metropolitan flagship, and are defending 12 of their 29 seats. Labour is the leading opposition, but, having finished second in only two of them in 2010, its gains may be limited. Already the largest party in WALSALL, its chances should be better. If it won the same wards as in 2012, but without this time losing a couple of others to Independents, the party could gain majority control for the first time this century.

game

Chris Game is a Visiting Lecturer at INLOGOV interested in the politics of local government; local elections, electoral reform and other electoral behaviour; party politics; political leadership and management; member-officer relations; central-local relations; use of consumer and opinion research in local government; the modernisation agenda and the implementation of executive local government.
The Great NHS Robbery – and the great fraud headline con

Chris Game

Some social phenomena are exceptionally tricky to measure: the black economy, white-collar crime, illegal immigration.  So when someone claims to have done so, no matter how flaky their findings, they attract huge, and largely uncritical, media attention. Like last week’s excitement about the scale of NHS fraud.

The catalyst was a Panorama programmeThe Great NHS Robbery – that needed some pre-transmission headlines. The programme consisted mainly of specific cases of GPs, dentists, pharmacists, private contractors and suppliers who’d been found guilty of defrauding the NHS. It alleged that the Government’s official NHS fraud figure of £229 million p.a. is a huge under-count or under-estimate, and suggested that, having cut the staffing and budgets of NHS Protect and other fraud investigators, the Government was turning a proverbial blind eye to the scale of the problem, especially by comparison with the increased resources it allocated to the detection of the much smaller quantum of benefit fraud.

Old cases and political sniping, however, don’t make major headlines. What Panorama needed were some seriously big and scary figures, and fortunately there were some to hand – just down the M3 at the University of Portsmouth’s Centre for Counter Fraud Studies (CCFS). By happy coincidence, the CCFS was about to co-publish, on the very same day as the first showing of The Great NHS Robbery, a report analysing, as the programme put it, “the most rigorous data on health care fraud in the world”, and containing some “staggering” findings for the NHS.

The BBC had its headlines“NHS fraud and error costing the UK £7 billion a year” – and Panorama had its audience. Other contemporaneous media headlines were all apparently taken either from the BBC’s plug story or the programme itself. Some were fractionally more cautious, like The Guardian’s “NHS fraud could be as high as £5 billion a year, says former health service official”; others less, like the Nursing Times“Fraud costs NHS £7 billion – enough to pay for 250,000 nurses”.

None of the authors, it seemed, went to the CCFS report to check how the loss figures were arrived at and what they represented – possibly imagining that a global report on such a complex and technical topic, representing the product of several years’ research, would be vast, probably undownloadable, and incomprehensible to the average reader.

Interestingly, though, it’s none of these things. The Financial Cost of Healthcare Fraud 2014: What data from around the world shows runs to just 16 pages, including the two covers. The rest comprises: Contents, Foreword, three prefaces, three pages about the authors and publishers, a full-page picture, a blank page … and a 4½-page ‘report’. There are no “data from around the world”, so, even with the glossy pictures, you could, if you wished, download it in about a second.

However, to save you having to plough through all 4½ pages yourselves, let me take you through the methodology step by step.

1.  Do a literature review of the 92 studies of healthcare fraud and error losses that you’re  able to find that have been undertaken since 1997 – not ‘globally’, but in languages you can understand: the UK, US, France, Belgium, the Netherlands and New Zealand;

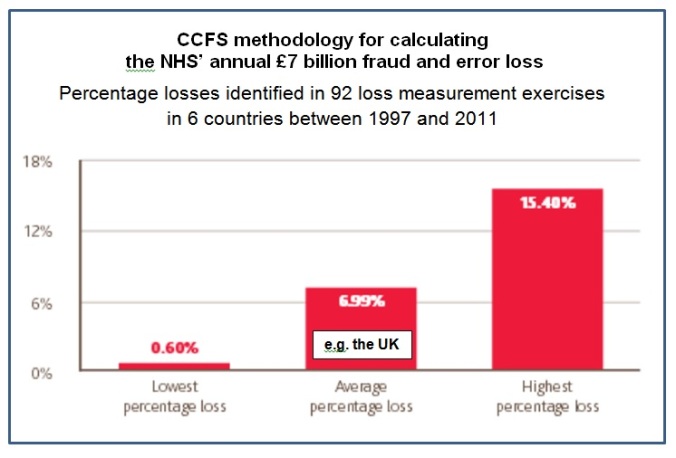
2.  Don’t worry about the studies being in numerous completely different areas of health care, but average out the quoted financial loss figures in all 92 studies and cite that average with real authoritative precision – i.e. not 7%, but 6.99% – because, remember, these have to look like “the most rigorous data on health care fraud in the world”;

3.  Globalise your ‘research’ by finding a figure for global healthcare expenditure for some recent year (no, not ‘global’ as in your six countries, but really global) – say, $6.97 trillion for 2011 (or £4.48 trillion) – and again don’t worry about whether they’re US or International $$ or what the figure actually represents, for this is one of those footnote- and reference-free reports;

4.  Divide (3) by (2), and again state the sum with great precision: that this shows that £313 billion is being lost by the world’s healthcare services each year – or 25% more than when you last did the sum in 2008;

5.  Guess – because you’ve apparently no evidence one way or the other – that the financial integrity of the NHS is probably about average for the six countries you’ve studied, and assert that it is therefore losing 7% of expenditure each year – or £7 billion out of its roughly £100 billion total – in ‘fraud and error’, making sure, of course, that you emphasise the fraud bit.

6.  Add a little diagram, as shown below with the addition of my clarification of where the UK figure comes from.

game graph

I must confess at this point to having misled you a little. I mentioned that the report contains no “data from around the world”, and indeed there are no figures for the UK or any other individual country.  The £7 billion came in the Panorama programme, from one of the report’s two principal authors, Jim Gee. Gee is the former health service official referred to The Guardian’s headline: former CEO of the NHS Counter Fraud Service and now Director of Counter Fraud Services at BDO LLP – not, sadly, the British Darts Organisation, but Binder, Dijker, Otte and Co., an accountancy firm specialising in anti-fraud services – and Chair of the CCFS at the University of Portsmouth. Gee left it to the programme’s presenter to add that “he puts more than £5 billion of that £7 billion down to fraud, rather than financial error” – which explains the other part of The Guardian’s headline.

Though certainly not on the same scale as its undercover filming of LSE students in North Korea, Panorama’s decision to rest the central argument of this programme on such flaky statistics, produced at least in part to further the interests of a self-promoting business services company, seems to me another clear editorial misjudgement. Certainly it irritated me when I pieced together the above account and realised that in effect I’d been conned.

Much more importantly, though, it must in anything other than the short term undermine, rather than substantiate, the key points the programme was seeking to make: that the way the Department of Health currently measures and estimates NHS fraud is grossly inadequate and damagingly misleading; that governments, and this Government in particular, see it in their interests to under-record the scale of fraud (and financial error, for that matter); and that more, rather than less, funding should be being invested in fraud detection and inspection services.

The sad truth is that Panorama seized on CCFS/BDO’s £5 to £7 billion because there was nothing better or more accurate available. Jim Gee’s ‘methodology’ suggests to me that he’s probably underestimating global healthcare financial losses and overestimating those of the NHS, but neither I nor the Government have any way of officially demonstrating it. Nor is there any likelihood of the Government, since it is substantially in denial, embarking on a programme to reduce the losses by up to the 40% within 12 months that Gee, wearing his BDO hat, considers feasible. I doubt if many others agree, but, to adapt the proverb: in the land of the dataless, the one-figure man is king.

game

Chris Game is a Visiting Lecturer at INLOGOV interested in the politics of local government; local elections, electoral reform and other electoral behaviour; party politics; political leadership and management; member-officer relations; central-local relations; use of consumer and opinion research in local government; the modernisation agenda and the implementation of executive local government.