Chris Game
You’d not have known it from the national media, either before Election Day or since, but the 650 parliamentary contests weren’t the only ones taking place in the UK last Thursday. It was the year in local government’s four-year election cycle that almost all English district and unitary councils – 279 of 293 – had elections, and there were votes too for six mayors, for many parish and town councils, plus the odd local referendum.
There were no council elections in London, Scotland or Wales, but English voters – many doubtless to their surprise – were confronted by up to five ballot papers. Those in Bedford, for example, had votes for an MP, a mayor, two borough councillors, up to 11 parish councillors, and a referendum on their Police and Crime Commissioner’s proposal to increase Council Tax – the first ever of its kind. The proposal – specifically for a 15.8% increase in the Police and Crime Commissioner’s portion of council tax – was rejected by nearly 70% to 30%: Yes 91,086; No 207,551.
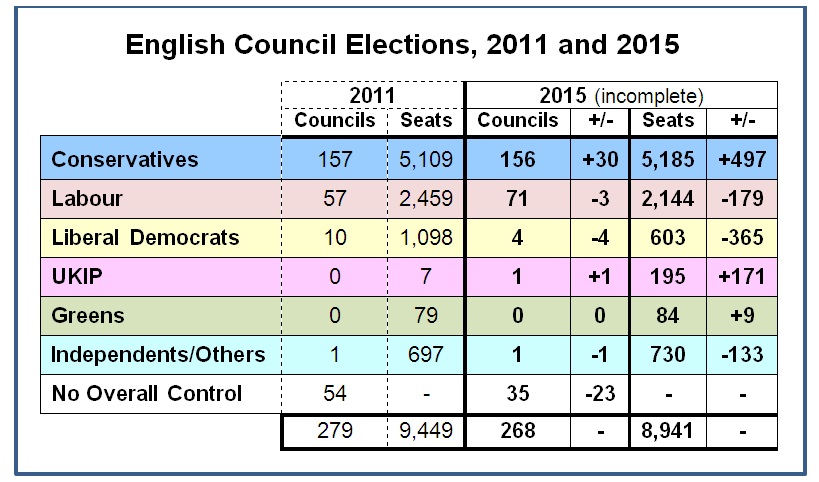
These multiple ballots offered electors the obvious opportunity for split-voting: one for their MP or national government, and another more personal, local or protest vote. Minor parties and independents in the council elections could be expected to be chief beneficiaries, but, as shown in the nearly complete results table, that was another ‘expert’ prediction largely confounded.
9,500 local elections are even trickier to predict than 650 parliamentary ones, and few are daft or brave enough to try. Those who do will start from the baseline of four years ago – 2011 here – when these actual seats were last fought, compare that year’s results with current national opinion polls, and hope.
2011 was surprisingly good for the Conservatives, a year into their far from popular Coalition with the Liberal Democrats. They gained votes from disaffected Lib Dems, and the coinciding electoral reform referendum galvanised their own supporters. This time, though, the national election effect was expected to boost the turnout of Labour and Lib Dem voters.
The poll standings of both main parties had dropped significantly since 2011. But, with the Conservatives the more damaged by UKIP’s dramatic rise, and defending twice as many seats as Labour, the latter was predicted to make most net gains, with the Lib Dems not suffering “too badly” in losing perhaps “around 50 seats”.
If these predictions echoed those for the General Election, then so did the outcome. The Conservatives were unambiguous winners of these local elections, Labour not just net, but absolute, losers, and the Lib Dems suffered as painfully as they did nationally. UKIP made progress, but less than it hoped, and the Greens flatlined.
For the Conservatives, their more than 30 gains – mostly, it should be noted, councils previously under arithmetically No Overall Control – will take the local headlines. Two particularly satisfying results, though, will be the retained control in their only two metropolitan boroughs – Solihull and Trafford – both with additional seats. Solihull Greens lost a seat, but, with the Lib Dems losing two, they are still the official opposition.
Conservative unitary council gains include Basingstoke & Deane, Poole, and Bath & North East Somerset, where there are now two Greens, but 14 fewer Lib Dems and a first-time Conservative majority. Districts won include traditionally Independent Babergh, Suffolk, also for the first time in its 41-year history; Amber Valley, Gravesham and North Warwickshire straight from Labour; Hinckley & Bosworth from the Lib Dems; Gloucester, St Albans, Scarborough, Winchester, and Worcester.
Further Labour losses to No Overall Control included Walsall metropolitan borough and the unitaries, Plymouth and Stoke-on-Trent. There was a little compensation perhaps in hanging on to a knife-edge majority in Bradford, thanks to Independents, UKIP and Respect all losing seats, and gaining majorities in unitary Stockton-on-Tees, and, after a suspended recount and overnight rest, Cheshire West & Chester.
Labour is also now largest party on Brighton & Hove council, since 2011 the UK’s first to be run by the Greens. As in the General Election, the Greens’ recent membership surge didn’t really translate into hard results, though they will be encouraged by seven gains in Labour-dominated Bristol, bringing them within touching distance of official opposition.
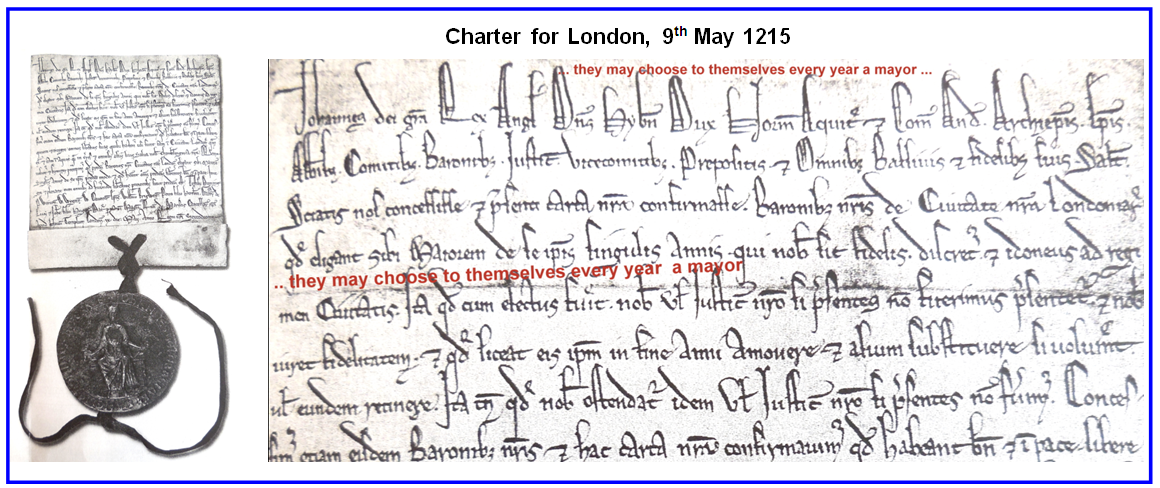
This time UKIP was the history maker. UKIP leader Nigel Farage had failed to become Thanet South’s MP, but his party reduced Thanet district’s Labour councillors from 24 to 4 and, with 33 of its own, won overall control of its first principal council.
Good Lib Dem news was at a premium all weekend, but enough of Bedford’s conscientious voters gave their mayoral ballot paper X to Lib Dem Dave Hodgson to re-elect him comfortably for a third term as the borough’s mayor.
In other mayoral votes, Peter Soulsby was re-elected for Labour in Leicester, Gordon Oliver for the Conservatives in Torbay, and Mansfield’s three-term Independent Tony Egginton was succeeded by his Mansfield Independent Forum colleague, Kate Allsop.
Another Independent, Mike Starkie, was elected as the first mayor of Copeland in Cumbria, while in Middlesbrough three-term Independent Ray Mallon has retired and is replaced by Labour’s Dave Budd – though only after a second preference count and the rejection of large numbers of spoilt ballots, presumably from the many Labour members who, despite the result, want the mayoral system abolished.
In these mayoral elections at least, then, there’s something for almost everyone: Labour, Conservative, Lib Dem, and Independent.
Chris Game is a Visiting Lecturer at INLOGOV interested in the politics of local government; local elections, electoral reform and other electoral behaviour; party politics; political leadership and management; member-officer relations; central-local relations; use of consumer and opinion research in local government; the modernisation agenda and the implementation of executive local government.