Dr Timea Nochta

Promising Artificial Intelligence (AI) tools, most recently the likes of ChatGPT, have created an atmosphere of imminent disruptive change. News outlets bombard us with novel tools and applications that are poised to become the ‘new game in town’, revolutionising various sectors, jobs and ultimately the entire global economy. However, such sensationalist predictions often overlook the complexity of moving from where we are today to working effectively with novel, AI-powered tools in specific, concrete contexts and situations.
AI in the built environment: Digital twins
One such example of a recent hype are digital twins (DTs). Digital twins (virtual replicas) of physical objects or systems have been used for over two decades, most prominently in product engineering and manufacturing. Applications of the technology in the built environment are more recent, and in the UK in particular, the development of digital twins for built environment assets, systems and processes has been triggered by the National Infrastructure Commission’s Data for the Public Good (2017) report. Despite this relatively short history, technology promoters (often suppliers themselves) nowadays pitch the ‘digital twin’ as a ready-made, off-the-shelf data product to city authorities. Further contributing to the hype are various cities who market themselves on the global stage as leaders in digital innovation, and their digital twin projects, including the likes of Helsinki, Singapore, Barcelona, Xiong’an or Herrenberg. In the UK, cities such as Cambridge, Birmingham, Bristol and London have been experimenting with digital twins.
Are urban digital twins better characterised as ‘technology’ or ‘socio-technical innovation’ and why does it matter?
The urban digital twin (UDT) as a technology is often defined as a three-dimensional virtual replica of a city that makes use of a combination of technological innovation in sensors, big data and data science; building and city information modelling (BIM and CIM); and artificial intelligence (AI), machine learning (ML) and automation. At a more fundamental level, it is underpinned by a motivation to create an all-encompassing, single-source-of-truth digital simulation of the city’s built environment which is linked to the physical city via automated bi-dimensional data flows. Whilst the objective may be seen as admirable, there remain a myriad of unanswered questions when trying to unpack the UDT concept from a more practical view, including but not limited to:
- Is the large-scale investment into the digital infrastructure (sensing, data storage and processing, analytics and modelling) justifiable given the expected benefits?
- Is there enough good-quality evidence to suggest that the expected benefits can in fact be delivered in a particular context?
- If so, what conditions might be necessary to enable benefit realisation?
- How does the UDT project affect and/or incorporate urban citizens, communities and other stakeholders?
- How does the proposed UDT fit into the existing landscape of data and digital tools in use?
To local authority practitioners these questions may sound common-sense or even routine. However, taking such issues into consideration essentially represents a move away from the purely technological towards a ‘socio-technical’ understanding of UDTs. From this perspective, UDTs are not off-the-shelf data products as they do not exist independently of the contexts in which they are applied. Ultimately, any digital twin will only ever be a partial representation of a city and its built environment, and therefore there are key decisions involved in designing UDTs for different cities (or regions). Such decisions can identify diverse technology design and/or implementation requirements based on specific, pertinent local policy questions or problems, existing data availability and digital twins (e.g., of energy systems) internally or accessed from other stakeholders, citizen and community preferences or needs, currently existing digital expertise, and so on. This process of developing requirements and solutions for digital twins has been termed ‘digital twinning’ in the literature, with scholars arguing that it represents an ‘act of governance’.
This is not to say that each and every UDT will, or need to be, bespoke. However, neither do UDTs need to be uniform, holistic and all-encompassing from the start – even if this were at all possible. Instead, federated systems of digital twins representing different aspects of cities can organically develop and evolve over time and as needs arise and change.
An alternative conceptualisation of UDTs: Transcending silos
Whilst it may not be possible or desirable to develop all-encompassing, ‘single-source-of-truth digital twins, UDTs nevertheless offer the possibility of linking certain currently siloed policy and governance processes which may benefit from some degree of integration to respond to contemporary challenges. One such example could be the intersection of energy, environment, transport and land-use in support of policy goals relating to net zero transition, affordable housing, mobility and employment – a use case we explored in the context of Cambridge.
Siloed working within and between local and regional authorities led to generic policy goals and targets being translated into conflicting sectoral implementation strategies across development planning (for housing, industry and services), electric charging infrastructure and incentives, and upgrades to the electric grid. Developing solution options to this issue necessitates understanding why different people travel, how and where they travel and therefore when and where they might charge their (future) electric cars.
Addressing it did not require extensive sensor deployment for data collection, or the development of ‘single-source-of-truth’ digital twin technology – instead, we could draw on existing available data (e.g., census and employment data) and models (e.g., land-use and transport models). The research team developed a small ‘module’ which served to integrate previously unconnected models and data sources. The exercise concluded that a potentially impactful policy option would be to offer incentives for charging at home and/or disincentives for charging (and/or parking) at workplace for electric car drivers, given travel patterns, the locations of housing, services and employment centres, and electric infrastructure upgrade needs and costs.
Conclusion: Working effectively with digital twins?
So what does such a socio-technical perspective imply in terms of working with UDTs in (local) government? Working effectively with digital twins may, in fact, require more collaborative working both across and between local and regional authorities, as well as with technology and data product designers – as opposed to joining the digital (twin) hype. Collaboration can also contribute to learning and skills development, beyond technology design. Re-establishing some specialist technical competencies through extensive collaboration (which may have been lost in local government in the last few decades) can in turn help developing confidence and competence in commissioning digital (and/or AI-powered) tools, and understanding the impact and implications of their adoption.
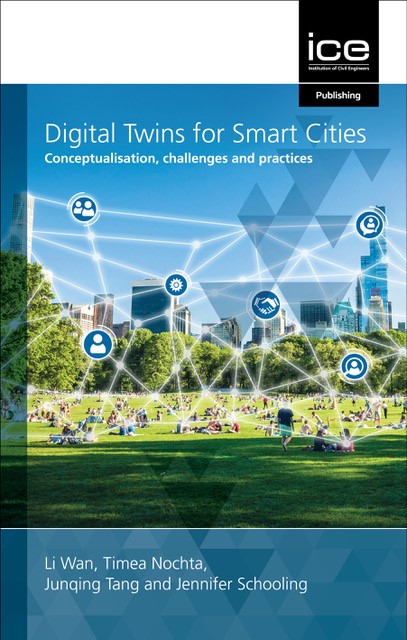
If you have any comments or would like to discuss any of the above, please feel free to get in touch via email ([email protected]). If you would like to read more on using a socio-technical perspective to design and implement digital twins for cities, or explore other use cases, you may wish to consult our recent book on Digital Twins for Smart Cities: Conceptualisation, Challenges and Practices.
Timea Nochta is a Lecturer at the Institute of Local Government Studies (INLOGOV) in the Department of Public Administration and Policy, at the University of Birmingham. Her research focuses on networks and governance in urban policy and implementation in the context of technological change, especially decarbonisation and digitalisation.