Women in local and national governance: the balance (at least in the UK) has shifted

Chris Game

One thing I’d expect most of this blog’s readers broadly to agree on is that UK ‘local’ government should really be given what grammarians call doubt quotes. It ceased long ago to be meaningfully local, decades before the next generation of county-based levelling-up deals.

So, I thought, where better to start this International Women’s Day (IWD) overview of women’s elected presence in local and central governance than at the other extreme: Barbuda, the alphabetically secondary part of Antigua and Barbuda, the Caribbean country comprising these two Leeward Islands plus several enticingly named even smaller ones: Great Bird, Prickly Pear, etc.

Constitutionally almost just like us, A & B is a unitary, parliamentary, representative democratic monarchy: a two-House Parliament, with only the lower House directly elected, but Labour faring rather better than they have done here lately. Here’s the thing, though. The two main islands are wildly unbalanced – Antigua with over 97% of the nearly 100,000 population, Barbuda barely 2%.  Yet Barbuda is the one, for 45 years now, with the local democratic smarts: its directly elected Barbuda Council.

The island of Antigua is run by – yes, you guessed – ‘The Ministry’; in this case MESYGA, the Ministry of Education, Sports, Youth and Gender Affairs. Barbuda has not only its elected 11-member Council, but, as you’ll see from its Barbudaful website, a majority of women members and a woman Chair.

Such councils anywhere are rare, which is why – I could sense you wondering – Barbuda’s is deservedly up front on IWD, or in UoB’s case the start of International Women’s Month.  And the remainder of this blog will draw on some of the other amassment of data in surely THE most fitting sourcebook for the day.  Entitled, with needless modesty, a ‘Working Paper’, it’s UN Women’s  Working Women’s Representation in Local Government: A Global Analysis, authored chiefly by Ionica Berevoescu and Julie Ballington, published December 2021 – and it’s a treasure trove.

The overview of new local-level data that ideally should constitute the core of this blog is inevitably pretty summary, but needs to be made even more so by at least a brief reference to the subject’s overall political context and importance. Women’s rights to equal political participation at all levels of government have for the past quarter-century been variously asserted, affirmed, and endorsed in proclamations of international goals, most importantly in the 2030 UN Agenda for Sustainable Development Goals (SDGs) – Target 5.5 being to “ensure women’s full and effective participation and equal opportunities for leadership at all levels of decision-making in political, economic and public life” (emphasis added).

It’s that new indicator – extended to women’s representation in the world’s local governments, or at least 133 of them in early 2020 – that this blog was going to be primarily about.  It got kind of overtaken, though, by the even bigger question: Are women worldwide, as has long been the case in Britain, better represented in local than in national governments?

Given the nature of local governments’ usually major service responsibilities and expenditures, my personal feeling was that it would be rather regrettable if they weren’t – the more so if I was wrong on the UK figures, and, instead of simply getting closer by the year, they could be shown statistically finally to have crossed over.

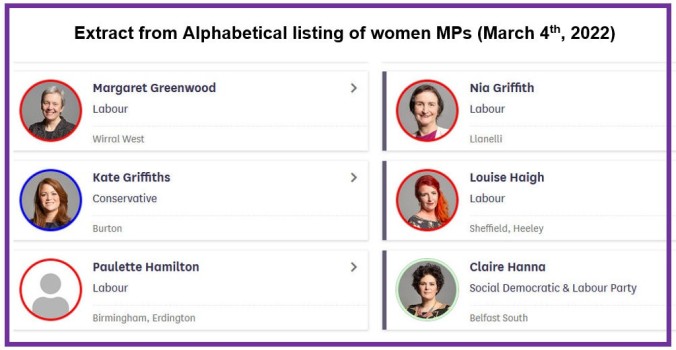
SPOILER ALERT!  However, since, and probably even before, last Thursday’s Birmingham Erdington parliamentary by-election – in which Labour’s Paulette Hamilton became the seventh woman victor in this Parliament’s eight by-elections and the fifth to replace a male predecessor, bringing the total of women MPs to a record, and statistically significant, 225 – I WAS wrong.

p1

Here’s how. Thanks to the Inter-Parliamentary Union’s annual tabulations, we’ve been able to track that part of the international picture for decades.  In the 1990s the top women-friendly countries were notably Euro-dominated, though with no help from us.  In !997, for instance, the only five Lower Houses internationally to have more than 30% women memberships were Sweden, Norway, Finland, Denmark and the Netherlands. New Zealand, the Seychelles, Argentina and Mozambique were trying, but the UK was down in an embarrassing 50th place and unable to manage even double figures. Ahead, admittedly, of France and Greece, but that was about it.

Ten years on, thanks considerably to the arrival of variously legislated or voluntary gender quotas, the overall picture had improved, and Rwanda had crashed the 50% barrier, with 45 (56%) women in its 80-seat Chamber of Deputies. Cuba and Argentina were over 40% … and the UK, though still just ahead of France, was down to 60th, struggling now to reach 20%.

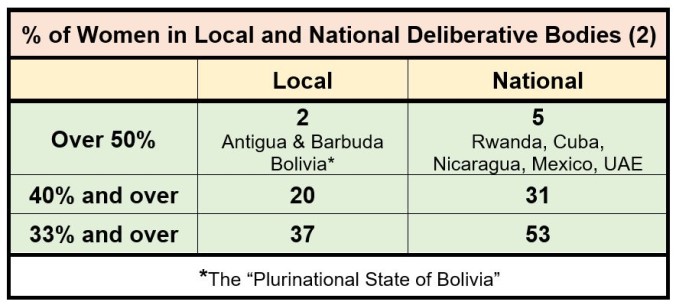
Today – or, more precisely, in last month’s IPU Parline rankings – the global picture has become more variegated still. The top 15, with around 45% or more women, currently comprise five countries from each of Europe (Iceland, Andorra, Sweden, Finland, Norway) and Latin America (Cuba, Nicaragua, Mexico, Bolivia, Argentina), two African (Rwanda, of course, and South Africa) and one each from Asia (United Arab Republic), Australasia (New Zealand), and the Caribbean (Grenada).

And the UK?  Up to a hardly glorious 45th alongside Dominica – with just over the one in three, which at least is better than the House of Lords’ 28.6%.

So … the big question was: Is our local government today – still, as always hitherto – more gender representative than our national elected legislature?

As you may sense, I wasn’t bringing absolute researcher detachment to this exercise. It was posed in the hope/expectation that it would prove to be what Latin scholars call a ‘nonne’ or affirmative question, expecting the answer ‘Yes.’  Of course there’d be a higher proportion of women councillors than women MPs – wouldn’t there?

I knew the 2019 General Election stats: 220 women MPs, including, obviously for the first time, majorities of both Labour and Lib Dem Members. Congrats, obviously, to them, but, with the Conservatives’ massive majority comprising under a quarter of women, local government would still have at least a narrow percentage lead – wouldn’t it?

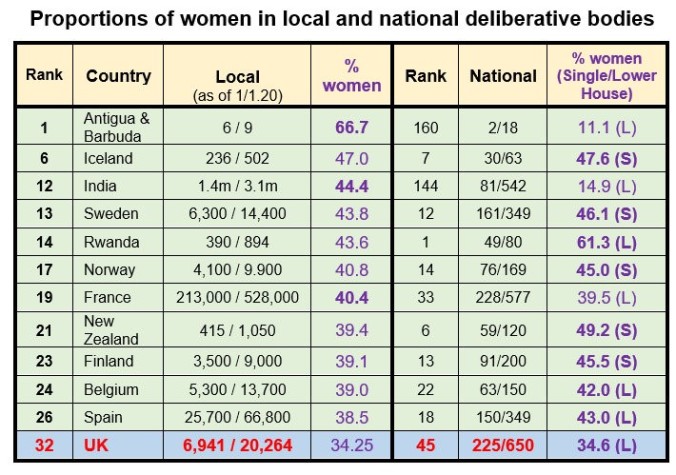
But then began, as noted above, the striking trend of victorious women by-election candidates replacing former male MPs, and when Paulette Hamilton did her thing last Thursday, I was getting seriously nervous.  225/650 is 34.6%; rounded up becomes 35% – an all-time record, which is obviously a ‘good thing’, but worryingly close to what I reckoned the local government figure to be.

To cut a potentially tedious story short: if, as we relatively rarely do, we compare the whole of UK local government – as opposed to that of England, or sometimes England and Wales – it currently makes the decisive difference.  For the first time, authoritative, genuinely compiled and comparable statistics showed there to be proportionately more women MPs than women councillors.

p2

I shall now retire gracefully from this particular field of research and address something perhaps more rewarding – like whether being a plurinational, rather than merely multinational, state somehow boosts women’s electoral prospects.

p3

Photo

Chris Game is an INLOGOV Associate, and Visiting Professor at Kwansei Gakuin University, Osaka, Japan.  He is joint-author (with Professor David Wilson) of the successive editions of Local Government in the United Kingdom, and a regular columnist for The Birmingham Post.

Being Young in Local Government

Councillor Christopher Burden

Image: risingthermals https://www.flickr.com/photos/risingthermals/50047900938/in/album-72157714745761933/

According to the Local Government Association, the average age of a Councillor is 59, with only 15% of Councillors being under the age of 45. Nationally, 88% of Councillors identify as straight. Being a young gay councillor brings with it a dual status. Not only are you an elected official, but you also become an item of curiosity.

Six months ago, I never laboured over my identity. I was who I was and questioning this self-perception never crossed my mind. But upon election, I found the world questioning that status. Briefly, I ceased being “Chris Burden” and became a nameless entity. “The Youngest Councillor”. “The Gay Councillor”.  Concepts which were previously unspoken facets of my personality, were now my entire self. This change began while I was on the campaign trail.

Getting selected as a candidate was my first experience of the battleground of local politics. Independents don’t need to face this process, of course, but the vast majority of Councillors in the UK are party political except for notable exceptions in places like Stoke on Trent or Middlesbrough. It was here I encountered the first resistance about being young and in politics.

“Do you think that you possibly understand politics at your age?”

“Won’t you be too busy with University?”

“Will people actually vote for a person younger than them?”

To an extent they’re simple valid questions. Equally, they have simple and valid answers. Yes. No. Yes. There is a distinct Wulfrunian brashness in my response. Although this stems from a fundamental and irrevocable simplicity. Young people, just as any other community, deserve to be represented in their local areas.

Selections are a curious process in local government and effectively form the first experience of gatekeeping in the sector. Candidates aren’t necessarily rewarded or encouraged for their dedication, skill, or contribution, but rather their popularity or experience. This will vary from party to party, but the general trends are pervasive. These aren’t job interviews, in which the best candidate gets the job, but rather the candidate who is most able to convince the panels are the ones who succeed. Those who have lived long lives, or previously held positions are naturally endowed with the advantage.

This is the void where the sector must intervene to encourage youth participation and progression within political structures. Parties and councils more broadly must increase their programmes of support for those seeking election. The “Be a Councillor” programme from the LGA is an exceptionally good start, but is implemented with vast differences around the country, and does little to tailor exposure or training to poorly represented groups. As with many industries there exists a fundamental roadblock. Those who have the knowledge to look for this support, are broadly those who are less in need of the support. Professionally, I started my career in the classroom, teaching French and German. It’s here that we need to instil democratic values, but to also promote the value of local government and representation. Local government influences every facet of young people’s lives, from schools to youth centres, yet they aren’t taught to understand it as a political element. Is it any wonder that youth participation in local democracy is weak?

For those young people who do want to seek election, it’s an immensely rewarding field, providing a whole host of new and transferable skills. Even candidates who do not succeed in election learn an enormous amount about political communication and local government operations. I’ve been elected for five months and I’ve already been able to make an impact on the lives of ordinary people. High-level impact like adjusting the council home inappropriately adapted for a disabled resident, all the way down to low-level issues like supporting local charities to engage with social media. Local government is a field in which your impact can be immense, and everybody has something to give.

It hasn’t been an easy journey, and there’s challenges around every corner. But that’s exactly why we need more young people in politics. The West Midlands Growth Company estimates that 32% of the population in the West Midlands is under the age of 25, yet we could not say the same thing about our Council Chambers and Civic Centres. The lack of youth representation directly translates to a lack of understand of youth issues within politics, both locally and nationally.

Why do students find themselves at the mercy of rogue landlords?

Why is the night-time economy so poorly managed? Why are youth engagement services emaciated?

The answer is simple. When the service users are not represented in power, those making the decisions fail to recognise their impact. Young people have vital positions which they should be taking up within local government. They should be taking seats in council chambers up and down this country, and they must be supported in their ambitions to do so.

Chris Burden is the youngest councillor elected to City of Wolverhampton Council, and a University of Birmingham Alumnus. He is currently completing a PhD at Aston University, where his research concerns voting intention trends within the British and European young community.
@WulfrunianChris

Voter ID:  proceed with caution

Jason Lowther

There is much to welcome in the Government’s Elections Bill which completed its second reading last month and is being scrutinised by the Public Bill Committee over the next few weeks.  There has been widespread welcome to elements to clarify what’s meant by “undue influence” on voters, improve poll accessibility, prevent the intimidation of candidates and require all paid for digital political material to have an imprint.  But the measures to introduce voter ID need to be handled with care.

Under the Bill, voters will be required to show an approved form of photographic identification before collecting their ballot paper to vote at a polling station for UK parliamentary elections in Great Britain, at local elections in England, and at Police and Crime Commissioner elections in England and Wales. A broad range of documents will be accepted including passports, driving licences, various concessionary travel passes and photocard parking permits issued as part of the Blue Badge scheme. Any voter who does not have an approved form of identification will be able to apply for a free, local Voter Card from their local authority.

Chloe Smith, Cabinet Office Parliamentary Secretary, argued in 2019:

Electoral fraud is an unacceptable crime that strikes at a core principle of our democracy—that is, that everybody’s vote matters. There is undeniable potential for electoral fraud in our current system, and the perception of this undermines public confidence in our democracy. We need only to walk up to the polling station and say our name and address, which is an identity check from the 19th century, based on the assumption that everyone in the community knows each other and can dispute somebody’s identity…Showing ID is something that people of all backgrounds already do every day—when we take out a library book, claim benefits or pick up a parcel from the post office. Proving who we are before we make a decision of huge importance at the ballot box should be no different.

Whilst concern about voter fraud is generally low in the UK, Electoral Commission research in 2014 identified some local areas where there appears to be a greater risk of cases of alleged electoral fraud being reported.  Generally these areas were limited to individual wards within 16 local authority areas (out of just over 400 across the UK as a whole).  These areas were often characterised by being densely populated with a transient population, a high number of multiple occupancy houses and a previous history of allegations of electoral fraud. 

The Electoral Commission asked national and local organisations, including those representing people with protected characteristics under the Equality Act 2010, to provide evidence of how the proposals for Photo ID affected the specific groups they represent.  The results showed significant concerns.  Charities representing people with learning disabilities, the BAME, LGBT+, gypsy and traveller communities and people without a fixed address raised general concerns that some of the people they represent are already less likely to register and vote, and they are also less likely to have ID.  Many of the responses highlighted existing difficulties their users face in accessing services requiring proof of identity, including barriers faced by people who don’t have easy access to the internet. 

Photographic voter ID has been used in Northern Ireland since 2003, and at the May 2019 local elections, ten local authority areas in England agreed to run pilots.  Interestingly, three of the ten pilot areas were in the Electoral Commission’s list of higher risk local authority areas referred to above.  There were different arrangement according to three models: In two areas, people had to show a specified form of photo ID.  In five areas, they could choose to show either a specified form of photo ID or two pieces of specified non-photo ID.  And in three areas people could show either their poll card or a specified form of photo ID.  The mixed ID model and the photo ID model both had a provision for free, locally issued ID available from the local authority, if electors did not have the required form of ID.

The Cabinet Office’s internal evaluation of the pilot declared the 2019 pilot “another success”.  The evaluation aimed to assess the pilots against measures of integrity (perceptions of the voting process, and of electoral fraud), democracy & equality (awareness, voting behaviour), delivery (planning and resource implications), and cost.  Some may feel that generalisability of the conclusions are limited by the range of local authorities volunteering to be involved not being representative of the country as a whole (table 1). 

Table 1: 2019 pilot authorities

Source: Cabinet Office evaluation report, p.7

The Cabinet Office concluded that the photographic ID model had the most pronounced impact on the measures of integrity, with a significant increase in voter perceptions that there are sufficient safeguards in place to prevent electoral fraud at polling stations (differences in the mixed ID model were not significant). The proportion of people who did not return to the polling station varied by model, but the evaluation argues that across all models this accounted for under 0.5% of those who were checked at polling stations, the report notes ‘there are some indications that the mixed ID model was accessible for electors, particularly in more demographically diverse areas’. 

As always, the devil is in the detail.  Looking at the detailed results, the proportion not returning is at least twice as high in the mixed and photo ID samples (up to 0.7% of electors in two councils).  And when you look at individual wards, those with the highest percentage of non returners were often those with relatively high BME populations.  As LGIU pointed out in its analysis of the pilots: ‘Voter ID is not a priority for voters, who are more concerned about low voter turnout, bias in the media, and inadequate regulation of political activity on social media. Only one in four respondents to a post poll survey (24%) said electoral fraud was somewhat of or a serious problem, with more (26%) stating it isn’t a problem’.

The Electoral Commission’s overall conclusion on the pilots was ‘we are not able to draw definitive conclusions, from these pilots, about how an ID requirement would work in practice, particularly at a national poll with higher levels of turnout or in areas with different socio-demographic profiles not fully represented in the pilot scheme.’

The Joint Committee on Human Rights has also considered voter ID, and published its final report in September 2021. It called on the Government to produce clear research setting out whether mandatory ID at the polling station could create barriers to taking part in elections for some groups and how they plan to mitigate this risk effectively.

As outlined in the excellent report on the issue by Neil Johnston and Elise Uberoi of the House of Commons Library, experience in Canada (who introduced voter ID in 2008) showed that ‘a significant minority of voters in Canada struggled to prove their residence address as they lack documents that prove the address used to register to vote’.

Voter ID, of course, is one of a range of measures which Government could take to change election arrangements.  The Missing Millions report made 25 recommendations to enable increased participation, such as encouraging recipients of National Insurance number notification letters to register online, and Government funding and support for a National Voter Registration Drive.  Most polling clerks experience having to turn away electors because their names are not on the electoral roll in the first place, arguably this is a much greater threat to our democracy than the fears of false identities which voter ID seeks to address.

The Government has not yet shown how voter ID will operate in England without adversely affecting certain minority and disadvantaged groups.  Until issues such as costs and access are fully addressed, it needs to proceed with caution.

What? You want to be a senior councillor AND a mother?

Chris Game

Brigid Jones, currently to be seen on YouTube promoting Birmingham City Council’s customer access strategy, and incidentally the city’s bus lanes, is a UoB alumna – though sadly having preferred to study Physics, rather than gain an invaluable early insight into the workings of local government through INLOGOV’s undergrad Public Policy degree.

Happily, she somehow overcame this early career hiccup, was elected as a Labour councillor to Birmingham City Council in 2011, impressively quickly became the Cabinet Member for children, families and schools, and since 2017 has been the Council’s Deputy Leader.

B Jones

It was in that Cabinet role, though – five years ago almost exactly – that Cllr Jones first attracted significant national as well as local attention, by noting that, despite being the “very proud corporate parent” of the nearly 2,000 children then in the Council’s care, accountable for a £1.2 million budget and thousands of staff, if she herself wished to start a family, she – as a councillor with a taxed £25,000 cabinet allowance – had been told she would “most likely have to step down from my council position”.

Because, although the Council’s (male) Chief Executive was reportedly “working on a policy”, it was yet to be considered by the Cabinet, or probably anyone else. The apparent rationalisation – “we haven’t had a pregnant Cabinet member in Birmingham for a very long time” – revealed as much about the recruitment and societal representativeness of councillors as about their financial remuneration.

The CE sounded suitably embarrassed, for, however few UK councils would have been in significantly more considered and supportive positions, for the biggest of them all, that was surely no refuge.  Still, barely 20 months later, the Council produced a policy – not merely, to coin a phrase, ‘oven-ready’, but fully baked.

The Birmingham Post/Mail could report that Birmingham councillors – all councillors, note, not just Cabinet members – “will for the first time be entitled to maternity and paternity pay”. Councillors would continue to receive their basic allowance for at least six months of maternity leave, and senior councillors with additional responsibilities would get 90% of their Special Responsibility Allowance for the first six months and at least a basic allowance up to week 39. Better terms, apparently, than for staff – prompting, understandably, calls for council workers’ maternity terms to be improved too.

Thanks substantially no doubt to Cllr Jones’ work ‘behind the scenes’, Birmingham’s present Members’ Allowances Scheme and particular the Maternity, Paternity and Adoption Pay sections, could, in my albeit limited experience, serve as at least a baseline model for UK councils generally.

A few examples: Members on maternity leave continue to receive full allowances for six months, possibly extendable; adoptive parents ‘newly matched’ with a child by an adoption agency ditto; shared parental leave negotiable for one or two parents, including same sex.

There’s nothing in the Scheme that’s obviously either exceptional or exceptionable – just reasonable modern-day practice for a public organisation conscious of the difficulty it demonstrably has attracting a representative quota of younger and particularly female members.

On the other hand, you may recall the row back in February when the Government rushed through Parliament a law-change allowing Cabinet ministers – specifically the then eight-months pregnant Attorney General, Suella Braverman – to have six months’ maternity leave on full pay plus salary costs for a temporary replacement.

Back at work recently, Braverman was understandably grateful for the uniquely tailored special treatment – unavailable to ‘ordinary’ backbenchers such as Labour MP Stella Creasy, who four months later, like others before her, had had her request for full locum cover for her second child rejected, on the almost too-good-to-be-true grounds that it was “misconceived” – the request, apparently, not the actual child. Either way, she was, as they say, contemplating legal action.

If our national Parliament acts in this rushed, last-minute, blatantly discriminatory fashion, it would perhaps be surprising if local government’s record were strikingly better – and the evidence shows it isn’t.

The good news: statistically overall there appears little explicit Parliament-style discrimination between senior cabinet-level councillors and ‘ordinary’ councillors. Bad news: three-quarters of councils seem to have no councillor maternity/paternity policies at all.  Broadly encouraging news: just two years ago, that three-quarters was 93%.

The statistics come from an admirably comprehensive study based on responses from over 90% of English councils to Freedom of Information requests from the Fawcett Society, the campaigning charity for gender equality and women’s rights.

There seemed no obvious reason why West Midlands councils should be statistically exceptional, and they aren’t. Just two – Birmingham and Wolverhampton – have formal policies in place for maternity, paternity, adoption and kinship care for all councillors. Coventry claimed ‘informal’ policies, Walsall didn’t respond, leaving Dudley, Sandwell and Solihull with apparently no policy at all.

Nationally, roughly a quarter of English councils reported having maternity or paternity policies in place for their ‘ordinary’ and/or senior councillors, perhaps the most positive feature of which figures being that just two years ago they were 7% and 8% respectively.

Some way to go, evidently. And the same – relatedly, the Fawcett Society would suggest – goes for women’s representation on councils generally. Across England as a whole, it found just 35% of all councillors are women – less than a 1% increase since the 2019 elections.

Which means, “at that rate of change, we won’t see gender parity in local councils until 2077 – over 50 years away”.  Hence, it would argue, the importance of maternity and paternity policies, in addition obviously to their intrinsic merits.

However, such projections depend on your baseline.  And, as a seriously boring, nerdy person, I happen to know that exactly 50 years ago, in 1971, the proportion of English women councillors was just 12% [J.Z. Giele & A.C. Smock (eds.), Women: Roles and Status in Eight Countries (1977), p.17].  From which starting point today’s 35% reaches 50% by – wow! – 2055.

Either way, it’s effectively a working lifetime’s wait – and more possibly for some, like the North Yorkshire district with just 3 women councillors out of 30 and an Anglo-Saxon name whose modern-day meaning is ‘lack of courage’: Craven.  The Fawcett study found 10 councils in all with under 20% of women members, the others in ascending order being West Berkshire, Swale, Ashfield, Hambleton, Cherwell, Castle Point, Huntingdonshire, Essex County, and Wycombe.

To finish, though, on at least a relatively high note, these 10 are outnumbered by the 14 councils with over 50% women members, a selection striking too for its obvious diversity. This time in descending order: Brighton & Hove (56%), Cambridge, Islington, Nottingham, East Cambridgeshire, Havant, Manchester, Norwich, South Oxfordshire, Gateshead, Kingston upon Thames, South Kesteven, South Tyneside, and Liverpool.

Which, returning home as it were, begs the question: if councils as diverse as these can achieve 50%+, why is it Birmingham can manage barely one in three? Cllr Jones, your work is far from done!

An earlier version of this blog was published in the Birmingham Post on 23rd September

Photo

Chris Game is an INLOGOV Associate, and Visiting Professor at Kwansei Gakuin University, Osaka, Japan.  He is joint-author (with Professor David Wilson) of the successive editions of Local Government in the United Kingdom, and a regular columnist for The Birmingham Post.

NOC NOC! Is anybody there – or are you all botching each other?

Chris Game

NOC – that’s what this blog’s about.  It’s prompted, like many I assume, by the topic being one the author has a ‘thing’ about – only here it’s two things. There, authorial duty done: you’ve now been warned.

The first ‘thing’, I’m guessing, originated with an enthusiastic primary school English teacher, keen for as many of us as possible to pass the 11+ or ‘grading test’ that would get us into grammar school. Anyway, it was when I probably learnt the crucial distinction between common abbreviations and what most of us interpreted even then as posher/middle class acronyms and initialisms.

Abbreviations – for the benefit, obviously, of non-native English speakers/readers – are simply shortened forms of words: approx, dept, tbs (tablespoon), etc.  Acronyms are the posh, clever ones – comprising the first letters of several words but pronounced as if they are words themselves.

Most famous in these parts is obviously INLOGOV – but not, sadly, the most structurally perfect, which must be CREES.  Outside academia my favourite, because I’d bet even some police users don’t know it, is TASER – Thomas A. Swift’s Electric Rifle.

So, to initialisms, which comprise the first letters of several words, but can’t be (or are bewildering if) pronounced as words themselves – and which are regularly and incorrectly called acronyms.

Like NOC, which – whether referring to a National Olympics Committee, a prescription treatment for scurvy, or, as here, an elected body under ‘No Overall Control’ – is always pronounced, and in the case of the scurvy tablets spelt, ENOCEE.   

The elected bodies are usually councils, but strictly speaking Scotland was under NOC until recently, when the Scottish Greens’ co-leaders became ministers in the Holyrood Government, creating a power-sharing SNP-Green coalition.

It’s true that NOC sounds less alarming than OOC (Out Of Control) would be, but it’s entirely unclear what it does signify.  It’s certainly unhelpful – but worse, I’d suggest, in being a positive deterrent to trying to learn more – in metamorphosing indeed into No One Cares.

As a recent description of Kabul, as Taliban militants seized rapid control from Afghanistan’s civilian government, NOC would for maybe two days max have been fair and accurate. But not thereafter.

Nor when used for months on end apparently to describe the political management and day-to-day running of constitutionally elected UK local government councils. That, I suggest, is both disappointingly unhelpful and misleading.

Immediately following an inconclusive local election, with no single party securing an overall majority of councillors, some uncertainty – even within the council – may be unavoidable. There may well follow perhaps a fortnight’s discussions within and between the various party groups and maybe Independents before the Annual Meeting, at which ‘Who Runs the Council?’ has to be officially determined.

Whereupon there should be public clarity. If previously there hadn’t been, through no single party having an overall majority of councillors, the Council should, surely, officially announce and publicly explain the new situation – the leadership, any agreement/working arrangement between parties, Cabinet composition, and so on – ideally in the local media and certainly prominently (within a couple of clicks) on its own website.

That way it would matter less that the BBC, for instance, can’t be troubled to update its ‘Elections 2021’ statistics or even to footnote news of the actual resolutions of the 29 blackish ‘No Overall Control’ splotches and dots on its English councils map

NOC map

Still, however – and despite my having mentioned it on numerous occasions, not least in these columns – some councils don’t.  And what really p****s – sorry, incenses me is that the process and outcome of these post-NOC negotiations are not just factually informative, but frequently rather more fascinating than the elections that brought them about.

Bear with me, please, while I try to illustrate with the ‘aid’ of said map – or at least reference to it. You will observe three large blackish splotches, which you might imagine would be the three – all geographically large – county councils that have been NOC since at least the May elections: Cambridgeshire, Oxfordshire and Cumbria.

Until you note that the top splotch is on the wrong side: not Cumbria, but Durham, which you may also know ceased being a county when in 2009 it became a unitary.  It did, however, produce surely the most historic result of this year’s ‘large’ authority elections, with Labour losing overall control of the council for the first time in over a century, and being replaced by a barely hyperbolic ‘rainbow’ coalition of the Lib Dems, Conservatives, Independents, and the North East Party – led moreover by the Council’s first-ever female leader, Lib Dem Amanda Hopgood.

So, to the two central England splotches – Cambridgeshire and Oxfordshire County Councils – plus what would have been a third, had Cumbria’s election, like those of Somerset and North Yorkshire CCs not been postponed pending the outcome of already submitted unitary proposals.

In both cases the Conservatives had most councillors following the May elections, but no overall council majority. And in both cases the outcome of post-election negotiations was that the other party leaders and groups felt they had more in common with, or simply preferred working with, each other than with the historically dominant Conservatives.

And something essentially similar would doubtless have happened in Cumbria too, with the council having had a single party in majority control for just four of the past 36 years. So, when someone comes NOC NOCing on the Cumbria House door in Carlisle’s delightfully named Botchergate, they will be met not by rioting, out-of-control councillors, botching each other, but a seemly Labour/Liberal Democrat coalition. 

Likewise in Oxbridge, where they will encounter what tend to qualify nowadays as ‘rainbow coalitions’: comprising in Oxfordshire the Lib Dems (yellow), Labour (red) and Greens, and in Cambridgeshire Lib Dems, Labour and Independents. Doing indeed what voters reportedly tell pollsters they want party politicians to do: work together rather than just shout across the council chamber at one another.

Personally, in case you were wondering, I have ambivalent views about ‘rainbow coalitions’ – the terminology, I should stress, not their existence, which is almost invariably fascinating to observe. I used to reckon that, with rainbows having seven colours, a ‘rainbow coalition’ ought to comprise at least a majority – i.e. four parties or political groups.

The obvious problem, though, is that it restricts the field and would deprive many local newspaper editors of potentially appealing headlines.  By my reckoning – and with possibly excessive reliance on Open Council Data UK – England currently has just seven of these ‘proper’ rainbow coalitions: Durham, Folkestone & Hythe, Lewes, North Somerset, Swale, Waverley, and our own local Wyre Forest. 

Add in three-group coalitions, though, and you almost triple the number, while still lagging well behind the 32 single-party minority administrations and the 28 two-party arrangements. 

It also enables me to fulfil a tiny part of a kind of promise to INLOGOV Head of Department and blog editor, Jason Lowther – to whom I mentioned a round-up of May’s local election results, in the tabulated form I’ve sometimes managed previously, including my patented symbols for ‘rainbow coalitions’. 

For several reasons, including the sheer number of NOCs nowadays, I stalled after the ‘biggies’, but, thanks to the previously described Oxbridge tendency, there are at least a couple of rainbows.

NOC table

______________________

A more West Midlands-focussed version of this blog was published in the Birmingham Post on 9th September.

Photo

Chris Game is an INLOGOV Associate, and Visiting Professor at Kwansei Gakuin University, Osaka, Japan.  He is joint-author (with Professor David Wilson) of the successive editions of Local Government in the United Kingdom, and author of the Local Government chapter in the just published 10th edition of Politics UK (Routledge), about the only surviving sizeable (just the 780pp.) textbook of its kind.

Petticoat Council – cheesy name, historic achievement

Chris Game

Nottingham Castle reopened to visitors recently, after a Covid-protracted three-year closure for what was anyway going to be a pretty extensive renovation. Even unrenovated, the castle has always been a good visit, not least for its exhibitions, which now include an enticingly named Rebellion Gallery, whose current Nottingham-focused displays, curated by University of Nottingham historian Dr Richard Gaunt, comprise the Civil War, the Luddite movement, and parliamentary reform with particular emphasis on women’s suffrage.

For reasons that will become clear, it was the last of these that particularly resonated with me – and one (poorly phone-photographed) bar chart in particular.

While its primary aim is presumably to emphasise the length of the continually frustrated campaign for women’s suffrage, it also showed how, near the start of that campaign, some women – those that “met the property ownership requirements” – actually lost their right to vote during the 1830s.

The otherwise franchise-extending 1832 Reform Act specified ‘male persons’ only, depriving at least small numbers of property-owning women of their parliamentary vote until 1918. And the 1835 Municipal Corporations Act excluded them from local elections – until 1869/70, when unmarried women ratepayers were granted the right to vote in first municipal council and then the new school board elections.

Between those dates, though, and with no confounding documentary evidence, it was widely believed, and taught, even in Patricia Hollis’ ‘bible’ – Ladies Elect: Women in English Local Government, 1865-1914 (Appendix B) – that women lost their voting rights completely, just like the 0%, 0%, 0% on the Nottingham bar chart.

Taught by me too, until a few years ago when I caught by chance a BBC Sounds broadcast describing the discovery of documentary evidence of at least some West Midlands women casting votes in local elections decades before those history books told us the 1869 Municipal Franchise Act legalised it.

The BBC programme described the recent discovery in Lichfield Record Office of an 1843 Poll Book. Compiled apparently for local Conservative Party campaigning purposes, it detailed all voters in that year’s St Chad’s Parish election of an Assistant Overseer of the Poor – the bloke (naturally) with responsibility for outdoor (cash) or indoor (workhouse) poor relief.

And of the 371 voters in that 1843 election …. 30 were women, including one, an evidently very well-heeled Grace Brown, with no fewer than four votes. It was a genuine, history-rewriting discovery – though not in fact the main point of this blog.

For that we must turn to the programme’s presenter: Sarah Richardson, nowadays Professor of History at Warwick University, and author of the then recently published The Political Worlds of Women: Gender and Politics in Nineteenth Century Britain.

Totally relevant, obviously, but Richardson’s even more pertinent role here must surely be one unmentioned in her University profile: longstanding Governor and currently Chair of Governors at Bishop’s Itchington Primary School.

Bishop’s Itchington is a South Warwickshire village/parish south-east of Royal Leamington Spa and about 18 miles from Coventry, which, as we’ll see, is more immediately relevant. It has a lengthy history too, its name combining references to the passing River Itchen and the Bishop of the afore-mentioned Lichfield Cathedral.

In many European countries, and unquestionably in France with its 35,000 communes, even its reduced present-day population of around 2,000 would make Bishop’s Itchington what we would call a principal local authority in its own right, with an elected mayor, a full range of local powers and responsibilities, and significant control of its own funding.

But in a middle England parish council, without even these basics, where, you might reasonably ask, is there the potential even for much passing interest, never mind drama?  To which the answer is: in its elected councillors, and, more precisely, those elected in 1949 to form what became the first female majority council in the UK.

It’s a hefty claim, but, in respect of a village/parish whose primary school Chair of Governors just happens to be a national authority on such matters, pretty authoritative.

Profesor Richardson herself summarises – this time on YouTube.  Edith Chapple-Hyam, Chair of the village Women’s Institute, was fed up with the all-male parish council’s lack of action on issues such as accessible electricity and running water, social housing, policing and speed restrictions, the sewage works, and public spaces, particularly for children.

In short, she and her WI members saw areas like Coventry being built up after the War and wanted a piece of the action.  So, when an election was announced, she and five WI committee members submitted their nominations.

Most of the sitting councillors assumed that, as no doubt regularly happened, the election would go uncontested and they would be re-elected by default.  Only one, therefore, bothered to submit his papers before nominations closed.

He was duly elected, but alongside all six women, who effectively – in both senses – took over.  And now, just the 72 years on, the Bishop’s Itchington story has been both informatively and highly entertainingly dramatised as a ‘folk musical’ and one of Coventry’s UK City of Culture 2021 events.

Entitled ‘Petticoat Council’, I saw it myself recently, and the mix of storytelling, song, dance and puppetry melded together by playwright Frankie Meredith – herself the great-niece of Ivy Payne, one of the six victorious councillors – is a delight, unquestionably worth catching if you ever get the chance.

My sole initial reservation had been the slightly cheesy title, for which I was prepared to blame the Americans, who had instantly labelled a very similar women’s power grab in Umatilla, Oregon back in 1916 a ‘Petticoat Revolution’.

But I was wrong. It apparently came from a local newspaper, reporting in 1952 how the men on the council were plotting to “overthrow petticoat rule”, as “the women have been getting too bossy”. Material for a sequel perhaps?

______________________

A version of this blog, with an accompanying photograph – of the councillors, not me – was published in the Birmingham Post on 15th July under the title The ‘Petticoat Council’ and a slice of Midland History

Photo

Chris Game is an INLOGOV Associate, and Visiting Professor at Kwansei Gakuin University, Osaka, Japan.  He is joint-author (with Professor David Wilson) of the successive editions of Local Government in the United Kingdom, and a regular columnist for The Birmingham Post.