Beyond the Numbers: A Holistic Approach to Section 114 Notices in English Local Government

Dr Philip Whiteman

In English local government, the issuance of a section 114 notice is often perceived as a dire financial omen, signalling a council’s descent into insolvency. While financial stability is undoubtedly a cornerstone of effective governance, it is crucial to recognize that section 114 notices reveal more than just a precarious financial situation. They serve as a beacon, illuminating underlying issues that extend beyond the confines of spreadsheets and budget projections. Either way, the government’s Department of Levelling Up, Housing and Communities (DeLUHC) tends to respond with intervention and the imposition of commissioners to direct the authorities concerned.

The poor financial position of many authorities may be the direct result of years of underfunding by central government and we can expect many more councils to serve section 114 notices, but it would be improvident to assume there are no further underlying causes.

Nottingham City Council’s recent declaration of a section 114 is a clear indication that some authorities are simply folding due to a broken funding formula, but this is not the sole cause of failure in all cases. When looking at other authorities, alternative underlying causes are present. Further examples include:

  • The BBC Panorama programme highlighted how Thurrock Council was rendered bankrupt following a series failed investments in a solar farm, highlighting disastrous procurement practices, lack of accountability, poor governance, and inappropriate delegations to officers.
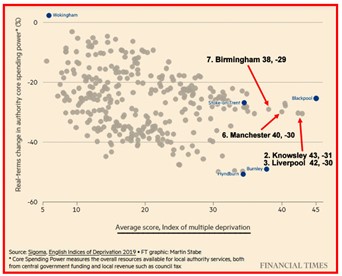
  • Birmingham City Council’s problems did not emerge overnight and were a culmination of challenges created by a historic equal pay-claim and botched procurement a new IT system, Oracle. Underpinning this was poor financial planning, governance, accountability, and a failing internal culture.
  • Woking Borough Council racked up a deficit of £1.2bn following the building and acquisition of major property portfolio. Against these investments, the authority had acquired loans from the Public Works Loan Board and other local authorities, accumulating debts that it could not service.
  • Liverpool City Council’s woes are not confined to finances. Government commissioners were appointed to Liverpool City Council in June 2021 following a damning Best Value inspection by Max Caller CBE on matters pertaining to poor leadership, unacceptable performance, poor resource management and a failure to engage with citizens.

Government appointed commissioners tasked with overseeing councils in financial distress must adopt a holistic approach, venturing beyond the immediate financial crisis to uncover the root causes of the council’s predicament. This requires a comprehensive examination of the council’s structural framework, external environment, performance management and internal governance practices.

Structural Challenges: A Precarious Foundation

English local governments face a unique set of structural challenges that can hinder financial stability. The relentless rise in service demands, coupled with a funding system that often fails to keep pace, places immense pressure on council budgets. This mismatch between resources and responsibilities can lead to a cycle of overspending and financial strain.

Commissioners must delve into the council’s structural framework, assessing whether the current allocation of resources aligns with the council’s responsibilities. They must also evaluate the effectiveness of the council’s revenue-generating strategies, ensuring they are maximizing their income potential without overburdening residents.

External Factors: Navigating Turbulent Waters

Local governments are not immune to the vicissitudes of the external environment. Economic downturns, shifts in government policies, and natural disasters can all have a profound impact on a council’s finances. Commissioners must assess the council’s vulnerability to these external factors, evaluating its risk management strategies and identifying potential contingencies.

Internal Governance: Cultivating a Culture of Accountability

While structural challenges and external factors can undoubtedly contribute to financial distress, internal governance failures often play a pivotal role. Poor financial planning, inadequate risk assessment, and a lack of transparency and accountability can erode a council’s financial stability.

Commissioners must scrutinize the council’s internal governance practices, ensuring that financial decision-making is sound, risks are appropriately assessed, and accountability is firmly established. They must also foster a culture of transparency, empowering residents to hold their council accountable for its financial stewardship.

A Holistic Approach: Beyond the Financial Storm

In the aftermath of a section 114 notice, commissioners must resist the temptation to focus solely on immediate financial stabilization measures. Instead, they must adopt a holistic approach, addressing the underlying structural, external, and governance issues that contributed to the council’s financial crisis.

By adopting a comprehensive view, commissioners can guide councils towards long-term financial stability, enabling them to deliver essential services to their communities without succumbing to the pressures of insolvency. Only by addressing the root causes of financial distress can we ensure that section 114 notices no longer serve as mere harbingers of financial doom, but rather as catalysts for positive transformation.

Speculating on further interventions

Speculation is precisely that. Estimates vary widely in terms of how many further councils are anticipated declare section 114 notices, but a clear signal of further failures exists:

  • In July 2023, ITV News cited a leaked DeLUHC document which estimated at least 26 bankruptcies over the next two years.
  • The Institute of Government has estimated that 10% of councils are at risk over the next two years.
  • The Special Interest Group of Municipal Authorities (SIGOMA), a representative body for 47 municipal authorities, published a survey in June 2023 which showed that five of their members were at risk.
  • A Local Government Association Survey conducted in November 2023 revealed that almost one in five local authority leaders and chief executives believe that their authority may have to declare a section 114 notice.

Whilst estimates vary, there is evidence that further authorities will become vulnerable to government intervention via the imposition of DELUHP appointed commissioners.  This raises a final question; can the predicted number of authorities realistically be serviced?

Birmingham’s contribution to local government numerology

Chris Game

Right – we, meaning I, must start with a dilemma declaration. How to deal with a major national news item – “Birmingham City Council declares itself bankrupt” – the consequences of which, as a long-term Birmingham resident and ratepayer, will affect you personally and about which in the distant past you might well have been invited to opine seriously and professionally. Yes, carry on being retired and/or pretend you’re still on your hols.

Obviously, I’ve chosen an alternative route, emphasising background and context and stuff that might just provide some clarification, or at least updating.  And, if it seems frivolous, tasteless or just indulgent, I apologise. Blame me, not the editor.

I’ll start, as it’s in the intendedly eye-catching title, with numerology – the study of the hidden, divine or mystical meaning of numbers. Even if you’re not into it, you’ll quite likely have come across ‘angel numbers’, aka ‘lucky primes’ – sequences of digits that supposedly bode well and make you feel good. Or, as the ologists put it, messages from the spiritual universe offering insight, wisdom, and directionality – three-digit ‘lucky primes’ usually including 127, 151, 163, 193, etc.

And which bunch of local government personnel, more than most, could benefit from having such character traits built into their job descriptions? Section 151 Officers, of course; aka Chief Finance Officers (CFOs) – those required by Section 151 of the 1972 Local Government Act to arrange and take responsibility for the proper administration of their local authorities’ financial affairs.

Just check out the numerologists. “The energies of number 1 combined with the vibrations of number 5 … a sign from the divine realm that you need to be strong, act as a leader, and be in control of your future life …” etc. etc.

The only problem being that, with a bit of searching, you can get similar hokum for almost any three- or four-digit number. So, somewhat to my disappointment I admit, no fiddling whatever would have been required of the Office of the Parliamentary Counsel – the people who actually draft our laws – to ensure that these matters would be dealt with by Section 151 of the 1972 Act.  Excepting possibly the Satanic 666, which would make the Act impossibly long anyway, almost any three-digit number would have served.  

I knew this back in 2017, but I’ve habitually kept a vague look-out for any published follow-up from my INLOGOV blogs and admit that I was quite chuffed when a few years ago one was picked up and passed on by Room 151 – the “online news, opinion and resource service for local authority Section 151 and other senior officers covering treasury, pensions, strategic finance, funding, resources and risk …”.

Chuffed too to that, albeit over a lengthier time period than I was envisaging, the broad thrust of my argument of more being on the way has proved to be accurate – a somewhat nerdy argument, admittedly, that can certainly be made even nerdier, but that, for current blogging purposes, can also be tolerably summarised in a few sentences.

So here goes!  If a council’s Chief Finance/Section 151 Officer (forever male, of course, in the 1988 LG Finance Act, although Birmingham’s current Interim Director of Finance happens to be Fiona Greenway) reckons his council’s expenditure is likely to exceed available resources, he issues a Section 114 Notice prohibiting any new spending apart from that funding statutory services and existing contractual obligations. OK, geeks, they’re technically ‘Reports’, not ‘Notices’, but that really, really isn’t the serious issue.

It’s a situation in which things are pretty obviously and publicly getting out of hand – current spending way over budget, reserves virtually exhausted, no imminent solution. The alternative, however, is worse: Section 24 of the Local Audit and Accountability Act 2014, or washing your dirty linen in public – the council’s EXTERNAL auditors appending a Section 24 ‘Recommendation’ to their Annual Audit letter, “copied to the Secretary of State”.

Which may sound chummy, but, I suggested, was “the bullet-shaped chumminess of a Mafia ‘message job’”: very nasty, and rarer even than 114 Notices – historically. Yet – and this is what prompted that 2017 blog – in the space of two months two Section 24s had been issued, to councils at the very extreme ends of the council scale spectrum: the Scilly Isles and Birmingham, the latter’s then Labour Leader, Cllr Sir Albert Bore, describing it as “the most concerning audit letter” he’d seen in his 36 years as a councillor. For the record, though, and without further explanation, that’s the last you’ll read of them in this particular blog.

The distinctions between the 114/24 courses of action were interesting and debatable, but you didn’t have to be a terribly nerdy follower of local government finances to see the probable beginnings of a trend, so it was pleasing to have been reckoned insightful by the serious pros in Room 151. Especially when the trend didn’t gather pace as quickly and widely as I speculated it might.

However, given the way local government finance ‘works’ in this country, particularly under Conservative administrations, it was only going to be a matter of time, and gradually the signals became unmissable – accelerating in quite a big way with (then Lab) Croydon LBC in late 2020, who issued not one but two s114 Notices in successive months, having again failed to balance its budget in the permitted 21 days of grace. Understandably, it prompted a Commons Inquiry by Clive Betts’ ever-watchful Local Government (sorry – Levelling-up, Housing & Communities) Committee.

Slough BC (Lab then, C/LD now) was next in July 2021, despite having been one of eight councils granted “exceptional support” the previous year, as Ministers became increasingly concerned at the adverse publicity generated by threats of councils ‘going broke’.

Come December and Cumbria’s Copeland BC (Lab then, since abolished and incorporated into Cumberland) was reported to be “in Section 114 territory”, but was soon overshadowed by (Lab) Nottingham City Council’s unlawfully diverting cash from what should have been a ring-fenced Housing Revenue Account to ‘General Funds’ – an ‘accounting error’ which personally I found extraordinary, since it’s one of the few bits of tekkie lg finance that even I know. And it dragged on.

2022 saw serious acceleration. In May Northumberland Council (Con)issued a s114 for unlawful expenditure, including allowances paid to the council’s Chief Executive. It was possibly the case generating least sympathy for the beleaguered council, whose elected members and officers went public with their mutual distrust – not the only such example, but probably the bitterest. 

Towards the end of 2022 it became clear how desperate the situation – or at least the search for commissioners available to ’intervene’ – was becoming, as returning Local Government Secretary Michael Gove sought to launch anticipatory “turnaround programmes” short of sending in commissioners – ‘risk-mitigation directions’, in Govester jargon.

Not in time, however, to prevent Croydon LBC (NOC) issuing its third s114 in three years, and Thurrock Council (Con) having the courage/desperation to report that it would require “exceptional support” from Gove’s Department “over a number of years … to stabilise our financial position and give us time to have balanced budgets.”

At which point – after an obviously uplifting Christmas and New Year – “Whitehall officials”, in the person of Jeremy Pocklington, Permanent Secretary of the Department for Levelling Up, Housing and Communities (DLUHC), had the confidence/nerve/effrontery to announce to a Select Committee that even at the time sounded, well, brave.

As reported in The MJ (Jan 10th), “Whitehall officials are not expecting councils to issue further Section 114 notices in the coming weeks … our assessment, looking at the sector as a whole, is that the financial position is sustainable … strengthened by the additional resources made available in the Autumn Statement.”

Apart, that is, from the nine councils within the Special Interest Group of Municipal Authorities (Sigoma) who warned last week that they could issue a Section 114 notice by 2025; Stoke-on-Trent City Council (Lab) that announced this week that it is on the verge of bankruptcy … oh yes, and Birmingham.

Chris Game is an INLOGOV Associate, and Visiting Professor at Kwansei Gakuin University, Osaka, Japan.  He is joint-author (with Professor David Wilson) of the successive editions of Local Government in the United Kingdom, and a regular columnist for The Birmingham Post.

The Jaws of Doom – still relevant a decade on

Chris Game

“Things from the past you’ll never see again”.  I came across a listing of these recently, and they were – well, moderately interesting. More so, anyway, than the accompanying “trends that have unfortunately returned” – pleated skirts, corsets, and structured vests, whatever they were.

The never-see-agains included smoking adverts, bubblegum cigarettes, and rotary push lawnmowers – to which I might easily have added “The Barnet Graph of Doom” as at least a never-expected-to-see-again.

It was a visual aid devised a dozen or so years ago primarily for the councillors of the London Borough of Barnet. It would come, however, to be associated with/appropriated by Birmingham City Council, and something with which some INLOGOV colleagues were so taken that it was discussed and illustrated in these pages not once but repeatedly – by, inter alia, me in May 2012 and January 2013 and the Institute’s then Director and this blog’s progenitor, Catherine Staite, in December 2012 and October 2013. Indeed, as Catherine notes in that second blog, it at least part-prompted an INLOGOV ‘book’ or, more accurately, Discussion Paper.

Impactful at the time, then, but at least not prominently, I presumed, over the ensuing decade. Certainly I, though at best semi-detached from these matters nowadays, was genuinely surprised to be confronted by its reappearance in a recent Financial Times (indeed, its double reappearance). Somewhat less so that it was credited entirely to Birmingham City Council, with Barnet getting, as my mother would have said, nary a mention. Which justifies at least a brief résumé, and for more senior readers a bit of reminiscence.

Some 15 years or so ago the very Conservative Barnet LBC acquired the not entirely flattering moniker of ‘easyCouncil’ – that precise orthography/spelling, though frequently ignored in the media, being arguably the policy’s most appealing attribute. With its stray upper-case C intendedly referencing the easyJet business model that inspired the council’s almost boundless outsourcing drive for no-frills efficiency, it embraced pretty well all services, from reduced-size waste bins and privatised street cleaning to limited ‘personalised’ adult social care budgets.    

Improved and cheaper services were obviously the aim, but senior officers foresaw that the sheer scale of demographic change – more children, more elderly – would in any foreseeable future take up an unmanageable proportion of the Council’s increasingly constricted budget. “No libraries, no parks, no leisure centres – not even bin collections”.  Hence the original Barnet Graph of Doom. The one on the left of the illustration, that is – the other, pleasing if more alarmist one, being a public ‘reminder’ tweeted a few years later, just as the social services budget was seriously taking off as forecast.

The Barnet graph, described at some length in my first blog and more summarily by the Guardian’s Public Services editor, David Brindle, started life as part of first a PowerPoint, later video, presentation used by the Council’s Chief Executive, Nick Walkley, to:

“focus the thoughts of colleagues and councillors …  In five to seven years we get to the point where it starts to restrict our ability to do anything very much else. Over a 20-year period, unless there was really radical corrective action, adult social care and children’s services would need to take up the totality of our existing budget.”

The tone, as Brindle noted, was deliberately alarmist, with the policy making no provision, inter alia, for Barnet’s anticipated rise in income through regeneration schemes. As an illustrative device, though, it was hugely effective. It featured regularly in local government media, and also in presentations by the late Sir Bob Kerslake – then Permanent Secretary at the DCLG, and whose outstanding career in both central and local government was fulsomely recounted following his recent death.

Alarming, yes, but “Where are the jaws?”, I hear you ask – and, of course, there weren’t any, yet. They were Birmingham Council’s contribution when it took the idea over and “simplified/dramatised” it by, as Patrick Butler put it, again in The Guardian, projecting “a ‘budget pressures’ line rising steeply to the top right of the grid, and a ‘grant reductions’ line crashing to the bottom right.”  It featured prominently as a ‘Jaws of Doom Graph’ in the council’s 2013 Budget Consultation document, and could indeed resemble, as Butler suggested, “a child’s depiction of a shark, or crocodile, about to bite its prey. Lunch, in this case, appears to be local government itself.”

In my January 2013 blog I sought to address the question of whether the ‘doom-mongering’ was entirely fair: Were “Birmingham and urban councils generally, or Labour councils, or the country’s most deprived areas, being particularly harshly treated by the government’s grant funding cuts?”

Which, you’ll be relieved to learn, I’ll not be bothering you with here – not least because, as already noted, for the vast bulk of the past decade I’ve personally given these particular ‘Jaws of Doom’ and their graph scarcely a passing thought. Now, though, I wonder whether that’s simply another consequence of a retiree’s detachment from the daily concerns and parlance of local government personnel. Could it be that this is what today’s finance officers jaw about, as it were, down the pub of an evening?

For suddenly there it was, weeks before the journalistic ‘silly season’, and in ‘The Pink Un’ – no, not Norwich City FC’s newsletter, but the albeit self-styled “worldʼs leading global business publication”: “The Jaws of Doom” graph in its original glory, and not once but twice. First, in a kind of editorial intro by Associate Editor, Stephen Bush, commending to readers William Wallis’ “excellent piece … featuring this alarming chart [shown on the right below] about the … ‘jaws of doom’ facing local authorities”.  And then Wallis’ article itself.

As you’d expect, it’s a good summary presentation – that I’d certainly be recommending to students, if I still had any – the thrust of which is that:

 “for more than a decade, local authorities in England have been sacrificing services and staff to what they call “the jaws of doom” – a reference to a graphic produced by Birmingham city council to show worsening budgetary pressures, that resembled a crocodile’s mouth.

Between rising demand for social care and other essential services, and the dwindling funds councils have received to provide these, discretionary spending on everything from libraries to youth clubs has already been eaten up.

Although local authorities won a better than usual financial settlement for 2023-24, 9.4% up on the year before, inflation running at 8.7% is eroding any benefits.”

And, having already well exceeded a thousand words, that’s where I’ll stop … though not before sharing the interesting and, more importantly, interactive graph of Sigoma’s English Indices of Multiple Deprivation also included in Wallis’ article – not new, so doubtless familiar to some readers, but to me unfamiliar, informative (see added results), surprising in places, and, I felt, worth sharing.  It made me (almost) sad not still to be lecturing and so able to play with it in public, as they say!

Chris Game is an INLOGOV Associate, and Visiting Professor at Kwansei Gakuin University, Osaka, Japan.  He is joint-author (with Professor David Wilson) of the successive editions of Local Government in the United Kingdom, and a regular columnist for The Birmingham Post.

A Japanese view of Jeremy’s budget

Chris Game

I had an interesting Budget week. I was part-hosting a Japanese academic colleague – Prof Toshihiko Ishihara (Kwansei Gakuin University) and his wife, Midori – making their first overseas trip since Covid. They briefly visited Birmingham, where Toshi was an erstwhile INLOGOV Associate, but were based in London, where I’d agreed to organise a theatre visit.

I’d booked tickets for a well-reviewed modern-day play, Romeo and Julie, loosely based on one of Shakespeare’s. Single-sentence synopsis: Julie – a bright, Cambridge University-bound, aspiring astrophysicist – is emotionally torn between uni and her affection for young single dad, Romeo, effectively sole carer for his baby daughter afflicted with Poonami.  

No, the Poonami doesn’t feature in Shakespeare’s version, but, researcher that I am, I’d discovered it’s a real medical thing, meaning affected babies’ sudden, massive, uncontrollable bowel movements. Better still, that etymologically Poonami derives directly from the Japanese tsunami – a sudden, volcanic, unstoppable wave. My guests were delighted – and the play too was excellent.   

The following Wednesday, however, was Budget Day – followed by the Birmingham Post’s impassioned coverage of our region’s “Power grab”, the “seismic shift in devolution as West Midland leaders take more control from Whitehall”, etc. (pp.1,7) – guaranteeing some amused but tricky questions from someone who both lives with and studies serious mayoral governance.

It was the national news headlines, though, that I was obliged to address first, and the UK’s “unsustainable … biggest since the war … tax burden” – characterised by Chancellor Jeremy Hunt as something horrendous and to be avoided, certainly by a Conservative Government, at almost any costs.

We’re not Basil Fawltys, but my Japanese friends and I tend not to mention ‘the war’ that much. Anyway, the timescale wasn’t really the issue. It was that highest-level tax forecast of 37.7% of Gross Domestic Product (GDP) – and yes, we do make life harder by colluding in almost invariably labelling it a “tax burden”, rather than, say, the “quality-of-life price” that the tax helps pay for.

What Toshi and other Japanese students of these things invariably query is: why the excitement/horror over a tax-to-GDP ratio currently almost identical to theirs? Yes, ours is indeed a higher ‘burden’ than those of, say, the US or Switzerland. But, as shown in the Office for Budget Responsibility’s Chart A, both we – at roughly 34% of GDP – and Japan are currently in the bottom third of “advanced economies”, and even at a forecast 37.7% we’d still be mid-table and some way BELOW both most sizeable West European countries, plus bits of Eastern Europe too.

It’s interesting. Pollsters never ask us if we prefer NOT being an ‘advanced economy’ – you know, one with fully staffed and functioning health and social services, decently funded schools, reliable public transport, etc.?  And I’m not sure how collectively we’d answer. Clearly, these things do cost money, yet we obviously like visiting these higher-taxed places for our holidays.  Not Denmark perhaps – top, with its 47% tax ‘burden’ – but France, Austria, Italy, Scandinavia, Greece, Spain, Portugal, etc.

It’s presumably at least partly these countries’ ‘quality of life’ (QoL) that attracts us – which, unsurprisingly, correlates broadly with ‘tax burden’. There are several QoL indexes, one being Numbeo’s. It’s not the most methodologically sophisticated, but it does produce nice maps, collectively summarising its measures, which include purchasing power, safety, health care, cost of living, and pollution.

Netherlands, Denmark and Switzerland are currently top, scoring nearly 200 QoL points. Then the usual suspects – Finland, Iceland, Austria, Australia, New Zealand, Japan (13th) etc. – down to No.21 – UK 166.4, just ahead of Croatia. Disappointing, but could be worse – bottom at 84th is red Nigeria, not with ‘nul points’ exactly, but only 40.

The underlying, systemic problem, obviously not mentioned by Chancellor Hunt, is precisely his Department: His Majesty’s Treasury – first time I’ve typed that! – and its overbearing central funding control, currently exercised politically and communicated by him. And formerly by, among others, one George Osborne – which is where the irony starts. When Chancellor of the Exchequer, Osborne launched, and currently chairs, the Northern Powerhouse Partnership (NPP) – self-described as “the leading voice of business and civic leaders across the North”.

And currently a very shouty voice. For, within days of Hunt’s Budget pronouncements, along came Osborne with his NPP ‘wrecking ball’ – a clumsily titled but potentially headline-making report: Fiscal DevoNation – The Blueprint for How to Devolve Tax to the Regions of England. The Treasury, he and his Powerhouse chums now reckon – and as local government has complained for years – far from being the provider of solutions, is itself the problem. Its voice is the overwhelmingly dominant one in what Osborne nowadays sees as a damagingly over-centralised fiscal system. Just like when he was boss.

The NPP’s solutions involve, at least eventually, full-scale fiscal devolution. The “most unfair” council tax – with its outdated property values – stamp duty (paid on purchasing residential property), and business rates should all go, eliminating the Treasury’s all-powerful role altogether. The at least eventual replacement, following a comprehensive revaluation of all homes, would be a locally set land value tax, plus three new council tax ‘super bands’ for the most valuable properties, with revenue to be shared across the country.

Yep – that’s radical, but there’s more – like the localised hotel tax that numerous other countries already have, which NPP reckons could raise an annual £5.5 millions for the Lake District alone.

But I digress – from what my Japanese visitors really wanted to talk about: that Budget highlight of a “seismic shift” in devolution, to the West Midlands and Greater Manchester regions, and their elected Mayors, Andys Street and Burnham, who will get new multi-year devolution funding deals, and be allowed to retain business rates – to be followed by further such agreements across England.

At the time of writing, there hadn’t been a direct response from Northern Powerhouse as to how far down the ‘full-scale fiscal devolution’ road this might take us. As for a Japanese reaction, well, this blog is already overlong; but their response would probably start with the country’s written constitution, and the local government chapter guaranteeing its role and “the principle of local autonomy”. It’s an ultra-crude summary, but basically the national state does currency, diplomacy and defence, and pretty much everything else is left to the 47 prefectures and 1,700 or so municipalities. And heading those municipalities … directly elected mayors!

As the American phrase puts it: ‘Way to go’ – in both senses.  

_____________________

This is an adapted version of an article that appeared in the March 23rd edition of the Birmingham Post.

Chris Game is an INLOGOV Associate, and Visiting Professor at Kwansei Gakuin University, Osaka, Japan.  He is joint-author (with Professor David Wilson) of the successive editions of Local Government in the United Kingdom, and a regular columnist for The Birmingham Post.

Is Government Giving Value For Money?

Jason Lowther

When money is short, how we spend it becomes even more important. As central government reheats its arguments for austerity following the chaos of the last few weeks, I’ve been reflecting on the contents of the 2021 budget (just a year ago).  The 2021 budget set out not just spending plans, but also a souped up approach to measuring outcomes and cost-effectiveness of government spending. How are these playing out, and will they survive the No 10 merry-go-round?

Rishi Sunak, then eight months into the job as Chancellor, noted that government borrowing was relatively high after the pandemic, warned of the public finances’ exposure to rises in interest rates, and outlined how spending was being linked to the delivery of outcomes alongside across the board ‘efficiency savings’:

The fiscal impact of a one percentage point rise in interest rates in the next year would be six times greater than it was just before the financial crisis, and almost twice what it was before the pandemic…

Decisions have been based on how spending will contribute to the delivery of each department’s priority outcomes, underpinned by high-quality evidence. The government has also taken further action to drive out inefficiency; SR21 confirms savings of 5% against day-to-day central departmental budgets in 2024-25. (page 2)

The “priority outcomes” are the latest in a long line of attempts to prod government spending into delivering effectively on political priorities, rather than blindly increasing/decreasing by x % compared to last year.  A 2019 report from the Institute for Government helpfully outlines many of these earlier initiatives (summary from the House of Commons Library) including:

  • “Scrutiny programmes” and the Financial Management Initiative (FMI), introduced under Thatcher.
  • The Cabinet Office and Treasury set up the Financial Management Unit (FMU) in 1982 to help with creating plans under the FMI.
  • The “Next Steps” report, published in 1988, which recommended the establishment of executive agencies to carry out the executive functions of government.
  • Tony Blair’s administration developed a greater focus on performance targets and Public Service Agreements (PSAs) which put these targets on a formal basis.
  • In 2001, Blair’s government also set up the Prime Minister’s Delivery Unit (PMDU), which was intended to coordinate PSAs and bring them under more central control.
  • Under the coalition government in 2010-15, PSAs were abolished and replaced with Departmental Business Plans (DBPs). These shifted the focus from targets to actions – in other words, they listed what each department would do and by when, rather than what they sought to achieve.
  • Under the Conservative government in 2016, DBPs were renamed to Single Departmental Plans (SDPs), which were themselves renamed to Outcome Delivery Plans (ODPs) in 2021. According to the NAO, SDPs (and by extension, ODPs) are supposed to be “comprehensive, costed business plans”.

As well as having to write down what outcomes they want to achieve, and how they will know whether that is happening, under the SDP system departments were also required “to assess progress in delivering their priority outcomes [and] … share regular performance reports with HM Treasury and the Cabinet Office”. 

In the 2021 spending review, the departmental outcomes were spruced up to reflect the (now last-but-one) PM’s five priorities of levelling up; net zero; education, jobs and skills; recovering the NHS; and reducing the volume and harm of crime.  

This blog’s audience may be interested in “Where does local government fit in this compendium of key priorities?”  The answer is a little depressing: on the last line of the last page (page 30 of 33), just before the devolved government departments. The relevant outcome is inspiring enough: “A sustainable and resilient local government sector that delivers priority services and helps build more empowered and integrated communities”, albeit with the reassuringly non-SMART measure that “the department will provide narrative reporting on progress for this outcome”.  Of course I exaggerate, because local government has critical inputs to very many of the earlier outcomes too, but it’s hard not to conclude that local services and communities were not yet at the top of the ministerial attention list.

Will the “priority outcomes” survive the whirlwind of ministerial movements and unforced economic missteps?  After the last seven weeks, I’m not going to make predictions – but we should know in the next month, and alongside the financial figures they could be our best hint yet on where a Sunak government is heading.

Picture credit: https://www.youtube.com/watch?v=Du_6mRV8Hm8

Jason Lowther is the Director of INLOGOV. His research focuses on public service reform and the use of “evidence” by public agencies.  Previously he worked with West Midlands Combined Authority, led Birmingham City Council’s corporate strategy function, worked for the Audit Commission as national value for money lead, for HSBC in credit and risk management, and for the Metropolitan Police as an internal management consultant. He tweets as @jasonlowther

Can drama “Help” social care?

Jason Lowther

Photo credit: https://www.youtube.com/watch?v=5Z2ufAl2lko

Fresh from winning the Grand Jury Prize at the Banff Rockie Awards on Monday, Channel Four’s drama Help was yesterday nominated for Best Drama in the Edinburgh TV awards, with its lead actor Jodie Cromer also nominated for Best Actor.  The drama was one of the most watched on the channel, bringing to millions of viewers the plight of care homes and their residents during the pandemic.  Whilst the Help storyline is fictional, it is based on hard and devastating facts.

In my view, Help could be criticised for its farfetched ending and sometimes unsympathetic rendering of the care home manager, however its characterisation of care home staff and residents is both caring and revealing.  Clearly emotionally affected researching the programme, writer Jack Thorn said: “hearing the stories of those at the frontline, having people break down in tears on zoom in front of us has been incredibly moving and galling”.   

My two favourite parts of the programme (no spoilers) are the endless recorded message of a hopelessly over-run “NHS 111” call centre in the background for several minutes, and Jodie Cromer’s wrenching speech to camera (1:34 on the video) demanding “…underlying health conditions, eh?  When did all lives stop being worth the same?”  The programme ends highlighting some stunning research findings: 40% of Covid deaths in the early pandemic (from March to June 2020) were in care homes; the average wage of a care home worker is £8.50 per hour; whilst government provided 80% of PPE needs for the NHS, it only met 10% of adult social care’s needs. 

This last claim is based on the National Audit Office analysis published in November 2020, which found that the adult social care sector received approximately 331 million items of PPE from central government between March and July (10% of their estimated need) whereas NHS trusts received 1,900 million items sent to NHS trusts (80% of estimated need).  Whilst both fell significantly short of what was required, there is an apparent imbalance here.  Data collected by the Care Quality Commission (CQC) showed that, throughout April and May 2020, more than a fifth of domiciliary care providers had no more than a week’s supply of PPE. 

This situation was well known to the Secretary of State, not least because the LGA and the Association of Directors of Adult Social Services wrote stating “we continue to receive daily reports from colleagues that essential supplies are not getting through to the social care front-line. Furthermore, national reporting that equipment has been delivered to providers on the CQC-registered list does not tally with colleagues’ experience on the ground”.  Nevertheless, in a scene included in Help, during a Downing Street press conference on 15 May, 2020, Mr Hancock said: “right from the start, it’s been clear that this horrible virus affects older people most. So right from the start, we’ve tried to throw a protective ring around our care homes”, repeating in the House of Commons on 18 May that “we absolutely did throw a protective ring around social care”. 

Understanding the human costs of these central government failures is difficult, with the effects on staff, residents and their family impossible to measure objectively.  Help does a good job in illustrating some of the pressures on care staff and the pain of relatives unable to visit dying residents, made all the more poignant now that we know some of the behaviour during the pandemic of senior central government actors such as Hancock’s affair and Johnson’s multiple parties forensically examined in Sue Gray’s recent report

Perhaps the most basic measure is in human lives.  Last year researchers used the national death registry of all adult (aged ≥18 years) deaths in England and Wales between January 1, 2014, and June 30, 2020 to compare daily deaths during the COVID-19 pandemic against the expected daily deaths.  They estimated that during the early pandemic, about 26,000 excess deaths (almost half of the total excess deaths) occurred in care homes and hospices.  This is likely to be an underestimate since early in the pandemic, testing of suspected cases was available only in the hospital, whereas routine testing of staff and residents in care homes was not implemented until May 2020.

The latest ONS statistics, issued in February 2022, suggest that since the beginning of the coronavirus (COVID-19) pandemic, there have been over 274,000 deaths of care home residents (wherever the death occurred) registered in England and Wales; of these, 45,632 involved COVID-19 accounting for 17% of all deaths of care home residents. 

Intriguingly, The Lancet reported in March that “COVID-19 has had a disproportionate impact on the mortality of care home residents in England compared to older residents of private homes, but only in the first wave. This may be explained by a degree of acquired immunity, improved protective measures or changes in the underlying frailty of the populations.” Meanwhile, last month the Care Quality Commission finally published data on deaths in each care home during the first year of the pandemic (April 2020 to March 2021).

Whatever the precise figures, it’s clear that adult social care residents and staff were badly let down by central government, far from the Secretary of State’s “protective ring” narrative. This despite the best efforts of care managers, local commissioners and councils discussed in Luke Bradbury’s blog here last week.  Help does a fantastic job of showing the impact of these critical central failures – and recognising the incredible work care staff did in such difficult circumstances with so little financial reward.