Children’s Services Spending: Where has the axe fallen?

Calum Webb (University of Sheffield) and Paul Bywaters (Huddersfield University)

Children’s and Young Peoples’ Services, encapsulating children’s centres, safeguarding and social work, family support, services associated with looked after children, often totals nearly £10 billion of spending annually. Despite this, limited attention is paid to how these funds are spent, and much less is known about how such spending has changed over time. Has spending increased or decreased under austerity? Have budgets for front-line services for some of the most vulnerable and voiceless members of society – children at risk of abuse and neglect – been protected, as is often claimed, or axed, in the face of the rising strain placed on local government finances? Where cuts have been made to cope with reduced budgets, where have they fallen? Have cuts to children’s services been greater in more deprived local authorities, as previous research by the Joseph Rowntree Foundation has indicated, further disadvantaging children from poorer communities and with greater needs?

The contradictory findings from government departments does not inspire confidence in their ability to answer any of these questions convincingly. A 2016 report from the National Audit Office concluded that expenditure on children’s services had risen by approximately 12 per cent between 2012 and 2015. This report, however, only looks at a sum of between £1.6 billion and £1.8 billion, and we had no luck replicating this figure – not with any combination of categories or adjustments for inflation.

A more recent report published by the Department for Education came to fundamentally different conclusions, namely that total expenditure had fallen by 9 per cent between 2010 and 2016, and that between 2012 and 2015, the same period covered by the NAO report, spending had reduced from £9.2 billion to £8.9 billion, a 3 per cent reduction.

The problem is partly down to the quality of the data – the inconsistency of categories between years prevents any meaningful long term comparisons of very specific spending areas. A few of the broader spending categories are fairly stable over time, namely spending on looked after children and spending on safeguarding, and the remainder of categories can loosely be considered ‘preventative’ or ‘early intervention’ services. These are the Sure Start centres or family support services that are intended to address the difficulties children in need may face before these problems develop to the point that they require more drastic interventions.

The second major problem with the official reports is the tendency to only focus on changes in the total national levels of expenditure, rather than focusing on what has been happening on a local authority level. All it takes is a few of the larger local authorities, the ‘big spenders’, to see an increase to dwarf many negative trends in smaller local authorities. This approach therefore doesn’t necessarily reflect the reality for children across England.

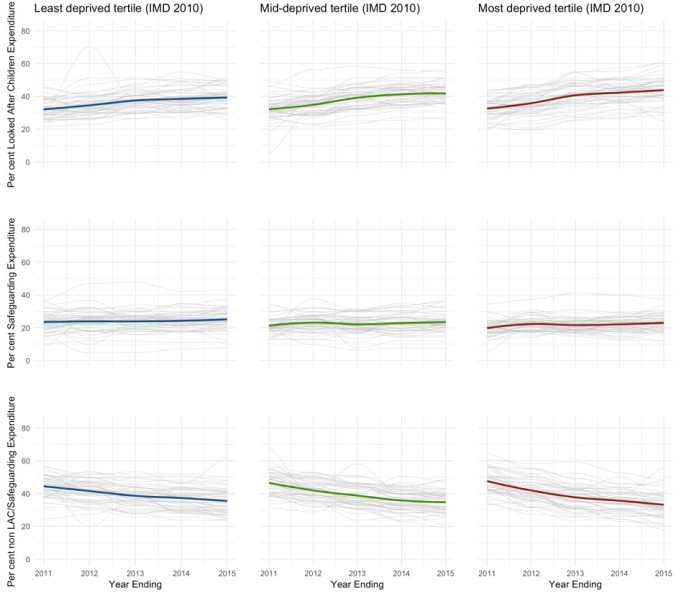
When we looked at expenditure after taking these things into account we found very clear patterns. The most deprived 20 per cent of local authorities had seen reductions in spending of 25 per cent, whereas the least deprived 20 per cent have had cuts of 4 or 5 per cent. When we split local authorities into three equally sized groups of 50 (the City of London and Isles of Scilly LAs are excluded as outliers), based on their deprivation scores, we found significant differences in the expenditure trends: rapid rundowns of expenditure per child in the 50 most deprived local authorities, less extreme cuts for the 50 ‘middle’ deprived local authorities, and far less severe cuts for the 50 least deprived local authorities. This is in part due to the indiscriminate way in which austerity measures have been introduced, without attention to the fact that more deprived local authorities typically have higher spending per child to meet greater levels of more complex needs. This means a hypothetical 10 per cent cut in Middlesbrough is going to result in a much bigger loss of £-per-child than a 10 per cent cut in Wokingham.

What’s more is that the share of spending across the different services has changed substantially, mirroring patterns in social work practice more broadly. The share of spending has shifted away from the aforementioned preventative and support services in favour of maintaining the share of safeguarding spending and increasing the share of looked after children spending. On average, local authorities spent around 46 per cent of their children’s services budget on more prevention focused services in 2010-11. By 2014-15 this had fallen to only 33.5 per cent. This has been fairly universal across all local authorities, but slightly more extreme in the most deprived third, and is best seen visually.
CW graph for blog feb

We don’t know completely what impact this will have on the lives of children, but we do know that since 2010 there has been evidence of an increase in demand for children’s social services; with average Looked After Children rates increasing from 57.5 children per 10,000 in 2010-11 to 62 children per 10,000 in 2014-15, and the number of children in the population rising by approximately 750,000 since 2010. Furthermore, this population increase has been largely concentrated in the most deprived local authorities (12%) compared to the least deprived local authorities (4%), meaning stable intervention rates – such as rates of children in care – actually represent a substantial increase in workload for practitioners. This is just one part of a complex picture of disadvantage that children living in poverty face. What we do know is that there needs to be a clear commitment to improving the quality and detail of the data that is collected about expenditure and deprivation because, as Ofsted’s Annual Report has acknowledged, there is a link between this and the quality of the services children receive across the country.

The research presented here was funded by the Nuffield Foundation and is part of the Child Welfare Inequalities Project and will be published in Local Government Studies in February 2018. Evidence from the project is being presented to an APPG for Children on the 7th February 2018.

Calum WebbCalum Webb is an ESRC White Rose postgraduate research student at the University of Sheffield’s Department of Sociological Studies. He has recently contributed to the ESRC funded research project ‘Developing a Policy Learning Tool for Anti-Poverty Policy Design and Assessment’ and the Nuffield Foundation funded ‘Child Welfare Inequalities Project’. His PhD research investigates approaches to the longitudinal measurement of multidimensional poverty. Calum tweets using @cjrwebb

Paul BywatersPaul Bywaters is Professor of Social Work at Huddersfield University working in the Centre for Applied Childhood, Youth and Family Research. He has led a series of research projects funded by the Nuffield Foundation and the Joseph Rowntree Foundation which have examined inequalities in the incidence of and responses to child abuse and neglect between and within the four UK countries. For more information can be found here. Paul tweets using @PaulBywaters


Electoral reform: STV for local elections and first-time compulsory voting

Chris Game

Two research-based reports on electoral reform appeared almost simultaneously last week. Great for anoraks, but for a local government blog a dilemma.  Only one report directly concerns local government, and here, therefore, it properly leads off. But the second is – how to put this – at least methodologically the more interesting and will receive the greater attention.

Northern Blues: the Conservative case for local government reform is an Electoral Reform Society (ERS) report. The case starts from the Conservatives’ proportional under-representation – indeed, frequently complete non-representation – on northern metropolitan and unitary councils, due to the workings of the plurality or First-Past-The-Post (FPTP) electoral system. This weakens the party’s base for fighting parliamentary elections and undermines its claim to be a genuinely national party. The most obvious remedy, the report suggests, would be to follow the Scottish switch to the Single Transferable Vote (STV) form of proportional representation for local elections, which since 2007 has given Conservatives seats on councils and even in cabinets, where previously their presence was minimal.

None of this, of course – apart from the supporting statistics – is remotely new, even to Conservatives. Conservative Action for Electoral Reform (CAER), for example, is 40 next year, and jointly sponsored the oddly unmentioned 2005 forerunner of this report: Lewis Baston’s The Conservatives and the Electoral System.

The statistics do demonstrate the party’s under-representation on nine northern metropolitan councils in the three most recent sets of elections, but they are less “compelling” than the report’s foreword suggests, due to elections by thirds not being treated as individual events (p.8), and the omission throughout of total membership sizes of the councils on which the Conservatives are under-represented.

Simpler statistics and, I’d suggest, more compelling are that: (1) in the 2011 elections, in which the Conservatives overall did tolerably well, in the eight metropolitan boroughs of Gateshead, Knowsley, Liverpool, Manchester, Newcastle upon Tyne, Sheffield, South Tyneside and Wigan, the party’s candidates won an average of over 11% of the vote, but not one seat; and (2) today, of the total of 606 members on those same councils, just two are Conservatives (South Tyneside and Wigan, if you were wondering).

We know all about the Tories being the rich and nasty party, but sometimes overlooked is their stupidity quotient – as noted by John Stuart Mill to a Conservative MP in one of history’s great “I was misquoted” apologies: “I never meant to say the Conservatives are generally stupid. I meant to say that stupid people are generally Conservative”.  Sadly, even Peter Osborne, Telegraph and Spectator journalist and author of the ERS report’s above-mentioned foreword, is no exception to the rule. As blind as most of the party to the self-harm of its obsessional commitment to FPTP, Oborne claims “reading this report has persuaded me that proportional representation in local elections may be part of the answer” to the question of how to stem the wipe-out of Conservatism in northern England. It’s only one convert, but who knows?

Back in the world in which the rest of us live, we have Divided Democracy: Political inequality and why it matters – published by the ‘progressive’ thinktank, the Institute for Public Policy Research (IPPR). It’s a fascinating study of non-voting and its consequences that might almost have been devised to rebut the more objectionable views that the comedian, Russell Brand, has been inflicting on us recently.

Among Brand’s addictions are four-syllable words: he’s “utterly disenchanted”; politicians are all frauds and liars; the political system is merely “a bureaucratic means for furthering the augmentation and advantages of economic elites”. Until a “total revolution of consciousness” appears on a ballot paper, he will never vote – non-voting being “a far more potent political act to completely renounce the current paradigm”.

Pretty obviously, it’s not potent at all, but it’s his next pearl that really gets me: “I will never vote, and I don’t think you should, either … it seems like a tacit act of compliance”.  He wants us to join his misguided personal tantrum, and that is objectionable.

If self-interested economic elites are your enemies, it’s NOT VOTING that is the tacit act of compliance, consenting to their authority and perpetuating their rule. Not voting is a delusion: you either vote by voting, or you vote by abstaining and doubling the value of an opponent’s vote. Inaction has its own consequences. Multi-millionaire Brand can afford to be careless of the consequences of his inaction.  Potential non-voting disciples may not all be as fortunate.

The IPPR counter-thesis is simply summarised. Turnout in UK elections is not just falling, but is becoming more unequal. Governments aren’t stupid: they note these trends and act on them. They privilege voters, discriminate against non-voters, thereby ratcheting up societal inequality – at present, massively. One obvious way of making such behaviour at least more politically risky is through full or selective compulsory voting.

First, the figures. Recent General Election turnouts have fallen dramatically: from nearly four-fifths of the electorate in the 1960s to below 60% in 2001 and 65% in 2010. The fall has been anything but equal: much higher among the youngest and poorest. In 1970 the turnout gap between 18-24 year olds and over-65s was 18%; in 2010 it was nearly double: 76% of over-65s voting, but only 44% of 18-24 year olds. As for income, if you divide electors into five income groups, in the 1980s turnout among all five groups was over 80%. In 2010, while over three-quarters of the highest income quintile voted, turnout among the lowest quintile was barely half.

Any rational government, knowing these unequal turnout statistics, would in its own self-interest pay more attention to the likely voters than to the non-voters. The IPPR authors’ major contribution is to have developed measures of the extent to which the Coalition has acted in this way during its three years of cuts-driven austerity. In short, have low turnout groups suffered disproportionately from the funding reductions announced in the 2010 Spending Review and the national and local public service cuts to which they led?

game 2

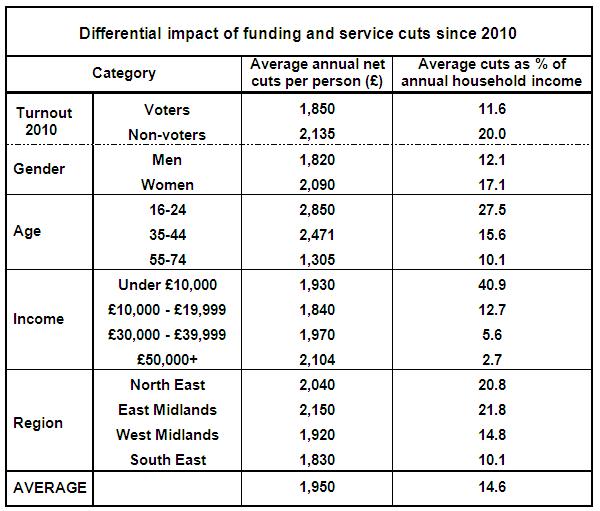
As the summary table shows, the answer is unmistakably Yes. The methodology, fully described in the IPPR paper, is complex, but uses the Treasury’s own accounting framework to collapse all public service expenditure into hundreds of small, everyday items, and then allocate them to households on the basis of known household consumption and spending patterns. Essentially the same is done for individuals, using information about voters and non-voters collected by the 2010 British Election Study.

The table confirms that all groups have been adversely affected to some degree, but that there are clear political inequality effects: women suffering a greater annual loss in services and benefits than men; the young more – much more – than the middle-aged and elderly; some regions more than others. Considered as a proportion of the average household income, the differences are even starker, especially in the case of income level itself. To quote the researchers: “Those with annual household incomes under £10,000 have lost an average of £1,926 annually from the spending measures, comprising a staggering 40.9 per cent of their average income”.

These are clearly important statistics in themselves, but the IPPR study’s primary concern is with the political inequality effect in respect of voters and non-voters: the cuts representing at household level 11.6 per cent of voters’ annual income and 20 per cent of that of non-voters.

Governments may not systematically aim to discriminate against non-voters, but that is the irrefutable effect of their policies – the inevitable consequence being “a vicious cycle of disaffection”. The less responsive politicians seem to be to their interests, the more disaffected people become, the less inclined they are to vote, and the less incentive politicians have to pay them attention.

The IPPR is already on record as a supporter of compulsory voting, as already practised in around a quarter of the world’s democracies. Even where not very robustly enforced, it produces significantly enhanced turnout rates – particularly among likely non-voters, thereby drastically reducing turnout inequality. Recognising, though, that a proportion of UK citizens tend to be fiercely protective of their right not to vote, the present authors settle for the more limited measure of making electoral participation compulsory for first-time voters only.

They would be obliged to go to the polls once, on the first occasion they were eligible – at their place of study for students living away from home.  A ‘None of the above’ option would be available, as in many compulsory systems, and it is suggested that a small fine be set as a gentle persuader.

There are several ancillary arguments for first-time compulsory voting. It should encourage voting in subsequent elections, boost citizenship awareness and political education, but above all it would force politicians to pay more attention to young people and their interests than they are inclined to do at present. Oh yes, and it’s infinitely more constructive than anything Russell Brand has to offer.

Chris Game - pic

Chris is a Visiting Lecturer at INLOGOV interested in the politics of local government; local elections, electoral reform and other electoral behaviour; party politics; political leadership and management; member-officer relations; central-local relations; use of consumer and opinion research in local government; the modernisation agenda and the implementation of executive local government.