Dr Marina Pera from Autonomous University of Barcelona is presenting a critical analysis of the asset transfer policies in Barcelona at our next INLOGOV seminar, which starts at noon on Thursday 30th November at our Edgbaston campus.
Marina will examine opportunities and risks raised by citizen management of municipal assets, taking a community empowerment perspective.
Barcelona is a city with a long tradition of neighbourhood associations, community and cultural centres run by citizens. Since the 1970s, in response to citizens’ demands, a number of municipal assets have been transferred to local non-profit organisations with economic support from the City Council.
The transfer of these assets was decentralised to the administrative districts, which in some cases led to practices of co-option and clientelism. In 2015, the Bases de gestió cívica (civic management legal basis) was collaboratively designed and approved: a local regulation that standardises the allotment of assets, increasing transparency on asset transfers. However, the Bases of gestió cívica did not solve some of the challenges that had emerged from the collaboration between the local state and community actors. One of the main challenges was the insufficient adaptation of regulations and administrative procedures to the idiosyncrasies of grassroots organisations with low levels of professionalisation. These place a huge burden on these community groups, who had to invest time and resources in bureaucratic procedures, hindering their original mission and accelerating their de-politicisation.
In 2016, with the rise of a progressive government in the city of Barcelona, an ambitious policy was approved, the Citizen Assets Programme (CAP). This policy aimed to recognise, support, and consolidate urban commons: spaces and facilities rooted in the community that were apt to be transferred to non-profit organisations in order to be managed democratically. The CAP thus aimed to empower the community and promote citizen participation. This policy entailed greater transparency and legitimacy surrounding the process of asset transfer and the accountability of grassroots and non-profit groups. However, the Citizen Assets Programme has been facing a number of challenges in terms of legal issues, resistance by public officials and scepticism by non-profit organisations.
Despite the difficulties involved in the implementation of the Citizen Assets Programme, it has presented an opportunity for collaboration between the City Council and the commons. The efforts to create an environment of trust and mutual learning among public officials and community groups has allowed the development of innovative administrative instruments that recognise the transformative work of the commons, through innovative public-commons partnerships. This seminar therefore aims to analyse alternative forms of asset management beyond public direct and outsourcing management, engaging in current debates on collaborative culture in public administration, the dismantling of the welfare state and community empowerment.
Seminar details
The re-arranged seminar will run 4-5pm on Thursday 7th December at the University of Birmingham Edgbaston campus in Muirhead room G15.
Further information, link to attend and registration can be found at the eventbrite.
It’s easy to claim, but there are times when I miss not having classes of students to endeavour to entertain – partly because, at least from a distance, it can seem rather easier now than back when I had that responsibility.
One gift I’d certainly have used during this year’s exam revision period was the YouTube rap video made by T-Dawg – aka Broadland and South Norfolk Councils’ Managing Director, Trevor Holden – ‘reminding’ intending voters in the May local elections to take photo ID with them to the polling station. Like the whole topic, the video received a mixed reception, but it certainly got my vote (sorry about that!) as an introduction to this split-blog’s attempted overview of the profusion of recently released Voter ID material. I’ve at least flick-read most of it, so you won’t have to worry about not doing so.
First, though, an additional declaration of personal interest, referring back to that opening paragraph. My students weren’t, of course, learning directly about ‘political literacy’, but high on my short list of ‘research stats I’ve managed to remember for more than a few weeks’ was the depressing finding in the All-Party Parliamentary Group (APPG) on Political Literacy’s 2021 report that, of a 3,300 sample of secondary school teachers in England, only 1% [felt] “fully prepared” to teach courses aimed at developing young people’s political literacy.
The ”fully”, omitted in some reports, was in the question and doubtless partly explains the dispiriting response. But anyway the finding was highlighted by the APPG, led directly to the creation of the social enterprise Shout Out UK (SOUK), and these two bodies’ influence is clearly evident in some of the Electoral Commission’s recommendations for more focused information and awareness raising.
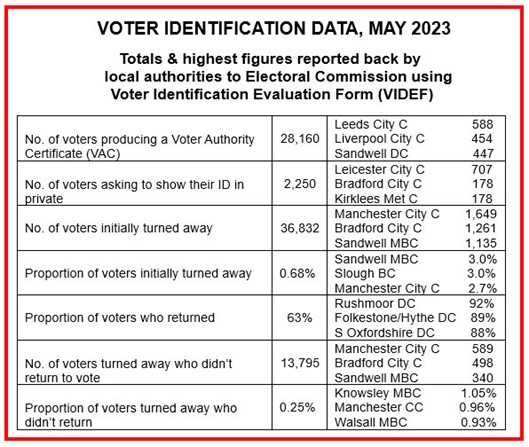
There had, of course, been earlier assessments of May’s elections – principally the Electoral Commission’s Interim Analysis in mid-June, reporting the anonymised returns from the Voter Identification Evaluation Forms (VIDEF) that Returning Officers were required to complete (see table below), plus results of three YouGov pre- and post-election public awareness surveys of between 1,700 and 3,700 adults each.
This first, stat-heavy part of the blog will present, in highly summarised form, some of the key data, with the second covering some of the more recent interpretative contributions – including that of the All-Party Parliamentary Group, from which I’ve appropriated the blog’s slightly giveaway title.
First, some scene-setting stats, taken from the final report. The total electorate was 27.3 million, ballot box turnout 32%. For the record, Labour took 33% of the vote and control of 70 councils; Conservatives 28.6% and 33; Lib Dems 37% and 20. 5.2 million postal ballots were initially issued to 19% of the electorate, 3.5 million (67%) of which were returned, of which 89,000 were rejected, mainly for missing or mismatched signatures or dates of birth. OK, it’s only 2.6%, but, after making the effort, it was higher than I might have guessed.
Key findings from the analysis included that:
Immediately post-election, in areas with elections, 92% of people in England were aware they now needed to show photo ID to vote at a polling station. They weren’t asked, however, if that awareness extended to knowing that they couldn’t obtain ID – e.g. the Voter Authority Certificate (VAC) – on polling day itself.
Awareness was significantly lower (74%) among those who didn’t already have an accepted form of ID – and, unsurprisingly, among youngest age groups (82% for 18-24 year olds), Black and minority communities (82%), etc.
Approximately 89,500 people applied for a VAC before the 25 April deadline, some 28,000 certificates being subsequently used – i.e. under one-third of the 250,000 to 350,000 estimated likely not to have any other acceptable ID.
At least 0.25% of people (c.14,000) who had tried to vote at a polling station were not issued with a ballot paper because of the ID requirement, but this excludes those who reacted to the ID reminder before they could be recorded in the data – thereby inevitably underestimating, as do the post-election analyses generally, the actual impact of the voter ID requirement.
This was essentially the ‘headline’ picture we had to content ourselves with over the summer, until quite suddenly, come September, there was a whole lot more – and it seems logical, if not strictly chronological, to start with the Electoral Commission’s full-scale Voter ID Demographic Analysis Research. The analysis aimed to identify patterns in areas where relatively higher or lower proportions of intending voters were turned away from polling stations due to the new ID requirement.
18 authorities with apparently relatively socioeconomically diverse wards were selected, including the West Midlands’ Coventry and Sandwell – the latter being the sampled borough with the nationally highest “initially turned away” percentage of 3%. The Census-based ‘proxy’ variables measured were unemployment, ethnicity, household deprivation, and social renters.
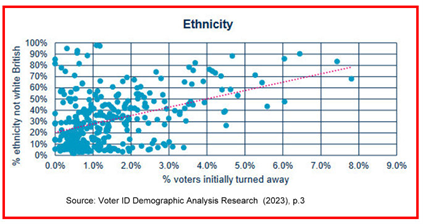
Hyper-summarising, the analysis suggested there was “a potential linear relationship” between each selected socio-economic variable and the proportion of voters initially turned away and those who didn’t return to vote. These results are obviously tabulated, but also graphed, as illustrated in what is described as the “moderate relationship” between ethnicity and the proportions initially turned away.
Overall, 13 of the 18 authorities showed at least a moderate relationship between the independent variables and the proportion of voters initially turned away, and 6 exhibited “strong relationships between one or more independent variables”. Strongest correlations were with areas having a high proportion of non-white British individuals, higher deprivation, and higher unemployment.
Following this specifically Voter ID-focussed report, the Electoral Commission had published in June its overall Report on the May 2023 Local Elections in England, which it updated in early September. It made nine main recommendations, including increasing awareness of the support available for disabled voters, and improving data collection at polling stations.
Four, however, related specifically to voter ID: review the list of accepted ID; improve access to the Voter Authority Certificate (see above); improve options for voters who don’t have or can’t access any accepted form of accepted ID – e.g. allowing ‘attestation’ by a named and verified elector; and polling station staff to continue to collect voter ID impact data at future elections.
Which brings us to about mid-September, already some way over this blog’s preferred length, and quite the wrong time, therefore, to address the “poisoned cure” and other reactions to these primarily statistical analyses – which will follow, with luck, fairly shortly.
Chris Game is an INLOGOV Associate, and Visiting Professor at Kwansei Gakuin University, Osaka, Japan. He is joint-author (with Professor David Wilson) of the successive editions of Local Government in the United Kingdom, and a regular columnist for The Birmingham Post.
Relations between first and second cities are often strained, especially when those who live in the Second City elect leaders from a political party that is not running the national government – as has been the case with Birmingham for much of its life.
After the Second World War, Birmingham was prosperous. It had avoided most of the bombing that destroyed the centre of Coventry, and its factories had produced aircraft, lorries, and other vehicles and equipment for the military and were now available to meet the post-war demand for cars and lorries. Wages for semi-skilled labour were some of the highest in the country. There were shortages of labour, and to meet them employers welcomed bus drivers, conductors and nurses. These were followed in the 1970s and 1980s by workers mainly from Pakistan and Kashmir.
From the perspective of the London government, Birmingham did not need more employment, so companies who wished to invest in the motor industry were directed to Liverpool and elsewhere. But academic commentators, and the more thoughtful employers, could see that all was not well. Britain was becoming increasingly dependent on service industries, which were far from strong in the Midlands. In that context, in the mid-1970s, Birmingham Council proposed to build a National Exhibition Centre, on land near the airport. It would be owned by a company which was a partnership with Birmingham Chamber of Commerce. The government wanted it in London; the council carried on regardless, and eventually the London government allowed it to do so.
Its structure was innovative – the company had just two shares, one owned by the city council, the other by the chamber. Each could nominate four directors. The chair would always be one of the chamber nominees – for a long time the leading industrialist Sir Adrian Cadbury. But if voting on the board was tied, the chair did not have a casting vote, and what was proposed would not go ahead. The company, underwritten by the council, borrowed money and built the NEC.
A few years later, in 1987, the NEC company started building the International Convention Centre and Symphony Hall, on land off Broad Street. This was to make Birmingham a centre for conferences and business meetings. The decline in manufacturing and rising unemployment was by then so evident that Birmingham was granted Assisted Area Status by the European Union, so a fraction of the cost was met from Europe. The London government was not involved.
The ICC became a preferred location for large gatherings of professional bodies, such as the British Small Animal Veterinary Association, which grew till it hosted more than 8,000 delegates. It met in Birmingham every year for more than 25 years. A boom in the construction of hotels met the demand for accommodation for this kind of event. Also of offices, many taken by national or international companies. No longer is Birmingham lagging in its provision of services. On the contrary it is a leader – almost entirely because of these initiatives. Symphony Hall was built to meet the specification of Simon Rattle, then a very young but highly promising conductor of the City of Birmingham Symphony Orchestra. It was part of a city-council strategy to support the arts, of which another strand was the attraction of what became the Birmingham Royal Ballet to the Hippodrome theatre – with its charismatic directors, Peter Wright, David Bintley and now the Cuban star Carlos Acosta. Another initiative required investors in large buildings to put a small extra amount aside for public art.
The arrival of a national Conservative government in 2010 meant that the council started losing the extra grant it had long enjoyed to meet its high levels of deprivation, and put it under huge financial pressure. Whole levels of staffing in departments of the council were removed. Many senior officers did not stay long. Some posts were not filled. Others are filled by ‘interim’ staff, who are supplied by agencies, do not expect to stay in the city and are very unlikely to live in it.
The refuse collection service was traditionally headed by an assistant director who had worked in the service for many years. For a period before the 2017 strike, this post was not filled, and the service was for a time run by the director of leisure. The strike was about reducing the number of operatives on each vehicle when wheelie bins were introduced. It was resolved by giving the workers improved pay.
It appears that it was only later that the implications of this for ‘single status’ were recognised, meaning that other categories of workers – in particular in social care – could claim equal pay for work assessed as equivalent. To meet the huge resulting costs, the city sold the NEC company for £300m. It was resold for £800 million three years later – a warning to the current commissioners not to sell this kind of asset on the cheap. Since then, the bin workers have managed to complete their shifts in less time than expected – partly assisted by some residents not putting their bins out every week – and been permitted to sign off early when their round was completed. Again, it has only recently been realised that this opens the city to another round of ‘single status’ claims. Hence the near bankruptcy, Section 114 Notice, and appointment, by Michael Gove in London, of commissioners.
To resolve challenges such as this, when Birmingham is facing extreme pressures on all its services, will not be easy for the commissioners.
The worst thing they could do would be to split Birmingham into perhaps three smaller councils. This would increase the overhead costs – three directors of each service instead of one, three separate offices – and lose major economies of scale. It would also threaten the leadership and finance which is part of being the Second City – in the arts, in the representative institutions of local government, and in creating and implementing an economic strategy which responds to the local opportunities and needs which are most clear to people living in the city.
Andrew Coulson is a retired lecturer from INLOGOV and a former Birmingham City Councillor. A longer version of this article was published in The Birmingham Post. Andrew writes in a personal capacity.
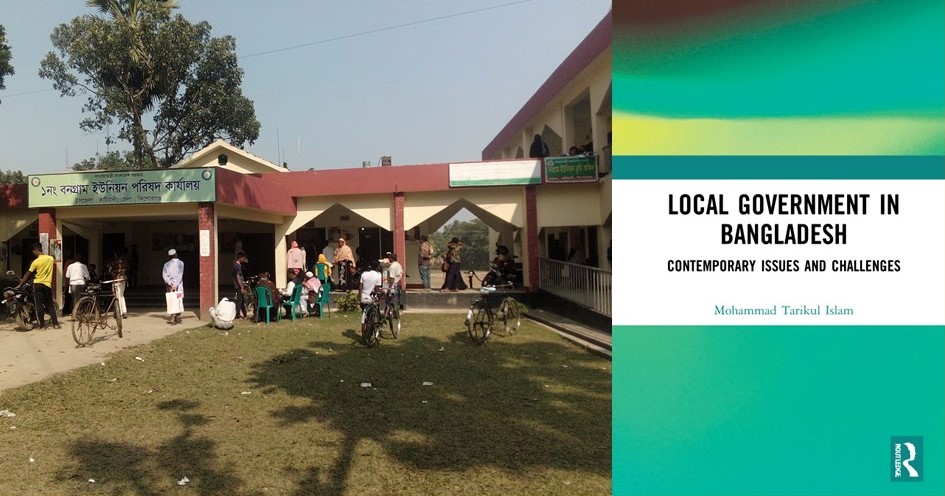
Local government as an inclusive political organization is dependent on freedom, dignity, competitiveness, recognition, planning and management, collaborative leadership, and multi-actor coordination.
The purpose of local governments is to provide order in ways that benefit the broader populace democratically. To run a successful local government, the people elect the leaders with the most faith. Local governments are accountable to and serve the people who live nearby. Its main responsibilities are local government’s executive, judicial, and legislative branches. Because it provides meaningful public engagement and mobilises local resources to enhance local people’s lives, local government is crucial in democratic societies.
I am working to develop a model that will allow for global rural development via the lenses of politics, governance, and human development. My paradigm of local government, “local government as an inclusive political institution”, comprises two basic normative assertions. The first assumption is that inclusive politics for well-being is of vital moral importance. Second, the community must claim inclusive political local government while maintaining dignity and independence to achieve well-being.
I outline seven local government categories as an inclusive political institution: freedom, dignity, competitiveness, recognition, planning and management, collective leadership, and multi-actors’ coordination. Local government serves as a platform for broadening and fostering inclusive politics and rural development. The “improvement of community choice, ownership, and trust enables people to change their fate through dignity and a competitive process.” As a result, “local government necessitates the elimination of major sources of discrimination and inefficiency.”
The term “freedom” refers to the participation of community members in politics and development issues without interference or imposition from political parties or players. Community members can make decisions for the greater good without being swayed by ties to family or patron-client connections.
Dignity is the idea of being respected by others in society by creating mutual respect and trust. Building trust by properly treating community members regardless of caste, creed, religion, education, colour, or income might protect people’s dignity.
Competitiveness refers to the healthy environment prevalent in local politics, enabling people to focus on participative decision-making through vision, action, and voice. It also strengthens the local government’s advantage in identifying credible, skilled, and motivated individuals to support local development through the electoral process.
Recognition refers to acknowledging everyone’s inputs or contributions in various ways and honouring their loyalty to the society in which they live. Recognition appears to pay off differently in this case, as it encourages people from all walks of life to participate in local politics and local development.
Planning and management refer to a well-structured and well-motivated visionary local government that strives to provide the most outstanding public service possible in response to community demand. It can help local governments enhance their decision-making abilities. It enables them to concentrate on a single goal and devise several strategies to help their team reach that goal. It can also assist them in making educated judgements about the activities their team can participate in.
Collective leadership refers to a group of individuals who work together to achieve common goals through sharing decision-making and collaborating at the grassroots level. So that the entire team, such as local government, works together to achieve the same objective with excitement and energy based on a vision and mission. Collective leadership will enable individuals and teams in local government to feel like they are part of something bigger. Sharing decision-making power with those directly affected by the process also promotes collective accountability, where everyone cooperates to ensure the desired outcome is realised.
Multi-actor coordination refers to a coordinated action achieved by mutual adjustment processes that might take the form of organising, planning, and improvisation under the direction of a strong local government. A plan can be viewed as a social construct, a reasonably permanent socially shared unit of knowledge sustained by its daily application for the community’s welfare. To comprehend multi-actor coordination, the political landscape of society must be thoroughly understood, as local politics eventually participate in a coordinated approach to inclusive development.
By applying this approach to local government, competent authorities, including policymakers, can direct change for inclusive development. Advantages include reflecting on communal assumptions and biases, comparing and contrasting different views, and improving researchers’ and practitioners’ critical thinking and problem-solving skills. Relevant actors can increase their knowledge and awareness of independence, dignity, competitiveness, recognition, planning and management, collective leadership, and multi-actor coordination and contribute to making local government competent to provide with the highest sincerity.
Dr. Mohammad Tarikul Islam is a Professor in the Department of Government and Politics at Jahangirnagar University, Bangladesh. Professor Islam has been a visiting scholar at Oxford, Cambridge, Harvard and SOAS. He can be reached at [email protected]. The author bears full responsibility for the facts cited and opinions expressed in this paper.
Are you a public servant who has had a wiggly or a squiggly career? Do you wish you had? Μaybe you think it’s just not that important? Or perhaps it’s just too difficult to do?
The idea of a squiggly career, in other words, thinking less about career ladders and more about sideways, downwards and cross sector moves, is one that has gained some interest over the last few years.
And it has a particular resonance in the context of public services.
For one thing, as working across organisational boundaries becomes more and more critical for public servants, so does the need to be able to speak the different ‘languages’ of different organisations and sectors. Having experience of actually working in those other settings could be a real help when it comes working across organisational borders.
Squiggly careers might also promote innovation – sideways movers bringing a fresh perspective on challenges and a handle on what has worked elsewhere.
And downwards moves might be important as well. Frontline experience helps to bring empathy and understanding – both for the people receiving public services and for those colleagues providing them.
Of course, it might not work for everyone. Some public sector professions have set career paths and it’s not always that easy to jump organisation or sector when you are in competition with the natives.
Even if a clean jump is not possible there might always be the possibly of placements and secondments.
And shouldn’t managers be promoting these kinds of experiences and career moves? After all, isn’t it good for individuals and isn’t it good for public services in general if workers have a variety of experiences to draw on when facing the complex challenges of 21st century public service?
We’d be interested to hear your thoughts on future public service careers, to inform our work updating the 21st Century Public Servant framework.
Dr Dave McKenna is an independent consultant and researcher who helps councils and other public bodies with training, research and improvement work. He is part of the research team currently updating our 21st Century Public Servant framework.
Maybe you love it, maybe you hate it, maybe you are somewhere in between. Either way you know that remote working is here to stay. Should we be happy with how it’s going though? Are public services adapting or struggling with this new normal?
A lasting legacy of the pandemic, the expansion of remote working is definitely seen a good thing by many public servants. Less travelling, a chance to keep an eye on things at home and a chance to stick the washing on. You can have your work space exactly how you want and, when so many public services are looking to save money on costly office accommodation, it helps with that as well.
Of course, it doesn’t work for everyone. Unwanted interruptions, not having a good space to work in and missing those ‘water cooler’ conversations are all negatives. Also, isolation, professional and social, can take its toll and affect mental health. It’s no fun taking a distressing call in your own home with no-one around to talk to about it afterwards.
Three years on from the first shock of the pandemic, a more complex picture of remote working is starting to emerge – something that we are picking up as part of refreshing the 21st Century Public Servant research 10 years on (link in the comments).
For example, is there something concerning about the way that remote working can divide teams? After all, when Joe is working at home the rest of us are left to answer the office phones or respond to the people turning up the front desk – and Jane is worried that Joe might not be really working at all. He certainly seems invisible.
There are also worries about people who joined their teams during lockdowns and formed their relationships with co-workers over Zoom. How might starting a job in ‘virtual limbo’ affect people when they finally start to meet their team in person?
We’ve also come across the idea that long term remote workers form stronger relationships with virtual co-workers and find it easier to distance themselves from work relationships they see as negative – perhaps withdrawing from their teams in a way that office-based staff might not.
And what about citizens? On the one hand public servants can be more accessible and might have more time due to less travel but is the quality of their interactions affected? When public servants are being asked to be more relational in their work can this be achieved in the same way through Teams or Zoom?
The challenge for public servants, it seems, is to adapt to remote working, or perhaps more accurately, to hybrid workplaces. To maintain the benefits of remote working while staying connected to co-workers and to the communities they serve.
We think it’s an intriguing topic of research and we are looking to learn more…
Dr Dave McKenna is an independent consultant and researcher who helps councils and other public bodies with training, research and improvement work. He is part of the research team currently updating our 21st Century Public Servant framework.