May’s Conservatives: closer to a genuinely national party than Thatcher in ’83?

General Election, opinion polls, YouGov regional poll, regional variations, 1983 General election, Margaret Thatcher, Sadiq Khan

You might think, given the record of opinion polls in the 2015 election campaign, that there’d be slightly fewer of them this time. Dream on! So far this month national voting intention polls have averaged well over one a day. Of the 28, precisely none have shown the Conservatives on less than 44% – that is, over 6% higher than they managed in the 2015 election; and just one – the ‘outlier’ of those published this past weekend – put Labour behind by less than 10%, compared to the 6.6% GB gap last time.

There is an iron law in opinion poll reporting: the more eye-catching and exceptional the finding, the louder it will be reported, and the more likely it is to prove a ‘rogue’ result. Unsurprisingly, therefore, this ‘single-figure lead’ poll prompted instant speculation about whether Corbyn’s Labour could win more votes than it did under Miliband, or even increase its return of 232 MPs, which at least temporarily displaced the McLuskey-prompted ruction about whether just 200 Labour MPs would qualify as a successful campaign.

That would in fact be Labour’s worst result since 1935, worse even than 1983, when under Michael Foot’s leadership it was reduced to 209 MPs. And, while the PM may understandably wince at personal comparisons with Margaret Thatcher, and in her party’s ‘Reddish Tory’ manifesto has certainly distanced herself ideologically, it still seems most likely that it is with that latter election that, as polling day approaches, statistical comparisons will be made – starting in the second part of this blog.

The first part looks at something arguably more interesting – the regional variations in current voting intentions, as collated by YouGov in a total GB sample of over 17,400 respondents, and compared to the actual votes in the 2015 election, summarised in the central sections of the table below.

Regional%20voting%20intentions%202.JPG

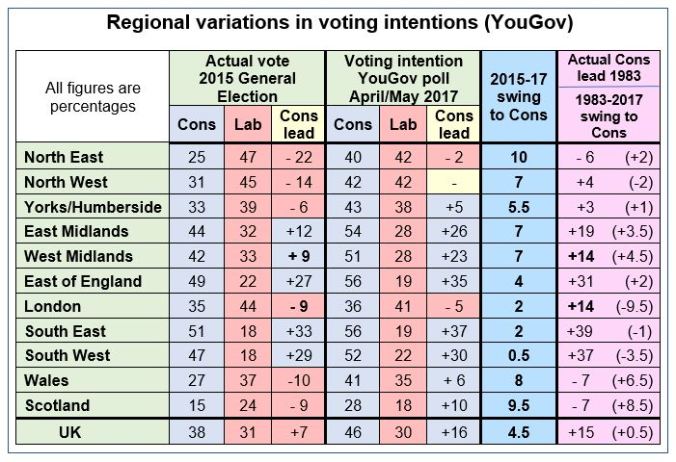
The ‘headline voting intention’ that would have been reported in YouGov’s late April/early May polls – that is, excluding ‘don’t know’s and ‘won’t say’s and weighted by respondents’ self-described likelihood to vote – would show the Conservatives with a 16% lead over Labour, with the Lib Dems on about 10% and UKIP around 7% and sliding.

The modesty of the Lib Dems’ post-2010 recovery, the recent collapse of UKIP, and the performance of other smaller parties are obviously important and will be decisive in many individual constituencies. But my main concern here is the bigger picture: the variation in the Conservatives’ current lead across the regions, and the extent to which the figures support the claim that Theresa May is increasingly keen to make of her party being truly national in its appeal and support.

We’re used to seeing political maps of the UK, whether of national or local government, from a ‘geographic’ viewpoint: each constituency or council a blob of appropriate colour the relative size of its land area. Shown such a map of the 2015 election results, an innocent visitor would probably conclude that, in England and Wales at least, we’re already there: more or less a one-party state. Even London, where Labour took 45 of the 73 seats, has to be magnified to look more than a red smudge in an ocean of bright blue.

Now, though, following the local elections, Conservatives actually are the largest party in every English county and county unitary authority except Durham, and the regional YouGov polls tell a similar story. The swing of support between the two major parties since May 2015, coupled with the respective performances of UKIP and the Lib Dems, has put us on the brink of becoming, as well as just looking cartographically, a one-party state.

In under two years, one English region, Yorkshire/Humber, has swung from majority Labour to majority Conservative. A second, the North West, has seen a 14% lead completely disappear. And, most strikingly, Wales and Scotland, for decades dominated almost monopolistically by Labour, are both currently showing the Conservatives with a clear two-party voting lead.

In general, and with one big exception, the below-average 2015-17 swings from Labour to Conservative have been in the already strongest Tory areas – the South East, South West, and East of England. And the above-average swings have been in the traditionally strongest Labour areas, where they can make the relatively greater electoral impact: the North East, an early deliverer in the form of an unexpected mayoral victory in Tees Valley; the North West, May’s choice for her launch of the party manifesto; the Midlands, Scotland and Wales.

The massive exception to all this is obviously London, increasingly unmoored in so many respects, it seems, from the rest of the country. Current voting intentions don’t quite match the 44% to 35% split in 2015, and with which Sadiq Khan won the mayoralty last year, but they’re very close.

London’s real political exceptionalism, however, is shown when we start comparing with 1983 and the figures in the final columns of my table. In that election the regional voting figures in London and the West Midlands were close to identical: 44/45% Conservative, 30/31% Labour, 25/27% SDP-Liberal Alliance, and in both cases a (highlighted) 14% Conservative lead.

By 2015 that lead had been reduced to 9% in the West Midlands, but in London had been reversed to one of 9% for Labour. And over the past two years that divergence has accelerated, with the Conservatives 23% ahead in the West Midlands and Labour 5% ahead in London.

The last (bracketed) column in the table is intended to take advantage of the fact that nationally the Conservatives’ current lead in voting intentions is effectively the same as that achieved by Margaret Thatcher’s party in 1983, and to see how the different regions compare and contrast.

Headed massively by London there are four minus signs, but the seven pluses suggest that May’s Conservatives are indeed developing a claim to be a more genuinely nationally supported party than we’ve seen for at least several decades.


Chris Game - pic

Chris Game is a Visiting Lecturer at INLOGOV interested in the politics of local government; local elections, electoral reform and other electoral behaviour; party politics; political leadership and management; member-officer relations; central-local relations; use of consumer and opinion research in local government; the modernisation agenda and the implementation of executive local government.

Queen Cersei and the evaporating Revenue Support Grant

Chris Game

Next week is the last week of Hilary Term, or revision week at the end of Spring Term, as it’s known here at the UoB and most other universities who feel no great affinity to the probably inappropriately named 4th Century St Hilarius of Poitiers. Over the many years in which I lectured undergraduates, I used rather to like it: end of the course/module in sight, legitimate chance to share and spread gossip about approaching local elections, lecture attendances boosted by students desperate for exam hints. Plus, nowadays, plenty of discussion-prompting visual aids – one of which is the pretext for this blog.

SIGOMA is not – disappointingly perhaps – an African hip-hop band, but less catchily the Special Interest Group of Municipal Authorities (outside London) within the Local Government Association. Yes, even the brackets are part of the full name – which has to convey that its 45-council membership comprises most major urban authorities in the North, some in the Midlands, plus the ‘South Coast regions’ of Plymouth and Portsmouth. The 45, claim SIGOMA, share similar characteristics and can therefore advantageously speak with a collective voice – moreover, with one that, particularly following the Coalition’s changes to the local government funding system, needs to be distinctive from that of the LGA with its responsibility for somehow representing the interests of all its 400+ member authorities.

These funding changes, argues SIGOMA, are so divisive, and their impacts so damaging to areas with characteristics like those of its members, that they threaten to set region against region in the manner of – well, Game of Thrones.  As even non-followers of the popular TV series may be aware, the US fantasy drama chronicles the violent dynastic struggles for control of the Iron Throne of the Seven Kingdoms of Westeros. SIGOMA’s spoof YouTube video is Game of Cuts Winter is Coming for Councils – and, at under 2½ minutes to Game of Thrones’ soon-to-be-five seasons, it’s inevitably (even) less subtle.

The Sean Bean character, Lord ‘Ned’ Starp, Warden of the North (possibly Steve Houghton, Leader of Barnsley MBC, SIGOMA’s administrative base?) and his mate from the Coastal Ports, protest that “our people are already on their knees … the sick have no one to care for them, and our children nowhere to read …”, while the spokesperson for “the hamlets of Bucks and Berks” remonstrates that they too are suffering, with “not enough funding to keep our tables supplied with swan and game”.  But sadistic Queen Cersei of the South and her incest-conceived son, King Joffrey, are unmoved: “All the regions have had to make their sacrifices. The money has been spread evenly and you will cope, for the sake of the Seven Kingdoms”.

Doubtless, Local Government Minister Kris Hopkins’ family arrangements are altogether more conventional, but his presentation of the 2015-16 finance settlement last December suggests similarly briefed scriptwriters:

“The local government settlement is fair to all parts of the country – north and south, rural and urban, city and shire – therefore every council should be able to deliver sensible savings while protecting frontline services for local taxpayers … Those facing the highest demand for services continue to receive substantially more funding. For example, Middlesbrough has a spending power per household of £2,441 which is £871 more than the £1,570 per household in Windsor and Maidenhead.”

As noted in my recent blog assessing that settlement this has been the standard – and increasingly disingenuous – government line for the past five years. That blog, though, was largely about ministers’ ploy – what one might call the ‘spending power sleight of hand’ – to mislead the media and public from the outset about the true severity of their cuts to the funding of the local government sector as a whole.  SIGOMA’s current campaign – Protecting Vital Services – is about the discriminatory distribution of the cuts within the sector, and particularly the impact of the funding changes since 2013-14, which cumulatively have switched the determination of government funding from assessed needs formulae to councils’ tax-raising capacity.

The big change was the introduction of the Business Rates Reduction Scheme (BRRS). It was cautiously welcomed by local government for its devolutionary principle, but SIGOMA-profile authorities were immediately concerned that, as BRRS funding increased and Revenue Support Grant (RSG) correspondingly decreased, the big gainers would inevitably be already prosperous authorities with higher rate-raising capacities, and the gap between them and the less well-off with the highest demand for services would continue to grow.

The New Homes Bonus Scheme (NHB) story was not dissimilar. It was launched in 2011-12 to incentivise local authorities to grant planning permissions for new homes and bring empty properties back into use. For each additional home they would receive for six years an annual bonus payment equal to the council tax generated – from the government’s own funding. Again, it was cautiously welcomed, although it was obvious that authorities with higher banded housing would be the bigger beneficiaries. But no sooner was it established than the government funding bit switched to a top-slicing of RSG, and again poorer authorities have been absolute, rather than just relative, losers.

The Council Tax Freeze Grant was slightly different, in being from the beginning a disadvantageous bribe to councils to cut their spending, but its relevance in this context is that it too is top-sliced from RSG. Put just these three policies together over the three most recent finance settlements, and RSG – the principal source of central government funding of non-schools revenue expenditure and traditionally the mechanism for recognizing councils’ differing resource needs – has shrunk as a proportion of local government funding by over 5% a year.

Chart Game blog

SIGOMA calculates that over just these three years authorities with higher grant dependency and greater formula share in RSG have lost proportionately twice as much (around 20%) as those with more buoyant rates bases and greater protection within RSG (around 10%).

Incidentally, further confirmations of deprived areas suffering most harshly from the government’s cuts have been produced over the past few weeks alone in an Institute for Fiscal Studies Briefing Note, by the Association of North East Councils, and, most tellingly, in evidence from the DCLG itself in the Public Accounts Committee’s report on the Financial Sustainability of Local Authorities (paras 8ff.).

Game of Cuts doesn’t go into the intricacies of RSG that SIGOMA’s Protecting Vital Services study does, confining itself to the billboard-style message that “Since 2010 local government in England has lost more than 40% of its core funding. Urban authorities, largely in the North and the Midlands, have lost the most money as a result of these cuts.” You don’t get SIGOMA’s proposed ‘fair and sustainable’ three-block future funding model either, but both productions, in their very contrasting ways, are worth a look – even if you don’t have a bunch of students to entertain.

Chris Game - pic

Chris Game is a Visiting Lecturer at INLOGOV interested in the politics of local government; local elections, electoral reform and other electoral behaviour; party politics; political leadership and management; member-officer relations; central-local relations; use of consumer and opinion research in local government; the modernisation agenda and the implementation of executive local government.