The Jaws of Doom – still relevant a decade on

Chris Game

“Things from the past you’ll never see again”.  I came across a listing of these recently, and they were – well, moderately interesting. More so, anyway, than the accompanying “trends that have unfortunately returned” – pleated skirts, corsets, and structured vests, whatever they were.

The never-see-agains included smoking adverts, bubblegum cigarettes, and rotary push lawnmowers – to which I might easily have added “The Barnet Graph of Doom” as at least a never-expected-to-see-again.

It was a visual aid devised a dozen or so years ago primarily for the councillors of the London Borough of Barnet. It would come, however, to be associated with/appropriated by Birmingham City Council, and something with which some INLOGOV colleagues were so taken that it was discussed and illustrated in these pages not once but repeatedly – by, inter alia, me in May 2012 and January 2013 and the Institute’s then Director and this blog’s progenitor, Catherine Staite, in December 2012 and October 2013. Indeed, as Catherine notes in that second blog, it at least part-prompted an INLOGOV ‘book’ or, more accurately, Discussion Paper.

Impactful at the time, then, but at least not prominently, I presumed, over the ensuing decade. Certainly I, though at best semi-detached from these matters nowadays, was genuinely surprised to be confronted by its reappearance in a recent Financial Times (indeed, its double reappearance). Somewhat less so that it was credited entirely to Birmingham City Council, with Barnet getting, as my mother would have said, nary a mention. Which justifies at least a brief résumé, and for more senior readers a bit of reminiscence.

Some 15 years or so ago the very Conservative Barnet LBC acquired the not entirely flattering moniker of ‘easyCouncil’ – that precise orthography/spelling, though frequently ignored in the media, being arguably the policy’s most appealing attribute. With its stray upper-case C intendedly referencing the easyJet business model that inspired the council’s almost boundless outsourcing drive for no-frills efficiency, it embraced pretty well all services, from reduced-size waste bins and privatised street cleaning to limited ‘personalised’ adult social care budgets.    

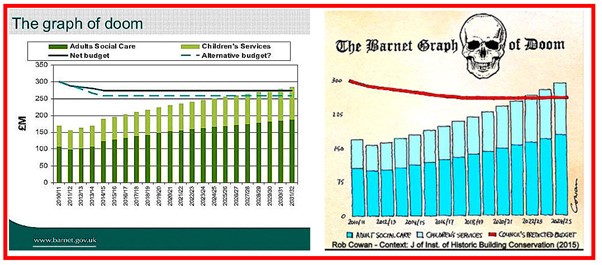
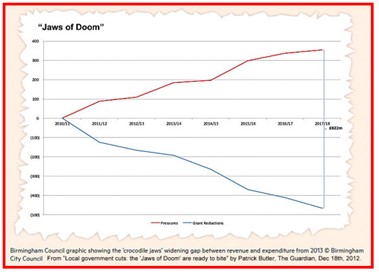
Improved and cheaper services were obviously the aim, but senior officers foresaw that the sheer scale of demographic change – more children, more elderly – would in any foreseeable future take up an unmanageable proportion of the Council’s increasingly constricted budget. “No libraries, no parks, no leisure centres – not even bin collections”.  Hence the original Barnet Graph of Doom. The one on the left of the illustration, that is – the other, pleasing if more alarmist one, being a public ‘reminder’ tweeted a few years later, just as the social services budget was seriously taking off as forecast.

The Barnet graph, described at some length in my first blog and more summarily by the Guardian’s Public Services editor, David Brindle, started life as part of first a PowerPoint, later video, presentation used by the Council’s Chief Executive, Nick Walkley, to:

“focus the thoughts of colleagues and councillors …  In five to seven years we get to the point where it starts to restrict our ability to do anything very much else. Over a 20-year period, unless there was really radical corrective action, adult social care and children’s services would need to take up the totality of our existing budget.”

The tone, as Brindle noted, was deliberately alarmist, with the policy making no provision, inter alia, for Barnet’s anticipated rise in income through regeneration schemes. As an illustrative device, though, it was hugely effective. It featured regularly in local government media, and also in presentations by the late Sir Bob Kerslake – then Permanent Secretary at the DCLG, and whose outstanding career in both central and local government was fulsomely recounted following his recent death.

Alarming, yes, but “Where are the jaws?”, I hear you ask – and, of course, there weren’t any, yet. They were Birmingham Council’s contribution when it took the idea over and “simplified/dramatised” it by, as Patrick Butler put it, again in The Guardian, projecting “a ‘budget pressures’ line rising steeply to the top right of the grid, and a ‘grant reductions’ line crashing to the bottom right.”  It featured prominently as a ‘Jaws of Doom Graph’ in the council’s 2013 Budget Consultation document, and could indeed resemble, as Butler suggested, “a child’s depiction of a shark, or crocodile, about to bite its prey. Lunch, in this case, appears to be local government itself.”

In my January 2013 blog I sought to address the question of whether the ‘doom-mongering’ was entirely fair: Were “Birmingham and urban councils generally, or Labour councils, or the country’s most deprived areas, being particularly harshly treated by the government’s grant funding cuts?”

Which, you’ll be relieved to learn, I’ll not be bothering you with here – not least because, as already noted, for the vast bulk of the past decade I’ve personally given these particular ‘Jaws of Doom’ and their graph scarcely a passing thought. Now, though, I wonder whether that’s simply another consequence of a retiree’s detachment from the daily concerns and parlance of local government personnel. Could it be that this is what today’s finance officers jaw about, as it were, down the pub of an evening?

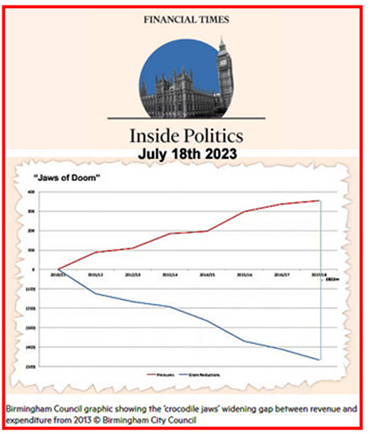
For suddenly there it was, weeks before the journalistic ‘silly season’, and in ‘The Pink Un’ – no, not Norwich City FC’s newsletter, but the albeit self-styled “worldʼs leading global business publication”: “The Jaws of Doom” graph in its original glory, and not once but twice. First, in a kind of editorial intro by Associate Editor, Stephen Bush, commending to readers William Wallis’ “excellent piece … featuring this alarming chart [shown on the right below] about the … ‘jaws of doom’ facing local authorities”.  And then Wallis’ article itself.

As you’d expect, it’s a good summary presentation – that I’d certainly be recommending to students, if I still had any – the thrust of which is that:

 “for more than a decade, local authorities in England have been sacrificing services and staff to what they call “the jaws of doom” – a reference to a graphic produced by Birmingham city council to show worsening budgetary pressures, that resembled a crocodile’s mouth.

Between rising demand for social care and other essential services, and the dwindling funds councils have received to provide these, discretionary spending on everything from libraries to youth clubs has already been eaten up.

Although local authorities won a better than usual financial settlement for 2023-24, 9.4% up on the year before, inflation running at 8.7% is eroding any benefits.”

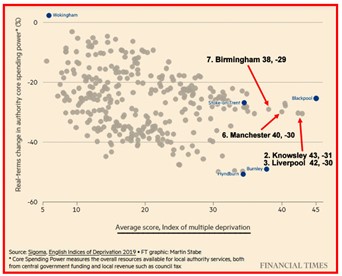
And, having already well exceeded a thousand words, that’s where I’ll stop … though not before sharing the interesting and, more importantly, interactive graph of Sigoma’s English Indices of Multiple Deprivation also included in Wallis’ article – not new, so doubtless familiar to some readers, but to me unfamiliar, informative (see added results), surprising in places, and, I felt, worth sharing.  It made me (almost) sad not still to be lecturing and so able to play with it in public, as they say!

Chris Game is an INLOGOV Associate, and Visiting Professor at Kwansei Gakuin University, Osaka, Japan.  He is joint-author (with Professor David Wilson) of the successive editions of Local Government in the United Kingdom, and a regular columnist for The Birmingham Post.

Lessons from literature for local government

Professor Catherine Staite LLB, MBA, FRSA

No man is an island entire of itself: every man is a piece of the continent, a part of the main;

If a clod be washed away by the sea, Europe is the less, as well as if a promontory were,

As well as any manner of thy friends or of thine own were.

Any man’s death diminishes me because I am involved in mankind,

And therefore, never send to know for whom the bell tolls;

It tolls for thee.

John Donne

When every week seems to bring news of yet another major failure of governance in a local authority, some members and officers in other councils will be fearful that the same fate will befall their own council before too long, while others will be confident that all will be well for them.

When we look at the notable governance failures that have occurred in recent years, we see a very complex picture. Causes of failure are many and varied, ranging from the absence of the most basic controls to ambitious but risky money-making schemes. Some patterns are visible in all the complexity, including, failure to listen to officer advice, engaging in commercial activities without the requisite skills and knowledge, weak financial controls and opaque decision-making processes.

Councils need both strong rules, about finance and behaviour and strong public service values. Constant vigilance and honest collective self-reflection are vital to ensure that decision makers are independent, transparent, accountable, behave with integrity, have a sense of shared purpose and focus on outcomes. Ask yourself – are our informal and formal governance arrangements fit-for-purpose? If not, where might the weaknesses lie? Look at your structures. Are your Constitution, Codes of Conduct and Standing Orders up-to-date? Is your organizational structure robust? Are your s151 officer and Monitoring Officer on the senior management team and do they report directly to the Chief Executive? Then look at your systems. Are decision making processes clear? Can projects be started without the right sign-off? Can officers exceed their authority without consequences? Last, but by no means least, take a long hard look at organizational behaviour. How do leading politicians and officers respond to being challenged? Is bad behaviour rife but undiscussable?

It’s important to avoid complacency. Most of the members and officers leading and managing councils that have failed to uphold the best standards of good governance either thought what they were doing was fine, or that they could get away with it. Sometimes those who are part of an organization are the last to notice how the patterns of weak governance and bad behaviour, which have become so familiar that they cease to be noticed, will eventually lead to their downfall. Even when officers can see that their council is not going to able to balance its books or manage its risks, it can be difficult to speak up if members do not want to listen and it can be career limiting when a bullying culture prevails. Although statutory officers have statutory powers and duties, they are will not be protected from retaliation if they are perceived to be raining on the parade of colleagues and members who, because of ambition or political expediency, have lost sight of what good governance looks like. The statutory protections that attach to senior roles are not proof against bullying or actions amounting to constructive dismissal. The power imbalance between members and officers remains significant because while members may lose positions of power, or even their seats, officers risk losing their livelihoods and even their careers.

Those members and officers who consider themselves safe from failure may take some guilty pleasure from the failure of another council, especially if its run by another party. Councils have been encouraged to compete with each other for funding and kudos, so perhaps it’s natural to feel that the standing of better run councils goes up when the reputations of failing councils go right down. That’s a big mistake, for two very strong reasons; failure of one local authority reduces public confidence in local government as whole and it gives central government convincing reasons for not delegating resources and power to a local level. For all that we refer to ‘sovereign’ councils, no council is ‘an island, entire of itself’ and the failure of one diminishes all. When we open the LGC or MJ, to see for ‘whom the bell tolls’ we should hear the message that ‘it tolls for thee’.

Picture credit: Maggie Meng https://www.flickr.com/photos/snowfish2014/

Catherine is a researcher, consultant and coach who specialises in strengthening leadership, improving governance and supporting senior politicians and managers.  She is an independent consultant with Darlingburn, a small consultancy practice and is working with Grant Thornton on local government audit, specializing in governance. She was the Director of the Institute of Local Government Studies (INLOGOV) at the University of Birmingham from 2011 to 2017.

A Japanese view of Jeremy’s budget

Chris Game

I had an interesting Budget week. I was part-hosting a Japanese academic colleague – Prof Toshihiko Ishihara (Kwansei Gakuin University) and his wife, Midori – making their first overseas trip since Covid. They briefly visited Birmingham, where Toshi was an erstwhile INLOGOV Associate, but were based in London, where I’d agreed to organise a theatre visit.

I’d booked tickets for a well-reviewed modern-day play, Romeo and Julie, loosely based on one of Shakespeare’s. Single-sentence synopsis: Julie – a bright, Cambridge University-bound, aspiring astrophysicist – is emotionally torn between uni and her affection for young single dad, Romeo, effectively sole carer for his baby daughter afflicted with Poonami.  

No, the Poonami doesn’t feature in Shakespeare’s version, but, researcher that I am, I’d discovered it’s a real medical thing, meaning affected babies’ sudden, massive, uncontrollable bowel movements. Better still, that etymologically Poonami derives directly from the Japanese tsunami – a sudden, volcanic, unstoppable wave. My guests were delighted – and the play too was excellent.   

The following Wednesday, however, was Budget Day – followed by the Birmingham Post’s impassioned coverage of our region’s “Power grab”, the “seismic shift in devolution as West Midland leaders take more control from Whitehall”, etc. (pp.1,7) – guaranteeing some amused but tricky questions from someone who both lives with and studies serious mayoral governance.

It was the national news headlines, though, that I was obliged to address first, and the UK’s “unsustainable … biggest since the war … tax burden” – characterised by Chancellor Jeremy Hunt as something horrendous and to be avoided, certainly by a Conservative Government, at almost any costs.

We’re not Basil Fawltys, but my Japanese friends and I tend not to mention ‘the war’ that much. Anyway, the timescale wasn’t really the issue. It was that highest-level tax forecast of 37.7% of Gross Domestic Product (GDP) – and yes, we do make life harder by colluding in almost invariably labelling it a “tax burden”, rather than, say, the “quality-of-life price” that the tax helps pay for.

What Toshi and other Japanese students of these things invariably query is: why the excitement/horror over a tax-to-GDP ratio currently almost identical to theirs? Yes, ours is indeed a higher ‘burden’ than those of, say, the US or Switzerland. But, as shown in the Office for Budget Responsibility’s Chart A, both we – at roughly 34% of GDP – and Japan are currently in the bottom third of “advanced economies”, and even at a forecast 37.7% we’d still be mid-table and some way BELOW both most sizeable West European countries, plus bits of Eastern Europe too.

It’s interesting. Pollsters never ask us if we prefer NOT being an ‘advanced economy’ – you know, one with fully staffed and functioning health and social services, decently funded schools, reliable public transport, etc.?  And I’m not sure how collectively we’d answer. Clearly, these things do cost money, yet we obviously like visiting these higher-taxed places for our holidays.  Not Denmark perhaps – top, with its 47% tax ‘burden’ – but France, Austria, Italy, Scandinavia, Greece, Spain, Portugal, etc.

It’s presumably at least partly these countries’ ‘quality of life’ (QoL) that attracts us – which, unsurprisingly, correlates broadly with ‘tax burden’. There are several QoL indexes, one being Numbeo’s. It’s not the most methodologically sophisticated, but it does produce nice maps, collectively summarising its measures, which include purchasing power, safety, health care, cost of living, and pollution.

Netherlands, Denmark and Switzerland are currently top, scoring nearly 200 QoL points. Then the usual suspects – Finland, Iceland, Austria, Australia, New Zealand, Japan (13th) etc. – down to No.21 – UK 166.4, just ahead of Croatia. Disappointing, but could be worse – bottom at 84th is red Nigeria, not with ‘nul points’ exactly, but only 40.

The underlying, systemic problem, obviously not mentioned by Chancellor Hunt, is precisely his Department: His Majesty’s Treasury – first time I’ve typed that! – and its overbearing central funding control, currently exercised politically and communicated by him. And formerly by, among others, one George Osborne – which is where the irony starts. When Chancellor of the Exchequer, Osborne launched, and currently chairs, the Northern Powerhouse Partnership (NPP) – self-described as “the leading voice of business and civic leaders across the North”.

And currently a very shouty voice. For, within days of Hunt’s Budget pronouncements, along came Osborne with his NPP ‘wrecking ball’ – a clumsily titled but potentially headline-making report: Fiscal DevoNation – The Blueprint for How to Devolve Tax to the Regions of England. The Treasury, he and his Powerhouse chums now reckon – and as local government has complained for years – far from being the provider of solutions, is itself the problem. Its voice is the overwhelmingly dominant one in what Osborne nowadays sees as a damagingly over-centralised fiscal system. Just like when he was boss.

The NPP’s solutions involve, at least eventually, full-scale fiscal devolution. The “most unfair” council tax – with its outdated property values – stamp duty (paid on purchasing residential property), and business rates should all go, eliminating the Treasury’s all-powerful role altogether. The at least eventual replacement, following a comprehensive revaluation of all homes, would be a locally set land value tax, plus three new council tax ‘super bands’ for the most valuable properties, with revenue to be shared across the country.

Yep – that’s radical, but there’s more – like the localised hotel tax that numerous other countries already have, which NPP reckons could raise an annual £5.5 millions for the Lake District alone.

But I digress – from what my Japanese visitors really wanted to talk about: that Budget highlight of a “seismic shift” in devolution, to the West Midlands and Greater Manchester regions, and their elected Mayors, Andys Street and Burnham, who will get new multi-year devolution funding deals, and be allowed to retain business rates – to be followed by further such agreements across England.

At the time of writing, there hadn’t been a direct response from Northern Powerhouse as to how far down the ‘full-scale fiscal devolution’ road this might take us. As for a Japanese reaction, well, this blog is already overlong; but their response would probably start with the country’s written constitution, and the local government chapter guaranteeing its role and “the principle of local autonomy”. It’s an ultra-crude summary, but basically the national state does currency, diplomacy and defence, and pretty much everything else is left to the 47 prefectures and 1,700 or so municipalities. And heading those municipalities … directly elected mayors!

As the American phrase puts it: ‘Way to go’ – in both senses.  

_____________________

This is an adapted version of an article that appeared in the March 23rd edition of the Birmingham Post.

Chris Game is an INLOGOV Associate, and Visiting Professor at Kwansei Gakuin University, Osaka, Japan.  He is joint-author (with Professor David Wilson) of the successive editions of Local Government in the United Kingdom, and a regular columnist for The Birmingham Post.

Mission Possible? 

Jason Lowther

With under 700 days to the next UK general election, political parties are busy developing their manifesto documents.  In February, Labour leader Keir Starmer made a major speech laying out his “five missions for a better Britain”.   How do these five missions relate to local government?  And is the turn to “mission driven” government likely to work?

The five missions vary in their level of specificity and challenge.  Securing “the highest sustained growth in the G7, with good jobs and productivity growth in every part of the country…” is a little vague but likely to be difficult, especially given we are currently ranked 6 out of 7 in terms of output per worker.  Mission #2, “make Britain a clean energy superpower”, accelerating the move to zero-carbon electricity from 2035 to 2030, is specific but very challenging.  Mission #3, reform of health and social care and reducing health inequalities, will require a re-focus from secondary (hospital) care to social care and addressing the social determinants of health.  Mission #4 is about community safety, and likely to involve more community policing.  Finally, mission #5 is to “break down the barriers to opportunity at every stage” through reform to the childcare and education systems.

Local government potentially has important roles in each of the five missions.  Local education, skills and economic development functions will be critical to improving productivity.  On energy, Net Zero requires at least a doubling of electricity generation by 2050, from decarbonised sources.  Decarbonisation strategies need to be place-based, taking account of the geography, building types, energy infrastructure, energy demand, resources and urban growth plans.   We’ve recently argued here for the key roles of councils in this area. 

Turning to health and care services, local government clearly has leading roles – including ensuring place-based planning to address the social and behavioural causes of health inequalities.  Analysis by the Liverpool and Lancaster Universities Collaboration for Public Health Research in 2021 concluded: “investment across the whole of local government is needed to level up health including investment in housing, children’s, leisure, cultural, environmental, and planning services”.  Similarly community safety, child care and education are areas where local government could be enabled to have much greater positive impact.

Perhaps as important as the specific “missions” is the approach to governing which the party is proposing.   Labour’s document characterises this as a move from top-down, target-led, short-term, siloed approaches, to government which is more “agile, empowering and catalytic”, working across the public and private sectors, and civil society.  This, it argues, requires organising government around a shared vision, focusing on real world outcomes, concentrating on ends with flexibility and innovation concerning means, devolving decision making from Westminster, increasing accountability including central and local data transparency, and adopting long-term preventative approaches including greater financial certainty for local areas. 

In some ways the idea of mission-driven government echoes the 1990s thinking of Ted Gaebler and David Osborne’s book “reinventing government”, which argued for a more entrepreneurial approach to the delivery of government.  Their work pointed to entrepreneurial companies setting overall missions and goals, and then leaving managers to figure out how best to deliver these – for example, by providing an overall budget for a service rather than detailed line-by-line budgets which disappear if not spent by year end.  The focus on managers rather than considering the perspective of politicians is one of the problems identified in subsequent evaluations of the reinventing government model, together with difficulties in sustaining the approach.

Mission-driven policies addressing ‘grand challenges’ of society are increasingly common, for example in the UN Sustainable Development Goals and various EU policies.  Mazzucato et al recently argued that addressing such challenges requires strategic thinking about: the desired direction of travel, the structure and capacity of public sector organisations, the way in which policy is assessed, and the incentive structure for the private, public (and I would add community) sectors. Labour’s paper makes a start (albeit at a very high level) on thinking through these areas. The litmus test, though, will be in developing the detail and how far this engages with local areas.   

Over the next few months, we will be contributing to the debate on the upcoming party manifestos with some research-informed thoughts on a variety of local government related policy areas.  If you would like to be involved in developing these, please get in touch

Jason Lowther is the Director of INLOGOV. His research focuses on public service reform and the use of “evidence” by public agencies.  Previously he worked with West Midlands Combined Authority, led Birmingham City Council’s corporate strategy function, worked for the Audit Commission as national value for money lead, for HSBC in credit and risk management, and for the Metropolitan Police as an internal management consultant. He tweets as @jasonlowther

Picture credit: BBC

In (Climate) Emergency Break The Mould 

Paul Joyce, Philip Whiteman and Jason Lowther

Cities must be at the heart of a successful response to the climate crisis. Hundreds of local authorities in the UK are acting responsibly by taking the climate crisis seriously, whether it is by setting net zero targets or proclaiming a climate emergency. But they will be hampered in their endeavours for a number of reasons, including the significant capacity constraints that contradict their aspirations, even though national government in the UK has also set a net zero target.  

Support for local government action could increase if government ministers listen to the recommendations of a report by the Rt Hon Chris Skidmore  Environmental Audit Committee (EAC) Chairman, who issued a report on  how the UK could better meet its net zero commitments.  It’s an impressive piece of work, reflecting over 1800 written submissions as part of the official Call for Evidence.  Central to its recommendations is the need for central government to empower regions, local government and communities to play a greater role.    

We should acknowledge that on some measures the UK is already performing relatively well on environmental issues, particularly in reducing greenhouse gas emissions.  The UK was placed joint second in Yale’s global Environmental Performance Index 2022, with Finland and behind Denmark.  It achieved the fastest improvement of the three countries (and third best globally) in the last decade. Between 1990 and 2020, the UK reduced emissions by almost 50%, driven in part by a reduction in the use of coal and toward natural gas and renewables.  Some of this success stems from historic decisions such as the 2008 Climate Change Act, which committed the UK to reaching 80% emissions reductions by 2050, and actions such as the introduction of a carbon price floor in 2013 and investments in solar and wind energy.   

It may become more difficult for the UK to keep performing well as new, more challenging actions are needed.  The EAC report is clear that local government is critical to developing and implementing the necessary actions, and that this requires a fundamental change in its relationship with central government.  We highlight four essential changes. 

First, simplify net zero funding arrangements.  The report is clear that “current central government funding arrangements are standing in the way of effective local action”.  The funding landscape is disjointed, unfair, and expensive for local authorities because of its complexity and reliance on short-deadline competitive bidding.  

Secondly, trust local government.  The report recognises that “to achieve a place-based, place-sensitive, locally-led transition to net zero, Government must place its trust in local leaders and communities to deliver”.   Analysis by UKRI found that a “place-specific” approach to decarbonisation costs 70% less and delivers 90% more benefits than one which is “place-agnostic”.  The report recommends a high-level framework and an agreement to close future partnership working between central and local government. 

Thirdly, allow local communities to determine their priorities and approach within the national framework.  The report recommends a new statutory duty on local authorities to take account of UK net zero targets.  Disappointingly, government is asked to back only “at least one” Trailblazer Net Zero city, local authority and community, with the aim for these places to reach net zero by 2030.   

Finally, align the planning system with net zero ambitions.  The current framework sometimes stands in the way of councils insisting on high standards.  And cumulative cuts to planning department budgets mean many councils lack the staff to deliver effective planning inputs quickly.  As the report says: “Reforming the relationship between central and local government on net zero will empower local authorities to deliver place-based, place sensitive action and unlock the high levels of local net zero ambition that we have across the UK. Unblocking the planning system and aligning it more closely with net zero will enable widespread pro-growth, net zero development” (p.189).  

In our discussions with local councils, we often find strong aspirations to address the environmental agenda.   To turn green aspirations into reality, we need city and town governments that are properly empowered and resourced to achieve this.  One of our concerns is that while the local authorities in the towns and cities are positive about cooperating with central government to promote sustainable development, their capacity is limited by comparison with European counterparts such as Sweden, Germany, The Netherlands, Norway, and Denmark.  In consequence, the centralised approach to public governance in the UK has produced little “depth” to sustainable development by public authorities.   Furthermore, we note that whilst may local authorities aspire to improve the environmental agenda, there is often a lack of specific or explicit connectivity to international targets, comparing less favourably to local authorities in other countries.

It is time to empower local government to become a powerful means of transformation of UK society, to give them much more fiscal autonomy, and to give them a strong mandate for sustainable development of cities and towns.  This needs to be effective not just for the biggest cities, but also for smaller cities and towns where the capacity is sometimes more limited.  Chris Skidmore’s report has recognised many of these issues, we now need to break the mould and give local government the mandate, capacity and collaborative approach it needs to succeed. 

Paul Joyce is an Inlogov associate.  Paul has a PhD from London School of Economics and Political Science. His latest book is Strategic Management and Governance: Strategy Execution Around the World (Routledge, 6 June 2022). He is a Visiting Professor in Public Management at Leeds Beckett University.

Philip Whiteman and Jason Lowther are Inlogov staff members.

Is Government Giving Value For Money?

Jason Lowther

When money is short, how we spend it becomes even more important. As central government reheats its arguments for austerity following the chaos of the last few weeks, I’ve been reflecting on the contents of the 2021 budget (just a year ago).  The 2021 budget set out not just spending plans, but also a souped up approach to measuring outcomes and cost-effectiveness of government spending. How are these playing out, and will they survive the No 10 merry-go-round?

Rishi Sunak, then eight months into the job as Chancellor, noted that government borrowing was relatively high after the pandemic, warned of the public finances’ exposure to rises in interest rates, and outlined how spending was being linked to the delivery of outcomes alongside across the board ‘efficiency savings’:

The fiscal impact of a one percentage point rise in interest rates in the next year would be six times greater than it was just before the financial crisis, and almost twice what it was before the pandemic…

Decisions have been based on how spending will contribute to the delivery of each department’s priority outcomes, underpinned by high-quality evidence. The government has also taken further action to drive out inefficiency; SR21 confirms savings of 5% against day-to-day central departmental budgets in 2024-25. (page 2)

The “priority outcomes” are the latest in a long line of attempts to prod government spending into delivering effectively on political priorities, rather than blindly increasing/decreasing by x % compared to last year.  A 2019 report from the Institute for Government helpfully outlines many of these earlier initiatives (summary from the House of Commons Library) including:

  • “Scrutiny programmes” and the Financial Management Initiative (FMI), introduced under Thatcher.
  • The Cabinet Office and Treasury set up the Financial Management Unit (FMU) in 1982 to help with creating plans under the FMI.
  • The “Next Steps” report, published in 1988, which recommended the establishment of executive agencies to carry out the executive functions of government.
  • Tony Blair’s administration developed a greater focus on performance targets and Public Service Agreements (PSAs) which put these targets on a formal basis.
  • In 2001, Blair’s government also set up the Prime Minister’s Delivery Unit (PMDU), which was intended to coordinate PSAs and bring them under more central control.
  • Under the coalition government in 2010-15, PSAs were abolished and replaced with Departmental Business Plans (DBPs). These shifted the focus from targets to actions – in other words, they listed what each department would do and by when, rather than what they sought to achieve.
  • Under the Conservative government in 2016, DBPs were renamed to Single Departmental Plans (SDPs), which were themselves renamed to Outcome Delivery Plans (ODPs) in 2021. According to the NAO, SDPs (and by extension, ODPs) are supposed to be “comprehensive, costed business plans”.

As well as having to write down what outcomes they want to achieve, and how they will know whether that is happening, under the SDP system departments were also required “to assess progress in delivering their priority outcomes [and] … share regular performance reports with HM Treasury and the Cabinet Office”. 

In the 2021 spending review, the departmental outcomes were spruced up to reflect the (now last-but-one) PM’s five priorities of levelling up; net zero; education, jobs and skills; recovering the NHS; and reducing the volume and harm of crime.  

This blog’s audience may be interested in “Where does local government fit in this compendium of key priorities?”  The answer is a little depressing: on the last line of the last page (page 30 of 33), just before the devolved government departments. The relevant outcome is inspiring enough: “A sustainable and resilient local government sector that delivers priority services and helps build more empowered and integrated communities”, albeit with the reassuringly non-SMART measure that “the department will provide narrative reporting on progress for this outcome”.  Of course I exaggerate, because local government has critical inputs to very many of the earlier outcomes too, but it’s hard not to conclude that local services and communities were not yet at the top of the ministerial attention list.

Will the “priority outcomes” survive the whirlwind of ministerial movements and unforced economic missteps?  After the last seven weeks, I’m not going to make predictions – but we should know in the next month, and alongside the financial figures they could be our best hint yet on where a Sunak government is heading.

Picture credit: https://www.youtube.com/watch?v=Du_6mRV8Hm8

Jason Lowther is the Director of INLOGOV. His research focuses on public service reform and the use of “evidence” by public agencies.  Previously he worked with West Midlands Combined Authority, led Birmingham City Council’s corporate strategy function, worked for the Audit Commission as national value for money lead, for HSBC in credit and risk management, and for the Metropolitan Police as an internal management consultant. He tweets as @jasonlowther