Chris Game
In the Electoral Reform Society’s recent review of the King’s Speech the first “conspicuous omission” identified, ahead of democratically reconstituting the Lords and electoral reform, was the repeal of Voter ID – “an unnecessary step backwards for our democracy and should be scrapped before it causes any more damage”. Though I’m an ERS member, that’s not my personal view – as I’ve previously indicated, here and elsewhere – which is partly why I embarked on what has become a two-part blog, of which this is the second and – I promise! – final instalment.
Rationalising post hoc, the first part summarised the key data – published mainly by the Electoral Commission in its June Interim Analysis of the Voter Identification returns from Returning Officers, its September Demographic Analysis Research, plus its specifically Voter ID-related policy-and-practice recommendations. This second instalment covers, or at least references, some of the varying and more eye-catching reactions to all these data.
The first of which – partly for its comprehensiveness, but also because it provided the blog’s chosen title – is the early September review published on behalf of the All-Party Parliamentary Group (APPG) of senior MPs and Peers on Democracy and the Constitution and funded by the Joseph Rowntree Reform Trust. Undertaken by a cross-party panel chaired by Jon Nicolson (SNP), its four main conclusions were that:
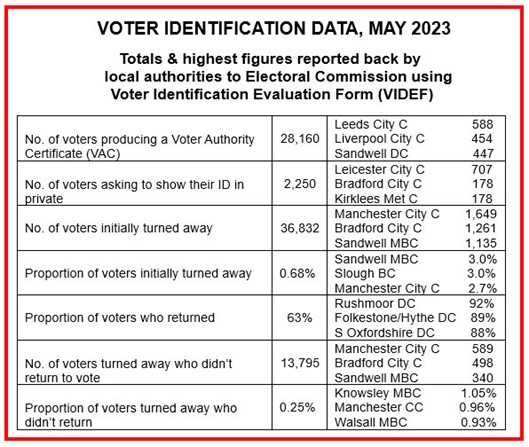
- The voter-ID system, as it stands, is a “poisoned cure”, disenfranchising more electors than it protects. It quotes the well publicised statistic of there having been just eight convictions/cautions for personation in person since 2013, plus that detailed in the earlier blog of more than 14,000 possibly entitled voters having been turned away by ‘greeters’ in May before even entering the polling station – sufficient, arguably, to have swung the result of up to 16 constituencies in the 2019 General Election.
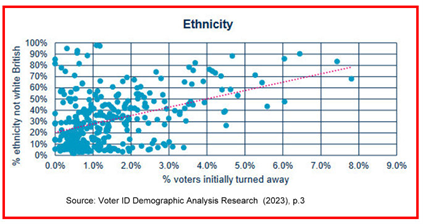
- The regime’s inherent ambiguity creates a real risk of injustice and potential discrimination. Most obvious – “shamelessly obvious” to quote the Guardian’s Polly Toynbee in her coverage of the topic – was the selection of documents acceptable as ID, discriminating particularly, but not only, against young persons: Oyster 60+ passes [requiring proof of name and address] acceptable, but not student IDs, library cards, bank statements, etc. The panel also noted that “independent observers” had recorded evidence of racial and disability discrimination at polling stations, with “non-white people being turned away even when they had qualifying ID, while some white people were permitted to vote without showing ID at all.”
- The regime lacks the flexibility necessary to avoid injustices – being over-reliant on decisions made by polling clerks and presiding officers, against which there is no formal right of appeal.
- The problems identified are systemic, but not fundamental – meaning that, with targeted reforms, the voter-ID regime can, as in many other states, be an asset to UK democracy. That was my emphasis, and, for what it’s worth, with all Europe and almost all developed countries requiring in-person voters to use photo ID, the panel give less emphasis to this point than I would have. A corollary of that point, however, is that these countries have polling station staff familiar with the demands of voter ID, and there is growing evidence of the need to address with some urgency the recruitment, training and retention of electoral staff.
Overall, the panel’s conclusion is that the regime should remain in place, subject to three main structural reforms:
- Permit electors to ‘cure’ a failed ID check by utilising an existing mechanism in UK law and signing a declaration attesting to their identity and right to vote (as in Canada).
- Broaden the range of accepted identification documents and in doing so set clear criteria for deciding which forms of ID are accepted.
- Provide better training for polling station officers.
It’s a lengthy production (well over 100 pages, incl. research appendices) and a recommendable one for anyone new to the topic, not least in reminding us how the VID debate was actually kicked off – by a 2010 BBC Panorama investigation, leading eventually to a 2015 High Court case in which Tower Hamlets’ then Labour (and today Aspire Party) Mayor, Lutfur Rahman, was found guilty of involvement in a string of “corrupt and illegal electoral practices”, one of which was ‘personation’.
Whereupon the Cameron Government instructed its ‘Anti-Corruption Champion’, Sir Eric Pickles, to prepare a report examining electoral fraud – one of whose 50 recommendations was that it should consider options for electors having to produce personal ID before voting at polling stations. Which led in turn to the 2018/9 trials, which reported a degree of increased public confidence in elections where VID was required – but not, as the All-Party review notes (p.9), that “electoral fraud ranked consistently last in public perception of problems around elections” [and administrators’ perception – see table below], or that they are “far more concerned about political funding and the redrawing of constituency boundaries than about personation”.
If the legislation did eliminate personation, the APPG’s view was that this came at the cost of “disenfranchising” electors: preventing or discouraging certain electors from voting – considerably more than the recorded 14,000 or so without ID who failed to return after being turned away by polling station staff. Excluding those turned away by party political ‘meeters and greeters’, this number was considered for several reasons to be “a significant underestimate”.
The democratic cost, in the name of preventing in person personation – occurring, on average 0.88 times p.a. – was to deny at least 14,000 people the opportunity to cast their ballot, which is “unacceptable and unjustifiable”.
Politically, however, the Panel reckoned that even these probably undercounted numbers of non-returnees could potentially impact on a General Election result – two West Midlands examples being Sandwell and Walsall, where 1,135 and 797 electors (respectively) were turned away.
There is, obviously, a great deal more, but almost simultaneously other contributions were appearing on the scene, perhaps most noteworthy being the Local Government Information Unit’s The Impact of Voter ID: The Views of Administrators. Based mainly on a survey of 171 electoral administrators who helped deliver the May 2023 elections, some of these ‘behind the scenes’ views are almost inevitably predictable: that VID is just the latest of the pressures added to the burden of electoral administrators already contending with resource constraints, complex legislation, tight timetables, temporary staff recruitment, etc.; and that a General Election offers an “opportunity for serious disruptions” (p.5).
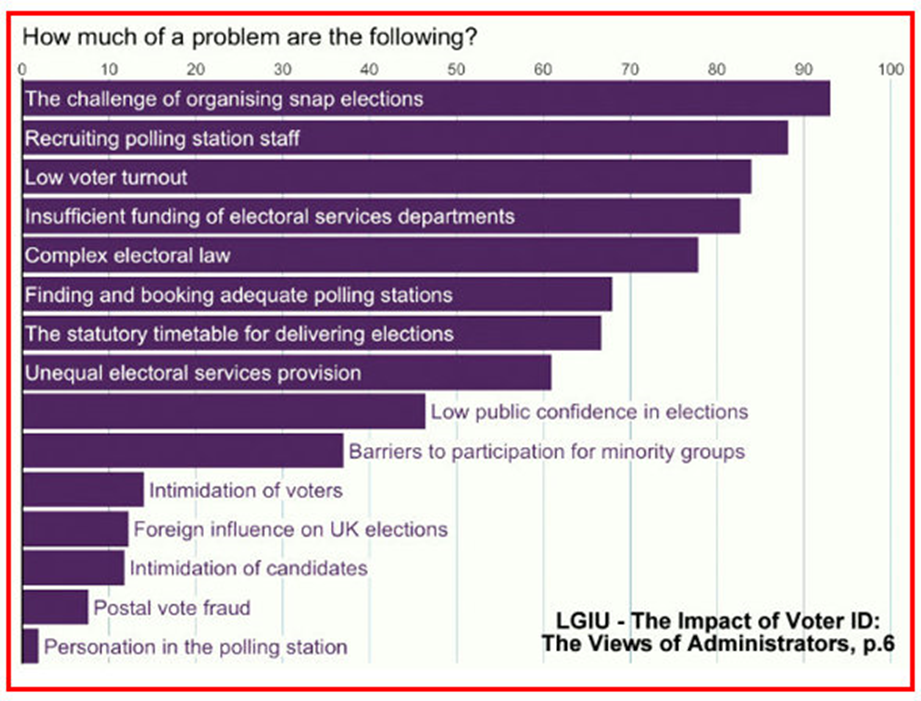
Perhaps most striking, though, appearing on the Introduction page (6), but without a word of direct reference, is the following bar chart. The words follow in the remainder of the report: yes, administratively elections in England have serious weaknesses: staffing pressures caused by “short timetables, convoluted legislation, inefficient processes and inadequate resourcing.” (p.11). Administrators’ question for this research is how voter ID has impacted on these issues, as well as, of course, on “personation in the polling station”.
And my carefully considered conclusion, following this attempted overview of the welter of reports and evaluations that appeared several weeks ago now? I should have done what I’ve habitually done for years in comparable situations: relied on the House of Commons Library, whose estimable staff – here Neil Johnston and Elise Uberoi – produced a characteristically thorough (and, unlike mine, unopinionated) 59-page Research Briefing covering pretty well everything I’ve attempted to. And, to quote Forrest Gump, that’s all I have to say about that!

Chris Game is an INLOGOV Associate, and Visiting Professor at Kwansei Gakuin University, Osaka, Japan. He is joint-author (with Professor David Wilson) of the successive editions of Local Government in the United Kingdom, and a regular columnist for The Birmingham Post.