Cllr Ketan Sheth
I recently chaired a landmark event hosted by The Advocacy Project, where community leaders, local government officers, NHS representatives, and voluntary sector partners converged at Hampstead Old Town Hall to confront a pressing issue: the systemic inequalities faced by people with learning disabilities. This event was more than a conversation – it was a catalyst for change.
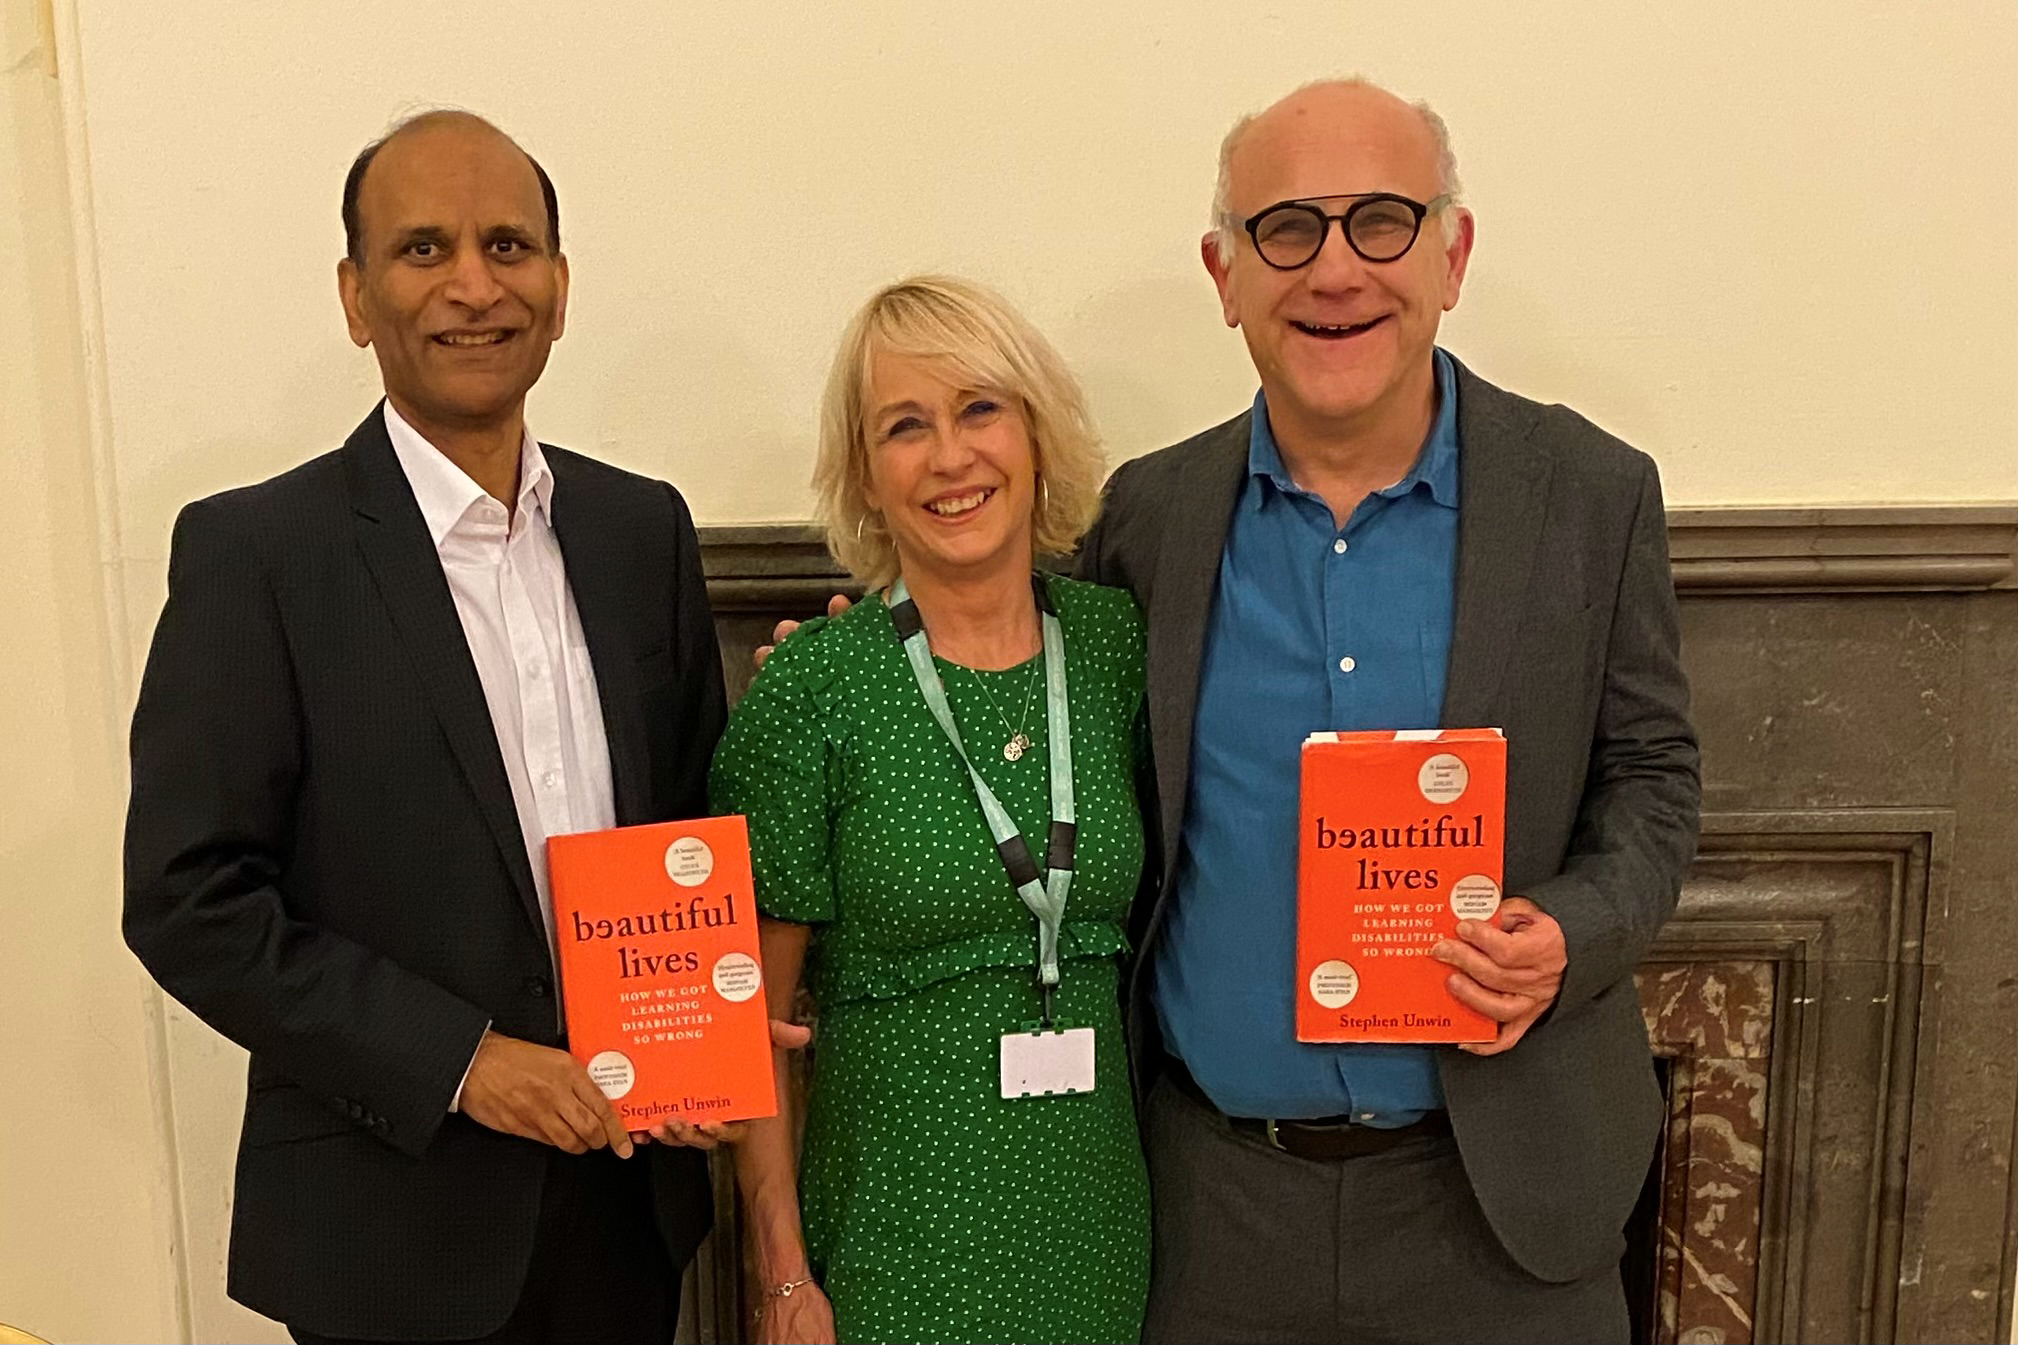
Acclaimed playwright Stephen Unwin shared insights from his poignant book, ‘Beautiful Lives: How We Got Learning Disabilities So Wrong’, inspired by his son Joey’s experiences. Unwin’s words laid bare the dark history of societal attitudes towards people with learning disabilities, exposing the stark reality that despite progress, these individuals remain disproportionately disadvantaged in healthcare, social services, education, and beyond.
The discussion illuminated the critical role local government plays in shaping inclusive policies. By leveraging commissioning powers, local authorities can ensure services are co-designed with people with learning disabilities, prioritising their needs and preferences. This can address the stark health inequalities highlighted in the Learning Disabilities Mortality Review (LeDeR) programme, which revealed concerning disparities in healthcare outcomes.
Katherine Shaw, CEO of The Advocacy Project, underscored the imperative of confronting this history and committing to a future where dignity, equality, and human rights are non-negotiable. The Advocacy Project’s work with local government exemplifies this commitment, amplifying the voices of those with lived experience to inform responsive, respectful, and community-rooted services.
Through user involvement projects and partnerships, The Advocacy Project demonstrates the power of collaboration. For example, their work with local authorities has led to more accessible community services, improved mental health support, and increased participation in local decision-making. These tangible outcomes show that when people with learning disabilities are involved in shaping services, communities become more inclusive.
Local government’s role in education, housing, employment, public health, and adult social care is crucial. By promoting inclusive policies and supporting initiatives like person-centred planning and supported internships, local authorities can break down barriers and foster resilient communities. This can help tackle loneliness, improve mental health, and ensure economic participation for people with learning disabilities.
Moreover, local authorities can learn from The Advocacy Project’s approach to co-production, ensuring that services are designed and delivered with people with learning disabilities, rather than for them. This shift in approach can lead to more effective, person-centred support. By adopting this approach, local authorities can ensure that services are tailored to meet the unique needs of individuals, promoting greater independence and autonomy.
As local government leaders, policymakers, and community advocates, we are tasked with a profound responsibility – to listen, learn, and act. Let us strengthen partnerships, centre lived experience, and forge a more inclusive future for all. The Advocacy Project’s work is a beacon for this change, highlighting the importance of inclusive policies. Indeed, it’s essential to recognise the long-term benefits of such policies, including economic benefits, improved health outcomes, and increased social cohesion. By working together, we can create a more inclusive and equitable society, where people with learning disabilities are valued and supported to reach their full potential, contributing to a richer, more diverse community.
In conclusion, the event reinforced that inclusion is a collective responsibility. Local government’s leadership and partnerships are vital in driving this agenda forward. Let us heed the call to action, champion the rights of people with learning disabilities, and work tirelessly towards a more equitable society.
Councillor Dr Ketan Sheth is Chair of the Community and Wellbeing Scrutiny Committee at Brent Council