Chris Game
In his party conference speech on Monday, Chancellor of the Exchequer George Osborne announced that a Conservative Government would seek, by the end of the 2015-20 Parliament, to have eliminated completely the roughly £120 billion national deficit and be running a budget surplus. It would do so, moreover, without raising taxes or cutting capital spending. The audience and most of the business world applauded, naturally, while Labour spokespersons seemed at least temporarily stunned. The best immediate response they could manage was that the Chancellor’s record for meeting his past deficit-elimination targets was pretty flaky, so why should this one be any different.
In fairness, they had cause to be taken aback. The last time a government managed what is sometimes termed an absolute budget surplus – meaning it generated more revenues, including tax yields, than it spent – was in 2001, and it’s only happened about seven times in the past half-century. Not as rare, then, as a Brit winning Wimbledon or the Tour de France, but more so than England winning the Ashes (10, if you were wondering), and excuse, surely, for another spasm of flag-waving and nationalistic celebration?
Possibly, though probably not for most of those in or reliant upon local government, for whom it’s hard to know which scenario would be more painful: the achievement of a surplus by 2020, or being forced to aim for one and not achieving it.
The problem is that this budget surplus isn’t quite the kind of target that Local Government Association Chair, Sir Merrick Cockell, suggested subsequently at a Localis conference fringe event. He observed that a surplus could be arrived at by one of two ways – either by government planning for the public finances to go into the black following spending reductions, or through growth in the economy increasing revenues.
Technically, of course, Sir Merrick’s right. But, wearing his LGA hat, he must know that a budget surplus by 2020 is not going to be achieved under a Conservative or Conservative-led Government either by some hitherto undreamt of explosion of economic growth, or by two lines on a graph, expenditure and revenue, each moving chummily towards the other and eventually converging. He must know, because he’ll have seen the projections, that in this instance one line, revenue, stays unhelpfully almost horizontal throughout virtually the whole of the relevant period, leaving the expenditure line to do all the converging on its own.
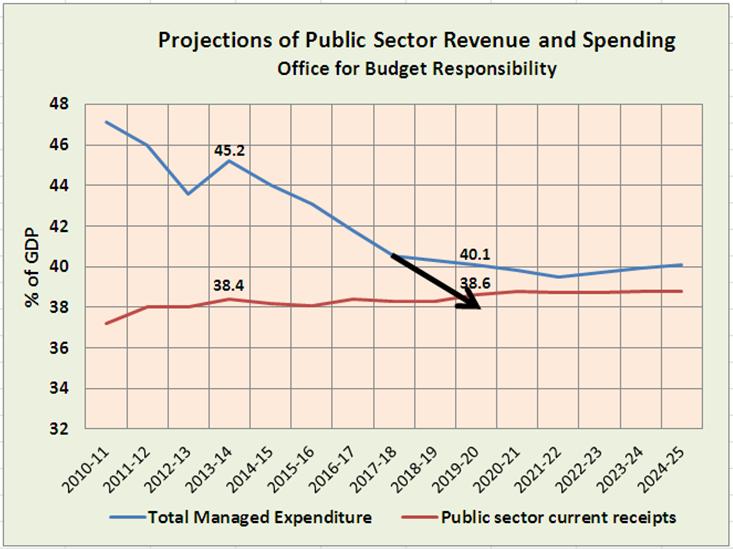
The graph is drawn from projections published this July by the Office for Budget Responsibility (OBR), to which local government followers of LSE’s Professor Tony Travers are regularly commended, most recently in his article in this week’s Public Finance. More specifically, the projections are from the supplementary data published alongside the OBR’s annual Fiscal Sustainability Report, of which this summer’s was the third.
Total Managed Expenditure (TME) covers all spending by central government, local authorities and public enterprises: both the directly controllable Departmental Expenditure Limits (DEL) – the budgets set for departments, Non-Departmental Public Bodies and local authorities in the three-yearly Spending Reviews – and the frustratingly uncontrollable Annually Managed Expenditure (AME) – departmental spending that can’t reasonably be restricted to three-yearly cycles (mainly social security benefits, tax credits and public sector pensions) plus debt interest. Public Sector Current Receipts (PSCRs) are largely taxes and National Insurance Contributions.
There are two potentially deceptive features of the graph as I’ve set it out: the conflated vertical axis, and the 2010-11 starting date. Between them, they have the effect of emphasising the single-year spending blip in 2013-14 and de-emphasising the remarkable nature of the trend.
The historic trend of public spending is, if I correctly recall my Latin, prorsum et sursum, onwards and upwards. Between 1956-57, the year I went to the secondary school in which I learned that Latin, and 2009-10 there was an average growth of 3.2% a year; from 2000-01 an average of 4.7%. We’re now in an 8-year period in which it’s projected to fall by an average of 0.3% a year, in the middle of which a small upward AME lurch is but a proverbial pimple.
Sharp-eyed readers will have detected by now that, rather disappointingly after all that earlier talk of convergence, the two main lines on the graph don’t in fact converge – in 2020 or indeed at any subsequent date. The gap – the public sector net borrowing requirement – has certainly lessened, from 9.9% of GDP in 2010-11 to 6.8% in 2013-14. But the OBR’s current forecast still shows a gap of 1.5% (around £30 billion) in 2019-20, and that, of course, is one measure of the scale of the surplus problem.
The PSCR line, having struggled up to 38% in 2011-12, just stays there, projected by the Office for Budget Responsibility to fluctuate throughout the rest of the decade by barely half a percent, presumably irrespective of the political complexion of the post-2015 Government.
So, even if the Chancellor hadn’t confirmed that the deficit-vanishing trick was going to be accomplished without tax increases, it’s clear that whatever convergence there’s going to be will have to come, as suggested on the graph, from further spending cuts – and at a time when the long-term spending pressure of an ageing population is already growing by the year.
The OBR has a whole mini-vocabulary for deflecting responsibility when particularly its longer term forecasts turn out rather differently. My addition to the graph, therefore, is what they’d call an illustrative, broad-brush projection, rather than a precise forecast. The thing is, I can’t rid my mind of the image of a black arrow, heading straight for local government.

Chris Game is a Visiting Lecturer at INLOGOV interested in the politics of local government; local elections, electoral reform and other electoral behaviour; party politics; political leadership and management; member-officer relations; central-local relations; use of consumer and opinion research in local government; the modernisation agenda and the implementation of executive local government.
