Councils going bankrupt? Don’t be Scilly!

Chris Game


Remember the old London bus joke: you wait for ages, then three come along at once? Well, some local government finance anoraks have been waiting ages for a 114, and now two 24s arrive, almost in mini-convoy.

Not buses, of course – but key sections of Acts of Parliament. Section 114 of the Local Government Finance Act 1988 requires a council’s Chief Finance Officer (CFO) to issue a s114 Notice reporting to all elected members an actual or impending seriously unbalanced budget.

As indicated, they’re infrequent, issued only in what CIPFA terms (p.3) “the gravest of circumstances” – current spending way beyond budget, reserves virtually exhausted, no imminent solution. Their impact too is grave – effectively freezing spending until councillors agree measures to achieve a balanced budget. But … they do keep the crisis in-house.

The alternative – being required to wash your dirty linen in public – is the dreaded Section 24 of the Local Audit and Accountability Act 2014. Here, a council’s external auditors append a written s24 ‘Recommendation’ to their Annual Audit letter, “copied to the Secretary of State”. The recommending and copying may sound chummy, but it’s the bullet-shaped chumminess of a Mafia ‘message job’. S24 Notices are very nasty, and happily very rare – or were.

Recently the Isles of Scilly Council received one, which is interesting in itself, since not everyone’s clear what it actually is: not part of the already enormous Cornwall Council, but a sui generis unitary authority – in a class of its own.

It’s considerably smaller than my own authority, Birmingham City Council (bear with me, it’s not that daft a comparison), with one-480th of its population – though, interestingly, one councillor for every 109 residents, compared to Birmingham’s post-2018 ration of one for every 10,900. And, as a genuine unitary, it has Birmingham’s major functions, including an airport, plus fire services, water supply, sea fisheries and coastal defence.

Unfortunately, Scilly’s unique status doesn’t exempt it from the austerity pressures and grant cuts faced by all English councils. It’s suffering badly, and its external auditors concluded that – with £3 million needed to pay staff and suppliers, no council tax income for the last two months of the financial year, and reserves down to £0.5 million – the law required Section 24, ‘recommending’ in terms (p.37) that the Council get its whole financial act together, extremely pronto.

Its impact, warning notwithstanding, can be surmised from the reaction of the eminent former Labour leader of the previous council to have received a s24 missive, just last November from coincidentally the same auditors, Grant Thornton. “The most concerning audit letter I have seen in all my [36] years on the council” was Cllr Sir Albert Bore’s verdict – the council being Birmingham, and the equivalent budget black hole not £3 million but pushing £38 million.

Just as Aristotle’s single swallow did not a summer make, two s24s don’t themselves make a systemic winter crisis. They’re surely, though, a sign – given that not one such report was issued to any council during the whole four-year 2010 spending review period, and we’ve now had two in two months.

But a sign of what? That’s rhetorical. I’m categorically not a local finance expert, and in this blog’s limited remaining space there are no answers – just three observations.

  1. Why no s114s?

 In the past we’d see them at least occasionally. Now there are rumoured sightings – e.g. in Northamptonshire – yet what have materialised are the two s24s, the proverbial nuclear option. It’s been suggested that the (post-1988 Local Finance Act) statutory duties of Social Services Directors mean a s114-prompted total spending freeze could prevent, say, a vulnerable child being placed in care. But CIPFA Chief Executive Rob Whiteman has rejected this interpretation.

  1. Please, not the B-word

There’s unfortunately no way of avoiding the media headline, but Scilly, Birmingham and probably any financially struggling English councils aren’t about to ‘go bankrupt’ in the sense in which the word is commonly understood. UK councils, unlike US local government or our own national government, are statutorily required to set each year a balanced budget. Running a deficit of the smallest fraction of Detroit’s nearly $400 million in 2013 is simply not possible – indeed, a very s(c)illy idea.

3. But watch for those ‘statutory duties’

So not bankruptcy in the normal legal sense, but almost daily signs and public warnings – Conservative Surrey’s seriously contemplated 15% council tax referendum, tax hikes all round of approaching 5%, hitherto protected adult care budgets now being cut and 13% of responding councils in the MJ/LGIU 2017 State of Local Government Finance Survey –reporting “a danger they would no longer have enough funding to fulfil their statutory duties in the coming year”.

Which would mean facing legal challenge for failing to meet those statutory duties and/or declaring ‘technical insolvency’. Not ‘bankruptcy’, note; but, as the famous duck test puts it: if it looks like, walks like, and quacks like a duck ….


Chris Game - pic

Chris Game is a Visiting Lecturer at INLOGOV interested in the politics of local government; local elections, electoral reform and other electoral behaviour; party politics; political leadership and management; member-officer relations; central-local relations; use of consumer and opinion research in local government; the modernisation agenda and the implementation of executive local government.
Tax Collection Rates: Central and Local

Chris Game

Council tax collection rates have become an annual Commons ritual, pleasingly coinciding with the first week of Wimbledon.  Party whips select a tame Government backbencher – the parliamentary equivalent of a first-round loser – to lob up a couple of juicy written questions for the high-seeded Communities and Local Government Minister to smash away, adding for good measure some unsubtle party spin. This year, though, there were a couple of interesting variations.

First, the questions were tabled not by a neophyte Tory backbencher, but by Helen Jones, four-term Labour MP for Warrington North and Shadow Local Government Minister. Second, she wanted to know about council tax arrears as well as collection rates, for each billing authority, in cash and percentage terms.

To most people, the two things are clearly distinguishable. Uncollected taxes relate to the most recent financial year and, fairly or not, can be seen as an indicator of administrative inefficiency.  Arrears are uncollected taxes over several years that are still being chased as, in principle, collectable. Presentationally, they should be more problematical, for even fruitless chasing sounds more diligent than just giving up and writing them off.

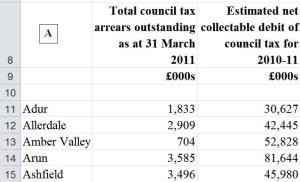
But to ministers this is a distinction without a difference: they can attach their political message equally easily to either set of statistics. Combining Jones’ two questions, Local Government Minister, Bob Neill, placed in the Commons Library a two-column table (Figure A), showing for each alphabetically listed billing authority their accumulated council tax arrears at 31 March 2011, and the total tax they were attempting to collect in 2010-11.


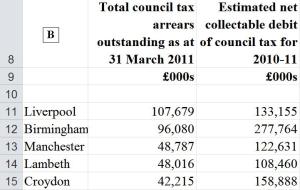
More helpful would have been the 2011-12 figures, which were in fact available to us all a couple of days later. Still, not to worry; other assistance was on the way. Ministers were naturally concerned that the full partisan significance of these figures might be lost, if MPs, let alone journalists, were forced to sift through all 326 of these authorities. So a Spad (ministerial special adviser) circulated the media with a list re-ranking them in order of their total tax arrears at the end of 2010-11 (Figure B).

Guessing the sections of the media likely to run their story, the Spad also added some useful quotes. The revised list was “a league table of the worst offenders”, in which “9 out of 10 of the worst authorities are Labour run”. There were some interpretative comments too from his ministerial master, Eric Pickles:

“This roll call of shame is familiar reading, with Labour councils year in, year out, topping the table of local authorities who squander millions by failing to collect our council tax. If these Labour authorities stopped complaining about the legacy of cuts left by their own party and actually chased up these tax dodgers, they could use the money to protect hundreds of frontline jobs.”

Yes, the DCLG ministerial world is apparently that simple.  All uncollected council tax is attributable to tax dodging and the compliance of lazy, inefficient and moaning Labour councils.  Oh dear – just where do you start?

First, perhaps, with the most obvious.  Yes, Labour Liverpool did top the 2010-11 arrears table, but two of the top five places were occupied by Birmingham, run until May by a Conservative-Lib Dem coalition, and Conservative Croydon. Even the Daily Mail worked out that 9 of the top 10 couldn’t therefore be Labour – albeit in a story whose snappy title left little doubt as to its content: “£2 billion of council tax left uncollected by town halls who then moan about cuts by Whitehall”.

If this arrears listing were indeed a ‘roll call of shame’, Croydon’s prominence would be embarrassing over and above its political control.  As would be expected – by anyone sensing that uncollected tax may not be entirely due to ‘Won’t Pay’, rather than ‘Can’t Pay’ – there is a consistent overall correlation between councils’ annual tax collection rates and their position on the DCLG’s own Indices of Deprivation.

Manchester and Liverpool, for example, are ranked 3rd and 4th on the national Index of Multiple Deprivation, behind Hackney and Tower Hamlets. Birmingham and Lambeth are 13th and 14th. Croydon, by contrast, is no higher than the 20th most deprived borough in London.

As we’ve seen, though, the listing provided to Helen Jones and the Commons Library ranks councils by their accumulated council tax arrears – and in cash terms, moreover, not as a percentage or efficiency measure of anything at all. Big cities, London and metropolitan boroughs are almost bound to head such rankings. If any of the “worst offenders”, Croydon included, wanted to drop down the list and, presumably, earn ministerial brownie points, they could simply change their corporate write-off policy, stop chasing these really hard-to-recover debts, and write them off. Would that genuine efficiency gains were that easy!

To make their party propaganda properly, ministers should have had their Spads rank order not councils’ arrears, but their tax collection rates – their actual tax receipts for the financial year as a proportion of the total due. We now have these figures for 2011-12, and they make interesting reading (Table 7 of hyperlink).

English local authorities collected £22.1 billion in council tax and £20.8 billion in non-domestic rates (NDR), or 97.3% and 97.8% respectively of the totals due to them. Shire districts’ council tax percentages were slightly above the overall average (98.2%) and those of London and metropolitan boroughs (96.3 and 96.1%) and unitaries (97.2%) slightly under.

Highest collection rates in Inner London were in Conservative Wandsworth (98%) and Labour Camden (96.7%), the lowest in Labour Hackney (93.7%) and Lewisham (93.9%). In Outer London, the spread was rather greater, largely due to Newham’s 89.6% – which was 4.5% lower than any other OL borough and, most oddly, 10% lower than its 99.6% NDR collection rate, the highest in London. Supposedly inefficient Croydon was precisely on the Outer London average (96.6%).

Among metropolitan districts, the only three to top a 98% collection rate were an assorted West Midlands trio – Conservative Solihull and Dudley, and Labour Sandwell – followed by Conservative Trafford and Labour Rotherham.  Lowest were Salford (91.3%) and Manchester (92.3%).

Even from this small selection of extremes, it is clear that politically the picture is more complicated than Eric Pickles would have us believe. It is also clear – and, surely, hardly surprising – that Conservative councils overall do have at least slightly higher collection rates than Labour. There may be good explanations for the variations, from year to year and across apparently similar types of authority, but the questions do need asking, which is why these statistics, properly understood and deployed, are so important. After all, if Newham raised its collection rate to that of the hardly more affluent Tower Hamlets, it would bring in an additional £4 million; if Birmingham matched Sandwell, it would collect an extra £10 million.

Of course, other questions too suggest themselves: how, for example, does local government’s £600 million council tax collection gap look when compared with those for HMRC-administered taxes? To which the answer is: not too shabby.

HMRC helpfully produces an annual report on this very subject – Measuring Tax Gaps – and the latest estimates, for 2009-10, include: direct taxes (income tax, NI contributions, capital gains tax) – £14.5 billion or 5.8%; VAT – £11.4 billion or 13.8%; corporation tax – £4.8 billion or 11.7%; beer, spirits, cigarette, tobacco duty – £2.4 billion or roughly 10%. And the total gap: just the cool £35 billion or 7.9% (Table 1.1 of hyperlink). It kind of puts local government’s 2.7% into a slightly different perspective, doesn’t it, Minister?

Chris is a Visiting Lecturer at INLOGOV interested in the politics of local government; local elections, electoral reform and other electoral behaviour; party politics; political  leadership and management; member-officer relations; central-local relations; use of consumer and opinion research in local government; the modernisation agenda and the implementation of executive local government.