Chris Game
It used to be a toss-up which would come first: the political parties launching their local election campaigns or the letter in The Times claiming its author has heard the first cuckoo of Spring. Sadly, with the cuckoo’s drastically declining population both here and worldwide, it’s the politicians that usually win these days, but perhaps it’s some kind of compensation that they can generally be relied upon to produce some distinctly cuckoo-like behaviour – as in daftness, rather than parasitism.
David Cameron chose Nuneaton in Warwickshire for his launch of the Conservatives’ campaign, which electorally certainly made sense. With the most non-Conservative areas in several traditional counties having become unitaries, Warwickshire is one of the few genuinely marginal counties around, with the Conservatives maybe having the edge in votes, but Labour having run the county council for longer in recent years as a minority administration. Come to the West Midlands in April, though, and you have to confront the Aston Villa relegation issue. Cameron was “sure it’ll be alright in the end”, which in the circumstances, and especially as he was careful not to define “end”, was also not daft. Some of his other views, though, did seem to suggest that he might have just migrated in from Africa.
The Government’s Localism Act had empowered local government, he asserted, so local elections now mattered more than in the past … “We’ve given councils much, much more freedom …”. It was the double emphasis that took the biscuit. It must be really, really difficult for most councils, having seen their grant funding slashed year by year, and having just implemented their fourth round of spending cuts to meet budget and tax ceilings effectively dictated by the Government, to identify quite where all this freedom and electoral meaningfulness are hiding.
However, it’s not the function of an INLOGOV blog to engage in partisan knockabout – no, really, it’s not. This one’s serious purpose is to try to inject a bit of factual clarification into what looks like becoming a pretty heated debate about council tax – a little ironically, talking of electoral meaningfulness, when very few of the councils holding elections are actually billing authorities.
In neighbouring Worcestershire, for instance, should electors in Bromsgrove and Malvern Hills vote as if to punish their tax-collecting Conservative councils for rejecting Cameron and Pickles’ “clear moral imperative” to freeze their council taxes for the sake of “hard-working families and pensioners”? That presumably would be a demonstration that local elections mattered. Or should they reward Conservative Worcestershire for taking the Government’s one-off grant (equivalent to a one per cent rise in council tax) and freezing the much bigger portion of their tax bill?
It’s a definite complication for the Conservatives, who would have liked to be able to contrast phalanxes of blue councils, which had obediently taken the grant and frozen their tax bills for a further year, with loads of red and orange/yellow ones that had ignored their “moral imperative” and increased theirs. There was no lack of ministerial arm-twisting (proverbial, I presume) and other threats and pressures to which Conservative council leaders were subjected, but at the end of the day, as the Sunday Telegraph was one of the first to document, the figures just didn’t turn out right.
In a mid-March survey of all 353 English councils, the Telegraph found first that a total of 124, or more than a third, were increasing their council tax bills as a way of raising revenue. Secondly, more than half of these offending councils (64) were Conservative – that’s more than one in three of those the party currently controls. Some, moreover – as can be confirmed in a more recent House of Commons briefing paper (Appendix 7) – were seriously big and embarrassing names.
The three tax-raising counties were almost bound to be Conservative, and indeed are – Cambridgeshire, Surrey, and a particularly interesting A N Other. The six London boroughs were more mixed. There were 2 of Labour’s 18 – Lewisham and Harrow; 1 of the Lib Dems’ 2 – Kingston-upon-Thames; and 3 of the Conservatives’ 11 – Bromley, Croydon, and, with the biggest increase of all at over 3%, Wandsworth. As for A N Other, the Sunday Telegraph seemed almost salivatingly pleased to note that the Tory miscreants “included Oxfordshire County Council, which is David Cameron’s local authority, and Runnymede Council in the constituency of Philip Hammond, the Defence Secretary.”
None of this, of course, is going to stop the Conservatives exhorting us in virtually every campaign speech to vote Conservative for lower council taxes. But listen carefully to what they actually say, like Cameron himself on Friday: “On average, on a Band D bill, Conservative councils continue to charge lower levels of council taxes than Labour or Lib Dems.” And it’s perfectly true. It generally is. And, unless you stop and think about it for a few moments longer than most voters are probably likely to give it, it’s seriously misleading.
As, in a very similar way, is Labour’s counter-claim that we should vote for them, because, to quote Hilary Benn, Shadow Secretary for Communities and Local Government, from last year’s election campaign and no doubt from this year’s as well: “Households in Labour-controlled authorities pay on average less council tax per year than those in Tory and Lib Dem areas”.
Note the small, but hugely significant, difference: Conservatives: average Band D; Labour: average per household/dwelling. If I were preparing students for an exam, I might suggest they use a mnemonic – say, Bullingdon and Downing Street for Band D – but I’d also try to get them to think it through, because it’s really not brain-hurting stuff.
The tax base for council tax is a ratio system based on 8 valuation bands, centred around Band D (properties valued, in 1991, at ₤68,000 to ₤88,000). Band A properties (under ₤40,000) pay 6/9 (2/3) of Band D; Band B 7/9, and so on up to Band H (over ₤320,000) paying 18/9 (2x) of Band D. Councils calculate their tax base by weighting the number of dwellings in each band to Band D, and report their budget headlines in terms of ‘Council tax for council services (Band D)’.
Band D has thus become a benchmark for comparative purposes, and it is perfectly reasonable for the Conservatives to use it – reasonable but disingenuous. Not so much because only a small minority of properties (15% in England) are actually in Band D, but because, exacerbated by the absence of any revaluation since 1991, the mix of property bands across authorities and regions nowadays varies starkly. In my own authority of Birmingham 66% of properties are in Bands A and B, and just 8% in E to H combined. Neighbouring Solihull has 29% in Bands A and B, and also 29% in E to H. In the North East there are 55% Band As, in the South East 9%, in London 3.6%.
All of which obviously means that, to raise any particular sum of money in an authority with mainly Band A to C properties requires a higher Band D tax than in one comprising many E to H properties. The average bills paid per household will vary similarly – being generally higher than the Band D figure in more affluent and Conservative-inclined areas, and lower in less affluent or Labour-inclined ones. Hence Labour’s equally disingenuous preference for average tax bill figures. Two contrasting Inner London boroughs provide an illustration. Kensington and Chelsea: Band D – £1,086; average tax per dwelling – £1,190; Tower Hamlets: Band D – £1,189; average tax per dwelling – £787.
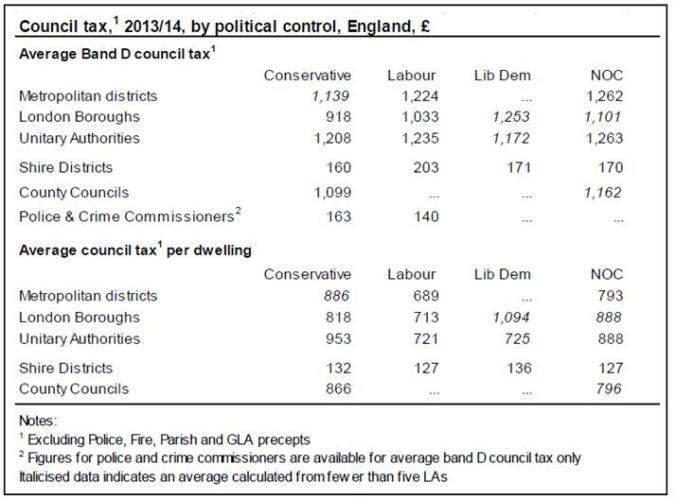
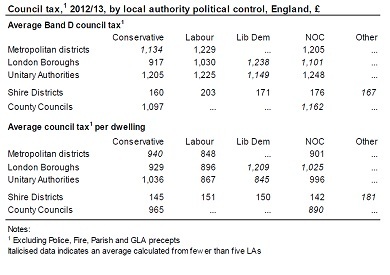
The parties have been playing this rather irritating game seemingly forever, and at one time it fell to party researchers or friendly academics to have to ascertain councils’ political control, decide whether it had been long enough to influence budgetary and tax policy, and produce the necessary statistics. In recent years, possibly irritated at hearing the same arguments repeated year after year, the estimable House of Commons Library staff (and notably Matthew Keep) have taken over, and a table on page 9 of the research briefing referred to above and reproduced here enable us, and, if they choose, MPs to compare the figures for ourselves.
They show that, in all comparisons in which more than 5 authorities are involved, the average band D council tax is lower in Conservative-controlled authorities than in those controlled by Labour, the single exception being Police and Crime Commissioners, where the lower levels were set by Labour. But in all cases the average council tax per dwelling is lower in Labour-controlled authorities. It’s difficult to say just what, if anything, this proves, but it surely means that we need hear no more of these particular claims. In your dreams!
Chris is a Visiting Lecturer at INLOGOV interested in the politics of local government; local elections, electoral reform and other electoral behaviour; party politics; political leadership and management; member-officer relations; central-local relations; use of consumer and opinion research in local government; the modernisation agenda and the implementation of executive local government.


