Over the next two weeks, the INLOGOV blog will be featuring a range of posts related to the local elections. Check the blog regularly for all the expert commentary, and follow us on Twitter to stay up to date.
Chris Game
There’s a view – shared by, among others, the Electoral Commission, the members of the 2007 Councillors Commission, and me – that voters’ lives would be easier and their turnout at least a smidgeon higher, if the 4-year cycle of local elections were uniform across the whole of England, and based on all-out or ‘whole council’ elections for all councils being held on the same ‘Local Elections Day’ (LED).
There could be one LED either every four years, or, if it were felt preferable, every other year: with LED1 being for voters to elect members of their ‘most immediate’ councils – districts, unitaries, London and metropolitan boroughs – and LED2 for those in two-tier areas to elect their county councils and the London Assembly. Neither LED would coincide and be forced to share the stage with a General or European Parliament election.
There would be several benefits. The election campaign, both by the political parties and in the media, would have to give greater attention than at present to local government issues and the performance of local councils and councillors, which should in turn raise the public’s awareness and understanding, and in some their inclination to vote.
Just as importantly, all voters in the same type of local authority would have the same number of opportunities to elect their councillors, and, even if they chose not to use those votes, they’d at least know each year whether they had a vote not to use. At present, voters in a district that elects its council by thirds, with elections in three years out of four, can have three times the number of voting opportunities as those in a neighbouring district with all-out elections. There seems, to me at least, something seriously unbalanced about a system of local democracy in which ministers think uniform frequency should apply to bin collection but not to voting opportunity.
End of protest (well, nearly), and time to look at what will be happening where on Thursday 2nd May. For this is the first in a short series of blogs by INLOGOV colleagues over the next fortnight or so on different aspects of this year’s local elections, and so will endeavour to set the scene. Which, in truth, really shouldn’t take that long, because there can rarely have been a local election year involving fewer local authorities.
Indeed, it takes almost as long to explain why this is, but, since it illustrates my case about the system’s pointless complexity, I’m afraid I’m going to – though I’ll let you off with England only. It has to do with the (usually) 4-year election cycles referred to above, in which 2009, 2013 and 2017 can be seen as the 4th years. In Year 1 – 2010, 2014 – we have elections for the met boroughs, who have to elect their councils by thirds; for the roughly one-third of unitary and shire district councils who have chosen to; for the London boroughs, who are required to have all-out elections; plus a few elected mayors. About 160 authorities involved in total.
Year 2 – 2011, 2015 – is the big year, when the national media have a better excuse than usual for pretending that local government is staging a mini-General Election for their benefit. We have the mets, all districts (even those choosing all-out elections can’t choose the year), most but not all unitaries (don’t ask – I told you it was designed to baffle), and a few more mayors. About 280 authorities in all. Year 3 should be a near-repeat of Year 1, with Londoners electing the Mayor and Assembly, instead of borough councils, plus, from 2016 and assuming they still exist, Police and Crime Commissioners.
And so we come to this year, Year 4, in which we have just the 27 remaining county councils, a few all-out unitaries, a couple of mayors, and a stray from Wales. And that’s it – not just in England, but in the whole UK. Which sounds as if it might represent something of a let-off for any party struggling in the opinion polls – but in this case it almost certainly doesn’t.
Although I do have, I promise you, several more artistic offerings on my office walls, on the door there hangs – courtesy of the Local Government Chronicle and the incomparable local elections experts, Professors Rallings and Thrasher – a poster mapping the political control of all GB councils. An inset map on the poster focuses solely on the county councils, and it seemed a good place to start.
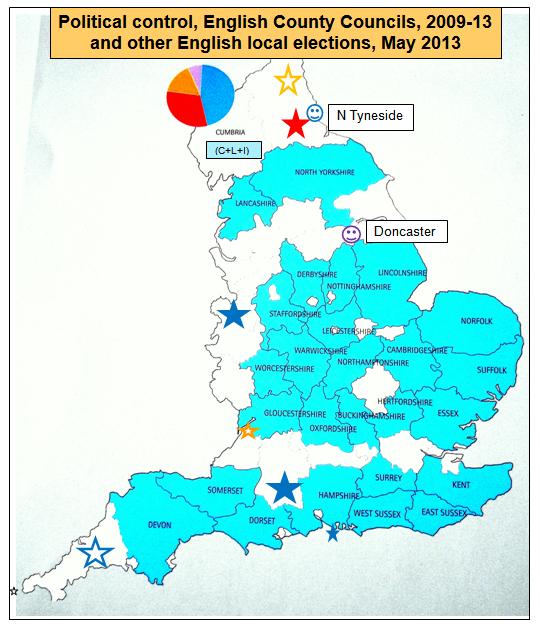
Ignoring the added symbols for the moment, this potentially multi-coloured map comprised, when it was produced at the start of the current political year, just the one colour – blue for Conservative majority control – and some white spaces. The latter, moreover, actually dilute the true extent of one-party domination among these big, upper-tier councils which, it should be remembered, are responsible for roughly 90% of local government revenue spending in their respective areas, compared to the 10% contributed by the 201 lower-tier districts. For, with one exception, the apparently blank spaces are not non-Conservative controlled counties, but single-tier metropolitan and unitary authorities. That exception, the one county where in May 2009 the Conservatives didn’t take majority control, is Cumbria, where they are comfortably the largest party but lead an interesting power-sharing administration of Conservatives, Labour and an Independent, with the Lib Dems in official opposition.
There is in fact now a second exception in Derbyshire. Labour-dominated since 1981, it was numerically the Conservatives’ narrowest capture in 2009, with 33 of the council’s 64 seats. In the past few months, though, they have lost that overall majority, with one councillor having to resign for unsavoury personal reasons and another switching allegiance to the UK Independence Party (UKIP). Not the best position from which to enter what was always bound to be an uphill battle to retain control.
Those 2009 elections took place when Labour’s standing nationally was about as low as it could get. The Government was in disarray, there were leadership plots against Gordon Brown, some ministers were in trouble over their expenses, others were resigning like proverbial rats from an apparently sinking ship – and that was in the week before the elections. In the pre-election opinion polls the Conservatives were 16 points ahead: 39% to Labour’s 23% and the Lib Dems’ 19%. As they generally do, the election results reflected the polls, and the Conservatives, already the dominant party in this tier of local government, gained blanket control by taking Derbyshire, Lancashire, Nottinghamshire and Staffordshire from Labour, Warwickshire from Labour minority control, and Devon and Somerset from the Lib Dems.
Today, the voting intention opinion polls are not quite as bad for the Conservatives as they were in 2009 for Labour, but they’re hardly encouraging. They show the Conservatives trailing Labour by about 11 points, with 30% to 41%, while their Lib Dem coalition partners are battling it out with UKIP on around 12%. I’ll be looking in more detail in a later blog at what these national standings and other considerations signal for actual changes in control among the counties, but I want to conclude this preview by mentioning the other elections that are taking place.
The added stars on the map identify the 8 unitary authorities holding elections. Five are from the most recent generation of unitaries and were until 2009 upper-tier county councils in the two-tier part of the structure. Their extraordinary scale – for what is the supposedly ‘local’ government in their areas – earns them the biggest stars on the map. Two – Shropshire and Wiltshire – are currently solidly blue for majority Conservative control, and Durham is equally solidly Labour. Labour also controlled neighbouring Northumberland for its last ten years as a county council, and must hope at least to regain its position as largest party and end the present minority Lib Dem administration. Cornwall’s last years as a county council were spent under majority Lib Dem control, but the Conservatives now lead a coalition administration with the Independents and may have their sights set on the overall majority that they’ve never so far achieved.
The Isle of Wight was also a county council until 1995 and also in its final years controlled by the Lib Dems. The party today, though, is reduced to just four councillors, and it is the Conservatives who have a majority. Bristol, even by UK standards, is an electoral oddity. The Council voted recently – to the relief of pretty well all concerned – to switch from election by thirds to all-out elections, coinciding with the election of the city’s mayor. But not, sadly, until 2016, which means that, for barely comprehensible reasons, it is the single authority this year to be electing only a third of its council. This necessarily restricts the scope for change, but there could still be sufficient for the Lib Dems to lose their minority control and for Labour to regain its position as largest single party.
All of which leaves just the odds and sods. The smiley faces on the map are the two elected mayors hoping for re-election, and there will be more about them in the next blog. The Welsh elections are for a new Isle of Anglesey council – postponed from last year, following a period in which the former council had to be replaced by appointed commissioners and a programme of recovery and democratic renewal undertaken.
And the barely visible little star off the coast of Cornwall is, of course, the Isles of Scilly. The 21-member, entirely Independent, council can legitimately claim to provide a range of services not just equivalent to but, as a surviving water and sewage authority, greater than that of any mainland unitary authority. They’re not, strictly speaking, a unitary, but they’re counted as one by the Office for National Statistics, and on St Mary’s at least, if not perhaps on all the ‘Off Islands’, they too will be voting on 2nd May.

Chris is a Visiting Lecturer at INLOGOV interested in the politics of local government; local elections, electoral reform and other electoral behaviour; party politics; political leadership and management; member-officer relations; central-local relations; use of consumer and opinion research in local government; the modernisation agenda and the implementation of executive local government.
