First, do no harm – An assessment of the Housing and Planning White Paper

Anthony Mason gives an initial assessment of the white paper on housing and planning in England

First impressions are not always very reliable.  When Sajid Javid replaced Greg Clark as Secretary of State for Communities and Local Government following the post-vote governmental putsch last year (sorry, change of Prime Minister following the referendum), local government figures were very wary.  Clark had, and still has, a reputation for understanding local government and can connect the local to the national in discussions around the cabinet table in a way that few of his colleagues are able to. Javid, however, was an unknown quantity – said to feel that the DCLG role was a demotion and giving every indication that he was unexcited by the move.

Yet, for those of us specifically interested in housing policy, Clark – alongside his spiky and confrontational housing minister, Brandon Lewis, presided over some rotten housing policies, as I suggested in this place last year.  Indeed, the Housing and Planning Act 2016 will, I suspect, go down in legislative history as the Dangerous Dogs Act of housing policy in England.  Gratifyingly, a number of the craziest measures enabled by that Act have proved so difficult to implement that the “new” government has simply shunted them into a siding and (we hope) left them there to rot.

And now comes the first comprehensive white paper on housing policy in England for almost a generation. Bearing the less than poetic title-as-ambition of Fixing our broken housing market.  Javid and his refreshingly rounded housing minister Gavin Barwell, set out in 104 pages and many supporting papers their ambitions to do just that.  To their great credit, Javid and Barwell have spent many weeks on careful consultation with local government, sector interests, and Number 10 before getting this far; delaying the publication of the white paper somewhat while doing so.  They have even persuaded the PM to pen a lengthy introduction to the paper – presumably in the hope of corralling rural Conservative NIMBYs into line.

The white paper sets out many proposals and poses 38 carefully framed policy questions for response (by 2nd May 2017, if you’d like to contribute).  But in quick summary, it:

  • Acknowledges that England needs around 250,000 new homes each year going forward. This was expressed as “between 225,000 and 275,000 homes” – and is up from the oft-quoted 200,000 previously accepted (but never consistently realised)
  • Proposes that each local authority will have to draw up and regularly review an “honest assessment” of local housing need – methodology to follow.
  • Says that developers could be forced to build within two years of planning consent, or see that consent lapse. At the moment, permission usually lapses after three years.  The paper also proposes new compulsory purchase powers for councils where sites lie undeveloped – details to follow.
  • Suggests an expanded and more flexible affordable homes programme, for housing associations and local authorities, with £7.1bn of (already announced) funding. It drops the “old” government’s fixation with starter homes in favour of a more balanced approach.
  • Encourages building rates at higher density – including of higher buildings – to make best use of land (and to avoid having to give a view on releasing green belt).
  • Dodges the question of future housing association and council rent levels after George Osborne’s compulsory rent reductions “We will provide clarity over future rent levels. In return, we expect them to build significantly more affordable homes over the current parliament.” Is what ministers promise.
  • Says that smaller building firms will be given assistance to expand, including support for off-site construction (where components are fabricated off-site and factory-assembled). It also encourages “build to let” where private companies build large-volume rental flats for tenants.
  • Continues a focus on leaseholds, proposing what it calls “an end to leasehold abuse” where home buyers are locked into leases with spiralling ground rents.

Most of us acknowledge the general need for new homes while protesting loudly if those homes are to be built near to us – and for years, housing policy in England has tried not to upset voters and yet deliver new homes.  And the white paper has had to throw titbits in all directions to keep sector interests at bay.  Local authorities are both excoriated for planning failures and mildly encouraged to build new homes.  Those who worship at the altar of home ownership will be pleased that there is a threat to close a loophole that has allowed councils building homes through wholly-owned companies to avoid the right to buy.  Those who see renting as the most realistic way forward will be pleased that much of the white paper acknowledges this reality and makes gentle proposals for longer tenancies.  Big developers are both criticised for not building out sites as well as encouraged by some anti-planner language.

But ministers have failed to resolve some longstanding conundrums – and a couple of new ones – in their paper:

  • Successive governments have tried to combine bottom-up and top-down policies on housing which appear to conflict in their efforts to encourage and coerce. For example, communities and parishes have been given more control over developments and yet principal councils are still required to provide new homes.  Housing associations should develop more and yet have no control over the rents they can charge for these new homes.
  • Government has long had an intellectual tendency to support developers over planners – even though planning consents have been running ahead of homes built for some time. This white paper at last begins to recognise that not all is well, with our developers while avoiding the obvious response: councils’ potential contribution to building at scale.
  • There is a cherished belief that brownfield sites can provide the majority of our new homes, but these sites no longer match need. Not surprisingly, they are disproportionately in cities, but not all housing need is city-based.  The white paper avoids the question of building on the green belt, even though, in our own city, we’ve faced a highly charged debate about this topic.
  • A further concern is around labour and skills. We’ve long worried that not enough UK youngsters express any desire to work in the building industry.  This is now compounded by fears of the actual or apparent impact of Brexit on the non-UK workforce.

The fundamental question that the paper avoids is whether any combination of our present arrangements for building can ever deliver the amount of housing we need; as the answer to that question may be too hot to handle.  It’s old evidence now, but the Calcutt review of the housebuilding industry commissioned a decade ago set out a straightforward graphic showing who has built what in the UK in the years since the Second World War (see figure one on page 10).

untitled
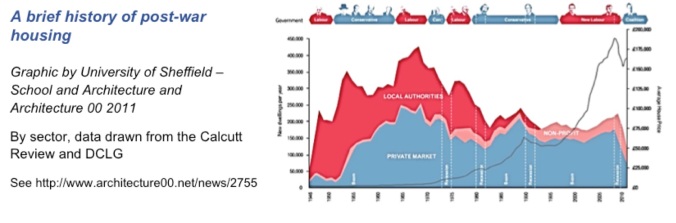
This evidence was summarised in a beautifully simple graphic (above) by the University of Sheffield School of Architecture.  It evidences that the three decade long gap in our housing provision is simply because we’ve stopped building council houses.  The answer to the fundamental question would seem to be to let councils (and housing associations) build again at some scale in order to supplement the relatively fixed-but-declining contribution of private developers.

The title to this post is a common misquotation of the Hippocratic Oath.  It suggests that a first duty for medics is not to do harm “Primum non nocere” – and the new white paper seems to pass that test, at least.  If a second duty is “then to do good” – then I’m not yet convinced that the paper will achieve that in any significant way.

Anthony Mason


Anthony Mason is an Associate at INLOGOV and works mostly on local government systems and organisation and on improving public sector partnerships.  His early career was in local government followed by more than 20 years in PwC’s public sector consultancy team.


Lords a leaping….to the rescue?

Anthony Mason

A series of significant defeats by the House of Lords to the Housing and Planning Bill may give some comfort to households at the very bottom of the housing ladder

Catherine Staite doesn’t hold back in her criticism of the centralising tendencies of UK governments – of all political hues.  And, as might be expected from a pragmatic academic, she excoriates government for making policy with no apparent reference to evidence.  Her most recent blog on these linked subjects (one of many) also brings local government into the line of fire.

Continue reading

Pickles’ Shock-horror News: Biggest Councils Have Biggest Tax Arrears

Chris Game

Communities and Local Government Secretary Eric Pickles is famed for his sensitive news antennae. I wonder therefore just what – in a week dominated by revelations of his party’s and government’s moral flakiness on the whole tax collection business – persuaded those antennae that it would be a good time to attack local authorities’ tax collecting record.

Actually, I don’t wonder.  I assume that, as with the many other Pickles’ Passions – from council newspapers and biscuits at meetings (bad) to street parties and weekly bin collections (good) – he just can’t stop himself.

Councils’ uncollected taxes and hoarded revenue reserves have become Pickles’ winter perennials – a reassuring sign of approaching spring – and three league tables of the supposedly guiltiest councils were duly posted by the DCLG last Tuesday.

As a Birmingham City Council taxpayer, I was naturally interested to note that Birmingham featured prominently on two of these naughty lists – first of the 10 councils with highest council tax arrears, and fourth of those with highest non-ringfenced reserves – and, to be honest, slightly surprised that it didn’t register at all on the third. Doubtless to the minister’s disappointment, DCLG hadn’t found a single “surplus fixed asset, not directly occupied, used or consumed in the delivery of services”.

There’s no attempt to percentagise these lists, or acknowledge that there might just possibly be some relationship with, say, the size or relative deprivation of councils’ populations.  So Pickles’ shock-horror story amounts to large councils having bigger tax arrears, reserves, etc. than small councils.

It’s hardly headline stuff, but Local Government minister, Kris Hopkins, was determined we should share his boss’s outrage. During that same day’s Commons debate on the recent local government finance settlement, my and the University’s Birmingham, Edgbaston MP, Gisela Stuart, had questioned the fairness and sustainability of Birmingham’s share of that settlement. In customary Commons style, the minister, rather than answer that tricky question, preferred to tell the House about the council’s tax arrears:

“I am afraid that poor leadership in Birmingham and the fact it has not collected some £100 million in council tax arrears may explain some of the issues it is facing. Stronger leadership and the ability to carry out the simple function of placing a charge on an individual and collecting it will assist it” (col.671).

In the heat of the moment, Hopkins omitted to explain that this arrears figure was a cumulative one covering the whole 21-year life of the council tax, or that it includes costs incurred in collecting unpaid taxes. Nor, even more unfortunately, was there time for Gisela Stuart or anyone else to observe that the biggest councils have not only the largest cumulative tax arrears, but also, equally unsurprisingly, the largest tax receipts.

For, by Hopkins’ reasoning, Birmingham’s having collected £63 million more last year in council tax and non-domestic rates than any other English authority outside London presumably reflects rather positively on the quality of its political leadership (Table 5).

Returning from Planet Hopkins to the real world, the key statistics – and they are key – are those for tax collection rates: not pounds collected but percentages collected of the total sum due.

The 2013-14 council tax collection rate for all English authorities was 97%, ranging from shire districts’ 97.9% to 95.4% for Inner London boroughs and Birmingham’s most obvious comparators, the 36 metropolitan districts. Birmingham’s 95.3%, therefore, was fractionally below the met district average, but, as it happens, second highest among the 10 large authorities in the DCLG’s naughty list – behind only Croydon (96.2%) and way ahead of the coalition’s current favourite Labour council, Manchester (91.7%).

Certainly not the disgrace, then, that its heading of the naughty list suggested, but yes: both improvable and costly. If ever decimal places matter, it’s here. Though respectable nationally, Birmingham’s 95.4% collection rate was lowest of the seven West Midlands metropolitan districts – behind Solihull (98.6%) and, in a perhaps less expected second place, Sandwell (98%), ranked 9th most multiply deprived of England’s 326 local authorities against Birmingham’s 13th.  With each percentage point worth nearly £3 million, if Birmingham had achieved even Sandwell’s rate, it would have collected an additional £8 million – and a similar sum each year.

The DCLG’s non-ringfenced reserves naughty list is even more contestable. There is no set or professionally agreed formula for an ‘appropriate’ level of reserves, or for the balance between earmarked/ringfenced and unallocated reserves. But when CIPFA (Chartered Institute of Public Finance and Accountancy) asserts that councils increasing their cash reserves “is essential for protecting frontline services” and finance officers advise that, with council funding over the next few years being exceptionally uncertain, it’s only prudent to set aside reserves in anticipation, it’s hard for councillors – and should be for Pickles – to argue otherwise.

Birmingham’s prominence on this particular list – again, a consequence of its sheer size – is just perverse, given repeated warnings by the council’s external auditors about the councils’ reserves being, if anything, too low. In fact, last month’s Annual Audit letter noted specifically a concern regarding the “relatively low levels of general fund reserves (£85.8 million compared to a revenue budget of £3.5 billion)” (p.7).

Returning to tax collection, if there are numbers of individual councils that find it difficult to, as the minister put it, “carry out the simple function of placing a charge on an individual and collecting it”, what should we make of Her Majesty’s less than exhaustively tenacious Revenue and Customs (HMRC)?

One of HMRC’s helpful ancillary services – or hostages to fortune – is its annual report detailing all the taxes it doesn’t collect: in 2012-13 just the £34 billion – or 6.8% of the total it should have managed.  In other words, all but the very worst council tax collection rates exceed the average managed by the people whose sole job is tax collection.

If we take that most “simple function” of individual taxation, English local authorities failed to collect £734 million (3%) in council tax, while HMRC failed to collect £14.2 billion (5.3%) in income tax, NI contributions and capital gains tax. From businesses, councils failed to collect £478 million (2.1%) in non-domestic rates, while HMRC failed to collect £12.4 billion (10.9%) in VAT, and £3.9 billion (8.7%) in corporation tax.

As Matthew, the Galilean tax collector-turned-gospeller, might have put it: You hypocrite, Pickles; first take the plank out of your own eye, and then you will see clearly to remove the speck from your brother’s eye.

game

Chris Game is a Visiting Lecturer at INLOGOV interested in the politics of local government; local elections, electoral reform and other electoral behaviour; party politics; political leadership and management; member-officer relations; central-local relations; use of consumer and opinion research in local government; the modernisation agenda and the implementation of executive local government.

Fracking: the latest challenge in the Tory heartlands

Martin  Stott

The hot days of July finally saw the debates around the implications of ‘fracking’ of unconventional hydro-carbons in the UK reach out and grab the attention of the national media. As Tory grandee Lord Howell called for the process to be focussed on the ‘desolate North’ (he corrected the initial impression that he was referring to the North East by saying that he really meant the North West) and  Energy Minister Michael Fallon was reported in the Mail on Sunday as warning that fracking was likely to face fierce resistance from the middle classes in Conservative heartlands, as if to prove his point dozens of protesters were arrested at an exploratory drilling site near the village of Balcombe in West Sussex.

Hydraulic fracturing or fracking – the process of drilling and then injecting fluid into the ground at high pressure to  fracture shale rocks to release natural gas, has caused a revolution in energy policy in the USA where gas prices have dropped dramatically as gas from fracking particularly in North Dakota, and more controversially Pennsylvania, has come on stream. Coal has suddenly seemed a dirty and expensive option and as a consequence carbon emissions from the world’s biggest economy have dropped significantly.

Can the trick be repeated in the UK? The Coalition Government is betting the farm –  quite a  few farms actually – that it can. Chancellor George Osborne announced in this year’s Budget that fracking companies would receive tax allowances for developing gas fields and would be able to offset expenditure on exploration against tax for ten years.The next tax avoidance scandal perhaps. Best known and a pioneer in the field is Cuadrilla (referred to by some opponents as ‘Godzilla’) whose explorations in Lancashire have amongst other things led to a couple of minor earthquakes near Blackpool in April and May 2011. But there are quite a few other companies across the country as the official estimate for UK reserves is 37 trillion cubic metres of shale gas in the north of England and geologists have yet to quantify reserves in the south.

But it is Balcombe in rural West Sussex which is becoming the test bed for what this means for energy experts, planners, campaigners and politicians. Campaign group Don’t Frack with the Fylde certainly raised the issues and those earthquakes, 1.5 and 2.3 in magnitude respectively, shook confidence in the safety of the technology (let’s face it: who notices in North Dakota where the  nearest house is 60 miles away?) but the opposition in southern England is having a greater impact on politicians and opinion formers. The Mail on Sunday’s  report of Sevenoaks MP Michael Fallon’s private briefing on fracking reported him as saying of potential well-heeled protesters ‘We are going to see how thick their rectory walls are, whether they like the flaring at the end of the drive.’ He admitted that exploratory drilling was likely to spread the length and breadth of southern England saying ‘The second area [after the North West] being studied is the Weald. It’s from Dorset all the way along through Hampshire, Sussex… all the way a bit into Surrey and even into my own county of Kent.’

This focus on the lusher parts of the South East which has started at Balcombe is going to be a real concern for Conservative strategists. The ‘Noting Hill set’ has repeatedly been accused of ignoring its rural base as proposals ranging from the sell-off of forests, to wind farm policies, changes in planning laws, opposition to which has been championed by the Daily Telegraph, and the HS2 rail route through the Chilterns have all been seen as a slap in the face for this rural base, many of whom have gravitated towards UKIP. But the Greens too have a presence in the South East, with their charismatic MP Caroline Lucas representing a Sussex seat, an MEP for the region and their only council, Brighton and Hove, only a few miles away.

Meanwhile up in Whitehall, the Department for Communities and Local Government has been ruminating on what to do about the planning and land use implications of promoting the fracking revolution and on 19 July it spoke,  issuing guidance  to local planning authorities. The guidance stresses that fracking could be a vital source of energy, saying ‘Mineral extraction is essential to local and national economies… minerals planning authorities should give great weight to the benefits of minerals extraction including to the economy when determining planning applications.’ It goes on to explicitly exclude any attempts by planning authorities to trade off fracking with renewable developments saying, ‘Mineral planning authorities should not consider  demand for or consider alternatives to oil and gas resources when  determining planning applications.’ Because of the scale and strategic nature of minerals planning applications these have remained a planning function of county councils, still Tory controlled in southern England.

It  remains to be seen if DCLG will allow a level of discretion in determining these applications by county planning authorities which could well limit or even stop fracking in its tracks in the south, or whether  as would be possible using potential secondary legislation  under the Growth and Infrastructure Act, it could take applications for  fracking for shale gas  out of the hands of county councils and instead have them decided by the Secretary of State as  part of the regime for nationally significant infrastructure projects. On the one hand it could bow to Tory pressure in the shires and allow all the developments to happen ‘up north’ by default as counties refuse most if not all applications. On the other, it may decide to take the risk, strip counties of their power and pull shale gas development permissions back into Whitehall. Only time, and a bit of local politics in the home counties, will tell.

stott

Martin Stott joined INLOGOV as an Associate in 2012 after a 25 year career in local government. He is National Policy Adviser on minerals planning for the Royal Town Planning Institute.

You couldn’t make it up – except DCLG just did

Chris Game

Did you see manager Arsène Wenger’s explanation of Arsenal’s feeble performance against Manchester City last Sunday?  While most players are galvanised by home supporters and see playing at home as an advantage, Arsenal’s apparently are scared by theirs. “They have a great desire to do well, so maybe they’re a bit too anxious that they don’t respond completely to the expectation level of the crowd.”

A strong bid, certainly, for this week’s You-couldn’t-make-it-up prize, were it not for the Department for Communities and Local Government (DCLG), who, not satisfied with inventing their own measure for disguising the severity of their grant funding cuts to councils, have now disguised it still further by double-counting. If the whole grant-slashing exercise weren’t so serious, the ineptitude really would be laughable. Ridicule aside, it can only serve to validate and reinforce the allegations of unfairness that core city leaders in particular have been making.

Nick Forbes, Newcastle City Council leader, kicked off in November, writing personally to David Cameron to complain about the ‘unfair’ impact of funding cuts on councils like Liverpool with cheap housing and therefore a low council tax base. Then on December 19th, local government finance settlement day, the leaders of all seven English core cities – Birmingham, Bristol, Leeds, Liverpool, Manchester, Newcastle and Sheffield – wrote jointly to Local Government Secretary, Eric Pickles, demanding an urgent meeting to address the “looming financial crisis” their authorities were facing.

The scale of the potential crisis was illustrated by reference to the Jaws of Doom’ graph – Birmingham’s version of Barnet Council’s now famous and similarly apocalyptic ‘Graph of Doom’, produced by the London borough to shock residents, but particularly Ministers, into realising that by 2020 councils would be facing a £16.5 billion shortfall, with no money left for anything apart from children’s services and adult care.

The ‘Jaws of Doom’ graph appears in Birmingham City Council’s budget consultation document (p.8) and does indeed resemble the gaping jaws of a crocodile, attacking from stage left, but unable to swallow the monstrous £600 million budget deficit for which the council estimated, last October, it was heading – and now, following the finance settlement, closer to £625 million.

jaws of doom

This is on top of the £275 million of mainly ‘efficiency and transformational’ savings, including a 25% staffing cut, already made over the past two years, and that have brought the council to the point where the Labour administration, elected last May, claims further efficiency savings are no longer enough. The severity of the reductions in government grant will necessitate significant cuts in front-line services. Hence the budget consultation: outlining the Council’s proposed four-year savings programme, and seeking residents’ views on detailed service cuts for 2013/14, and on alternative council tax scenarios – a further freeze, a limited increase of under 2%, or a larger increase requiring referendum approval.

One question, however, that the consultation document neither asks nor, judiciously, attempts explicitly to answer is: IS IT FAIR?  So I thought I’d have a go.

Are Birmingham and urban councils generally, or Labour councils, or the most deprived areas, being particularly harshly treated by these grant funding cuts? Or was Pickles right, when he insisted in his finance settlement statement that “overall the average spending power reduction for councils in 2013/14 is expected to be limited to just 1.7% per household”, and that “concerns that the poorest councils would suffer disproportionately are well wide of the mark”?

Well, let’s start right there, with that phrase ‘spending power’ (SP) reduction – used by Pickles and his civil servants in preference to the ‘grant reductions’ quoted by council leaders and measured by the ‘Jaws of Doom’. Are they different? You bet. SP was introduced in 2010/11, when the new Government announced its intention to cut central government grant funding of council revenue spending by an unprecedented 28% in cash terms (nearer 40% in real terms, allowing for inflation) over four years, with 21% ‘front-loaded’ in the first two years.

To disguise the savagery of that front-loading, and to make before-after comparisons more difficult, the DCLG first restructured the whole grant allocation system, and then created ‘revenue spending power’ – a measure Ministers claimed that, by including council tax receipts, certain specific grants, and NHS social care funding, gave a fuller picture of a council’s overall financial position. Fuller, yes, but not full. If it really was a full, rather than politically beneficial, picture that Ministers wanted, they could have included income from fees, charges and investments. These, however, are income sources that tend to decline in a recession and whose addition to SP would emphasise, rather than de-emphasise, councils’ grant dependency – so nothing like as helpful as the DCLG’s contrived measure, which could instantly reduce a 28% grant cut to a 14% cut in spending power.

You’d think this was sufficient, but this year, it seems, they’ve really over-egged the pudding by double-counting council tax support in two separate elements of SP. Sadly, at the time of writing, the Department was refusing to help Local Government Chronicle journalists with their enquiries into how the double-counting occurred, and whether it was intentional or accidental. Either way, Pickles’ claim of an average 1.7% spending power cut in 2013/14 was clearly wrong and should have been about a percentage point higher.

Having changed the system and invented new terminology, Ministers’ next rule is always to describe funding reductions in overall percentages, not cash. This fools no one who gives a moment’s thought to how grant funding works, but then there are plenty who don’t.

Formula Grant – the general grant allocated in the annual finance settlement – is calculated in four blocks, the two key ones being Relative Needs, to compensate for areas’ differing service needs, thereby broadly reflecting economic and social deprivation; and Relative Resources, reflecting the strength of an area’s council tax base and ability to raise its own revenue. In combination, these two elements mean some councils are much more reliant on central government grant than others. The more deprived the area, the greater is its need for council services, the lower its council tax base and tax receipts, and therefore the higher the proportion of its revenue spending that needs to be funded by central grant.

Overall in 2012/13, 27% of councils’ revenue spending is funded through council tax. But that proportion ranges from averages of 16% and 22% among Inner London and metropolitan boroughs to over 50% among shire districts. Even neighbouring councils’ grant/tax ratios can differ considerably – like Birmingham’s 84% grant/16% council tax and Solihull’s 67%/33%. What can be presented, therefore, as a uniform 10% grant cut across the country means for Birmingham a budget cut of 8.4%, for Solihull one of 6.7%, but for some shire districts barely 2%. Not so uniform after all.

The reforms to specific or targeted grants have hit councils in deprived areas relatively harder still. Some grants specifically conceived for deprived communities, like the Working Neighbourhoods Fund and area-based grant, have been run down or scrapped altogether. In contrast, the Council Tax Freeze grant to councils agreeing to follow the Government’s tax-freeze policy comprises a 3.5% addition to a council’s existing tax revenues, so benefiting most those with higher tax bases. Likewise, the New Homes Bonus Scheme, funded by top-slicing the central grant to all authorities by equal proportions, benefits disproportionately those in the south, where the bulk of the building is.

Obviously, there have been and will continue to be numerous other technical changes in the grant funding system, with criss-crossing impacts on different kinds of councils. Even a year ago, though, the Audit Commission’s Tough Times report was clear that “there is a strong link between local deprivation and the scale of funding reductions”, with “deprived areas in the north, the midlands, and inner London [experiencing] the greatest cuts”.

There have been several comparisons of the scale of funding cuts across individual local authorities, among the most accessible being the Guardian newspaper’s analysis and interactive map. English local authorities were found to be facing, on average, a cut of £61 a year per person in the total central government funding they would receive between 2011 and 2014, but the range extended from over £250 per person in Hackney, Liverpool and Knowsley to North Dorset’s £2.70.

The severity of cuts correlated closely with the Government’s own Index of Multiple Deprivation (IMD), examples including Liverpool – IMD 2nd, funding cut 2nd (₤252); Manchester – IMD 4th, funding cut 5th (₤210); and Birmingham – IMD 13th, funding cut 16th (₤166). Of the 30 councils facing the severest cuts, 28 are currently Labour controlled. All of which suggests – returning to Pickles’ other bluster from his finance settlement statement – that “concerns that the poorest councils would suffer disproportionately” are not so wide of the mark after all, and certainly not as wide of it as his own 1.7%.

game

Chris is a Visiting Lecturer at INLOGOV interested in the politics of local government; local elections, electoral reform and other electoral behaviour; party politics; political  leadership and management; member-officer relations; central-local relations; use of consumer and opinion research in local government; the modernisation agenda and the implementation of executive local government.