Council Tax Support – anatomy of a Pickles’ localism triumph

Chris Game

Shortly before the dissolution of Parliament, Communities & Local Government Secretary Eric Pickles issued an apparently self-penned eulogy of his ministerial record, entitled on the Government’s own website, in characteristic, cod Churchillian, style: Local Government: Delivering for England. It makes an interesting document, as would be hoped of one requiring two separate links.

First, I want to emphasise that it’s a genuinely useful exercise. It’s already easier than probably ever before to find out what the government thinks its policy is, at any particular time, both generally and by department and topic. Currently it has 224 of them. The DCLG has 24, including four each on local government and housing, and a rather extraordinary 215 “contain ‘local self-government’”.  There’s at least a Masters dissertation, surely: which nine Coalition policies failed to tick the ‘local self-government’ box?

Pickles’ eulogy, though, is quite different: a consummate politician’s listing of 60+ bullet-pointed triumphs and achievements, the like of which I at least can’t recall having for any previous administration.  The gov.uk version even gives us a proxy measure of the difference – in the dozens of instances of ‘[political content removed]’. And there’s another dissertation: the insight provided by the redacted and unredacted versions into civil service interpretation of ‘political content’ in the run-up to a General Election.

None of this, however, provides more than the opening key to the main subject of this blog. Somewhere between Pickles’ 50th and 60th bullet points – shortly before “supporting the Royal Wedding, Diamond Jubilee and VE Day by cutting Whitehall and municipal red tape on holding street parties, and introducing new laws to cut ‘elf and safety’ red tape on community events” – was “localising Council Tax Support (CTS), so councils are rewarded for getting people off the dole and welfare dependency and back into work, £1 billion has been cut from previous Council Tax Benefit (CTB) funding, and councils themselves bear the responsibility of increasing the living costs of some of their poorest residents.”

OK, I’d better come clean.  The ‘elf and safety’ bit is totally genuine – straight from the Pickles jar, as it were – but I’m afraid the last couple of clauses, after ‘back into work’, are mine, though, I would claim, entirely accurate and in a way slightly admiring.

For the CTB changes were Pickles’ self-styled muscular localism at its most politically skilful – a devolution of an important responsibility, impossible for councils to refuse, yet accompanied by conditions and constraints that meant any flak would go to them and any credit to the Conservative part of the Coalition.

The publication in the middle of the election campaign of the New Policy Institute’s third annual CTS monitoring report provides a timely opportunity to review one of the Coalition’s key and most controversial social policies, whose approaching launch was covered at the time in these columns.

The essence of the 2012 Welfare Reform Act was to replace, from April 2013, the means-tested Council Tax Benefit, paid for by the Department for Work and Pensions but administered to nearly 6 million recipients by local authorities, by Council Tax Support schemes individually determined and operated by the authorities themselves, and funded through business rates retention. It sounded like a laudable transfer of responsibilities from Whitehall to town hall – until you came to the attached strings.

First, with the professed aim of strengthening councils’ incentives to get people back into work, the amount the Government would pay local authorities for their new schemes would be 10% less than for CTB – creating for my own authority of Birmingham, for example, a funding gap of nearly £11 million.

Second, it ruled that pensioners receiving CTB must, and other particularly vulnerable groups should, be protected against any reduction in support – meaning in Birmingham that 54,000 pensioners were protected, while 83,000 working-age recipients were left shouldering potentially the whole savings burden.

It was only here, then, that the localism bit actually kicked in, with councils having the discretion, within a very tight deadline, to devise their own schemes to achieve these savings – and collect the taxes from their tens of thousands of new and aggrieved taxpayers.

In practice, this discretion amounted to three unenviable choices: spreading the cut in funding equally across virtually all CTB recipients apart from pensioners; giving the rebate to certain groups only; or continuing with the full rebate, and filling the gap either through raising council tax or finding savings elsewhere, on top of the savings already being demanded by the Government.

It would have been odd for a policy wholly designed to produce local difference not to do so, and there was and continues to be significant variation, in the metropolitan West Midlands as across the country. The practices adopted by the seven West Midlands metropolitan boroughs, though not statistically reflective of the national picture, can usefully illustrate it.

Game 9th April blog table

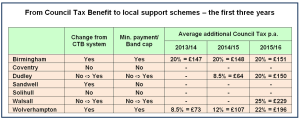
At that first time of asking in 2013, nearly 18% of the 326 English councils decided to continue with the same CTB-level rebate and somehow find the money, including four of the West Midlands seven.

70% of councils nationally and in the West Mids Birmingham and Wolverhampton – the two with the largest affected caseloads – introduced ‘minimum payment’ schemes, requiring everyone to pay at least some council tax, regardless of income. In Birmingham, therefore, it meant that almost all working-age people paid at least 20% of their council tax, representing an average annual payment of £147 or just under an extra £3 per week.

The remaining authorities, including Sandwell in our table, rejected ‘minimum payment’ but introduced other changes. Sandwell’s adjustments over the three years have included changing the income taper – the amount by which support is withdrawn as income increases; lowering the maximum savings limit over which one is no longer eligible for benefit; and reducing the second adult rebate – the benefit homeowners not on a low income receive if they share their home with someone (non-partner) on low income.

The main trends identified by the New Policy Institute over the now three years of CTS’ operation are the drop by nearly a third in the number of authorities still retaining all features of CTB, and the increase in percentage minimum payments – both seen in the West Midlands table. Nationally, 2.3 million low income families will pay on average £167 more in council tax in 2015/16 than they did under CTB, and 11% of those 2.3 million have also been affected by the ‘Bedroom Tax’ or ‘removal of the spare room subsidy’.

As for local councils, as is usually the case, they’ve generally coped – possibly too effectively for their own good. Some council tax collection rates have fallen fractionally, but nowhere (to my knowledge) as drastically as some predicted at the time. New council schemes to reduce worklessness are springing up all the time, but it’s difficult to identify which, if any, of these is incentivised by the CTB changes.

Something, though, is quantifiable.  Roughly £1 billion has been transferred from central government’s welfare bill to the shoulders of local government – and is being borne variously by increased bills for council tax support claimants, reductions in the claimant count, increased council tax bills for all, and reductions in other council budgets.  But then that’s muscular localism for you.

Chris Game - pic

Chris Game is a Visiting Lecturer at INLOGOV interested in the politics of local government; local elections, electoral reform and other electoral behaviour; party politics; political leadership and management; member-officer relations; central-local relations; use of consumer and opinion research in local government; the modernisation agenda and the implementation of executive local government.

An earlier version of the blog was published by The Chamberlain Files.
Queen Cersei and the evaporating Revenue Support Grant

Chris Game

Next week is the last week of Hilary Term, or revision week at the end of Spring Term, as it’s known here at the UoB and most other universities who feel no great affinity to the probably inappropriately named 4th Century St Hilarius of Poitiers. Over the many years in which I lectured undergraduates, I used rather to like it: end of the course/module in sight, legitimate chance to share and spread gossip about approaching local elections, lecture attendances boosted by students desperate for exam hints. Plus, nowadays, plenty of discussion-prompting visual aids – one of which is the pretext for this blog.

SIGOMA is not – disappointingly perhaps – an African hip-hop band, but less catchily the Special Interest Group of Municipal Authorities (outside London) within the Local Government Association. Yes, even the brackets are part of the full name – which has to convey that its 45-council membership comprises most major urban authorities in the North, some in the Midlands, plus the ‘South Coast regions’ of Plymouth and Portsmouth. The 45, claim SIGOMA, share similar characteristics and can therefore advantageously speak with a collective voice – moreover, with one that, particularly following the Coalition’s changes to the local government funding system, needs to be distinctive from that of the LGA with its responsibility for somehow representing the interests of all its 400+ member authorities.

These funding changes, argues SIGOMA, are so divisive, and their impacts so damaging to areas with characteristics like those of its members, that they threaten to set region against region in the manner of – well, Game of Thrones.  As even non-followers of the popular TV series may be aware, the US fantasy drama chronicles the violent dynastic struggles for control of the Iron Throne of the Seven Kingdoms of Westeros. SIGOMA’s spoof YouTube video is Game of Cuts Winter is Coming for Councils – and, at under 2½ minutes to Game of Thrones’ soon-to-be-five seasons, it’s inevitably (even) less subtle.

The Sean Bean character, Lord ‘Ned’ Starp, Warden of the North (possibly Steve Houghton, Leader of Barnsley MBC, SIGOMA’s administrative base?) and his mate from the Coastal Ports, protest that “our people are already on their knees … the sick have no one to care for them, and our children nowhere to read …”, while the spokesperson for “the hamlets of Bucks and Berks” remonstrates that they too are suffering, with “not enough funding to keep our tables supplied with swan and game”.  But sadistic Queen Cersei of the South and her incest-conceived son, King Joffrey, are unmoved: “All the regions have had to make their sacrifices. The money has been spread evenly and you will cope, for the sake of the Seven Kingdoms”.

Doubtless, Local Government Minister Kris Hopkins’ family arrangements are altogether more conventional, but his presentation of the 2015-16 finance settlement last December suggests similarly briefed scriptwriters:

“The local government settlement is fair to all parts of the country – north and south, rural and urban, city and shire – therefore every council should be able to deliver sensible savings while protecting frontline services for local taxpayers … Those facing the highest demand for services continue to receive substantially more funding. For example, Middlesbrough has a spending power per household of £2,441 which is £871 more than the £1,570 per household in Windsor and Maidenhead.”

As noted in my recent blog assessing that settlement this has been the standard – and increasingly disingenuous – government line for the past five years. That blog, though, was largely about ministers’ ploy – what one might call the ‘spending power sleight of hand’ – to mislead the media and public from the outset about the true severity of their cuts to the funding of the local government sector as a whole.  SIGOMA’s current campaign – Protecting Vital Services – is about the discriminatory distribution of the cuts within the sector, and particularly the impact of the funding changes since 2013-14, which cumulatively have switched the determination of government funding from assessed needs formulae to councils’ tax-raising capacity.

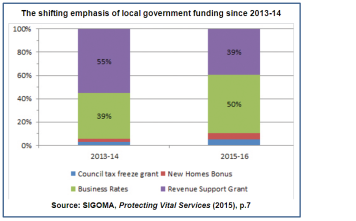
The big change was the introduction of the Business Rates Reduction Scheme (BRRS). It was cautiously welcomed by local government for its devolutionary principle, but SIGOMA-profile authorities were immediately concerned that, as BRRS funding increased and Revenue Support Grant (RSG) correspondingly decreased, the big gainers would inevitably be already prosperous authorities with higher rate-raising capacities, and the gap between them and the less well-off with the highest demand for services would continue to grow.

The New Homes Bonus Scheme (NHB) story was not dissimilar. It was launched in 2011-12 to incentivise local authorities to grant planning permissions for new homes and bring empty properties back into use. For each additional home they would receive for six years an annual bonus payment equal to the council tax generated – from the government’s own funding. Again, it was cautiously welcomed, although it was obvious that authorities with higher banded housing would be the bigger beneficiaries. But no sooner was it established than the government funding bit switched to a top-slicing of RSG, and again poorer authorities have been absolute, rather than just relative, losers.

The Council Tax Freeze Grant was slightly different, in being from the beginning a disadvantageous bribe to councils to cut their spending, but its relevance in this context is that it too is top-sliced from RSG. Put just these three policies together over the three most recent finance settlements, and RSG – the principal source of central government funding of non-schools revenue expenditure and traditionally the mechanism for recognizing councils’ differing resource needs – has shrunk as a proportion of local government funding by over 5% a year.

Chart Game blog

SIGOMA calculates that over just these three years authorities with higher grant dependency and greater formula share in RSG have lost proportionately twice as much (around 20%) as those with more buoyant rates bases and greater protection within RSG (around 10%).

Incidentally, further confirmations of deprived areas suffering most harshly from the government’s cuts have been produced over the past few weeks alone in an Institute for Fiscal Studies Briefing Note, by the Association of North East Councils, and, most tellingly, in evidence from the DCLG itself in the Public Accounts Committee’s report on the Financial Sustainability of Local Authorities (paras 8ff.).

Game of Cuts doesn’t go into the intricacies of RSG that SIGOMA’s Protecting Vital Services study does, confining itself to the billboard-style message that “Since 2010 local government in England has lost more than 40% of its core funding. Urban authorities, largely in the North and the Midlands, have lost the most money as a result of these cuts.” You don’t get SIGOMA’s proposed ‘fair and sustainable’ three-block future funding model either, but both productions, in their very contrasting ways, are worth a look – even if you don’t have a bunch of students to entertain.

Chris Game - pic

Chris Game is a Visiting Lecturer at INLOGOV interested in the politics of local government; local elections, electoral reform and other electoral behaviour; party politics; political leadership and management; member-officer relations; central-local relations; use of consumer and opinion research in local government; the modernisation agenda and the implementation of executive local government.

Pickles’ Shock-horror News: Biggest Councils Have Biggest Tax Arrears

Chris Game

Communities and Local Government Secretary Eric Pickles is famed for his sensitive news antennae. I wonder therefore just what – in a week dominated by revelations of his party’s and government’s moral flakiness on the whole tax collection business – persuaded those antennae that it would be a good time to attack local authorities’ tax collecting record.

Actually, I don’t wonder.  I assume that, as with the many other Pickles’ Passions – from council newspapers and biscuits at meetings (bad) to street parties and weekly bin collections (good) – he just can’t stop himself.

Councils’ uncollected taxes and hoarded revenue reserves have become Pickles’ winter perennials – a reassuring sign of approaching spring – and three league tables of the supposedly guiltiest councils were duly posted by the DCLG last Tuesday.

As a Birmingham City Council taxpayer, I was naturally interested to note that Birmingham featured prominently on two of these naughty lists – first of the 10 councils with highest council tax arrears, and fourth of those with highest non-ringfenced reserves – and, to be honest, slightly surprised that it didn’t register at all on the third. Doubtless to the minister’s disappointment, DCLG hadn’t found a single “surplus fixed asset, not directly occupied, used or consumed in the delivery of services”.

There’s no attempt to percentagise these lists, or acknowledge that there might just possibly be some relationship with, say, the size or relative deprivation of councils’ populations.  So Pickles’ shock-horror story amounts to large councils having bigger tax arrears, reserves, etc. than small councils.

It’s hardly headline stuff, but Local Government minister, Kris Hopkins, was determined we should share his boss’s outrage. During that same day’s Commons debate on the recent local government finance settlement, my and the University’s Birmingham, Edgbaston MP, Gisela Stuart, had questioned the fairness and sustainability of Birmingham’s share of that settlement. In customary Commons style, the minister, rather than answer that tricky question, preferred to tell the House about the council’s tax arrears:

“I am afraid that poor leadership in Birmingham and the fact it has not collected some £100 million in council tax arrears may explain some of the issues it is facing. Stronger leadership and the ability to carry out the simple function of placing a charge on an individual and collecting it will assist it” (col.671).

In the heat of the moment, Hopkins omitted to explain that this arrears figure was a cumulative one covering the whole 21-year life of the council tax, or that it includes costs incurred in collecting unpaid taxes. Nor, even more unfortunately, was there time for Gisela Stuart or anyone else to observe that the biggest councils have not only the largest cumulative tax arrears, but also, equally unsurprisingly, the largest tax receipts.

For, by Hopkins’ reasoning, Birmingham’s having collected £63 million more last year in council tax and non-domestic rates than any other English authority outside London presumably reflects rather positively on the quality of its political leadership (Table 5).

Returning from Planet Hopkins to the real world, the key statistics – and they are key – are those for tax collection rates: not pounds collected but percentages collected of the total sum due.

The 2013-14 council tax collection rate for all English authorities was 97%, ranging from shire districts’ 97.9% to 95.4% for Inner London boroughs and Birmingham’s most obvious comparators, the 36 metropolitan districts. Birmingham’s 95.3%, therefore, was fractionally below the met district average, but, as it happens, second highest among the 10 large authorities in the DCLG’s naughty list – behind only Croydon (96.2%) and way ahead of the coalition’s current favourite Labour council, Manchester (91.7%).

Certainly not the disgrace, then, that its heading of the naughty list suggested, but yes: both improvable and costly. If ever decimal places matter, it’s here. Though respectable nationally, Birmingham’s 95.4% collection rate was lowest of the seven West Midlands metropolitan districts – behind Solihull (98.6%) and, in a perhaps less expected second place, Sandwell (98%), ranked 9th most multiply deprived of England’s 326 local authorities against Birmingham’s 13th.  With each percentage point worth nearly £3 million, if Birmingham had achieved even Sandwell’s rate, it would have collected an additional £8 million – and a similar sum each year.

The DCLG’s non-ringfenced reserves naughty list is even more contestable. There is no set or professionally agreed formula for an ‘appropriate’ level of reserves, or for the balance between earmarked/ringfenced and unallocated reserves. But when CIPFA (Chartered Institute of Public Finance and Accountancy) asserts that councils increasing their cash reserves “is essential for protecting frontline services” and finance officers advise that, with council funding over the next few years being exceptionally uncertain, it’s only prudent to set aside reserves in anticipation, it’s hard for councillors – and should be for Pickles – to argue otherwise.

Birmingham’s prominence on this particular list – again, a consequence of its sheer size – is just perverse, given repeated warnings by the council’s external auditors about the councils’ reserves being, if anything, too low. In fact, last month’s Annual Audit letter noted specifically a concern regarding the “relatively low levels of general fund reserves (£85.8 million compared to a revenue budget of £3.5 billion)” (p.7).

Returning to tax collection, if there are numbers of individual councils that find it difficult to, as the minister put it, “carry out the simple function of placing a charge on an individual and collecting it”, what should we make of Her Majesty’s less than exhaustively tenacious Revenue and Customs (HMRC)?

One of HMRC’s helpful ancillary services – or hostages to fortune – is its annual report detailing all the taxes it doesn’t collect: in 2012-13 just the £34 billion – or 6.8% of the total it should have managed.  In other words, all but the very worst council tax collection rates exceed the average managed by the people whose sole job is tax collection.

If we take that most “simple function” of individual taxation, English local authorities failed to collect £734 million (3%) in council tax, while HMRC failed to collect £14.2 billion (5.3%) in income tax, NI contributions and capital gains tax. From businesses, councils failed to collect £478 million (2.1%) in non-domestic rates, while HMRC failed to collect £12.4 billion (10.9%) in VAT, and £3.9 billion (8.7%) in corporation tax.

As Matthew, the Galilean tax collector-turned-gospeller, might have put it: You hypocrite, Pickles; first take the plank out of your own eye, and then you will see clearly to remove the speck from your brother’s eye.

game

Chris Game is a Visiting Lecturer at INLOGOV interested in the politics of local government; local elections, electoral reform and other electoral behaviour; party politics; political leadership and management; member-officer relations; central-local relations; use of consumer and opinion research in local government; the modernisation agenda and the implementation of executive local government.

A reply to Fraser Nelson: the only thing astonishing is how little power local authorities have

Catherine Staite

Fraser Nelson’s article on Birmingham City Council last Friday was a very disappointing offering from an experienced journalist and a reputable paper – more Daily Mail then Daily Telegraph. 

It was riddled with inaccuracies.

Birmingham City Council does not have ‘astonishing power’. What is astonishing is how little power local authorities have, even in big cities.  Central government has as iron grip on local government. Money – how it is raised and spent – and policy – the thinking which underpins those choices – are the two key levers of government and central government controls them both.

The average amount of local authority income derived from Council Tax is 16%.  Council Tax is a regressive tax based on 1991 property valuations and bears no relation to the real costs of providing local public services.  LAs cannot increase CT by more than 2% without a referendum, for which they must pay.

The remainder of their income is made up of rents, fees and charges (local authorities can’t make a profit) and business rates (which central government gathers and re-distributes to a national format).  The remainder comes from grants from central government. BCC’s take from Council Tax is only 7.5% because of poverty and property values, which means it is disproportionately dependent on central funding, which has been cut by 35% since 2010.

The gap between rising demand and falling resources is getting wider by the minute in Birmingham, just like it is in Chicago.  The difference is that Chicago can run a deficit of billions – and has done so for the last ten years.  BCC has to balance its books.  It is still obliged to deliver over 1700 statutory duties – from trading standards to disposal of the dead to the protection of children. Year by year it has less and less room to manouvre.

What is really astonishing is that Birmingham and other local authorities still manage to deliver very good services. A recent Ipsos Mori poll showed satisfaction remains high.  That is because authorities have protected frontline services in spite of losing 15% of their jobs since 2010.

Splitting up Birmingham City Council would make no sense at all. The comparison with Manchester is entirely spurious.  The geography and demography of the ten unitary authorities in the Greater Manchester area is very different to Birmingham but the success of that area is built on collaborative upscaling not on separatism. They have banded together to create a Combined Authority. It’s the only way to get the economies of scale and critical mass to compete, bring growth and deliver infrastructure.

The West Midlands is not made up of unitary councils – it is a mixture of unitaries and two tier areas – encompassing counties and districts.  This makes it harder for Birmingham and the wider West Midlands to emulate Greater Manchester’s collaborative progress.  In Birmingham, some services are run at a neighbourhood level, and a district structure helps support better engagement and differentiation but there is nothing to be gained by splitting the city.

Birmingham is a global city, competing with Chicago, Melbourne and Guangzhou and dividing it up would be a nonsense.  Last week senior people from Birmingham City Council were in China, drumming up business for the city.  Would Beijing be interested in talking to Kings Heath District Council? I think not.

Blaming Birmingham City Council for the architectural failings of the 1950s is like blaming David Cameron for Suez.  It’s entirely pointless. Most cities have some 1950s and 1960s monstrosities but Birmingham is being very successful in transforming the city centre. The Bull Ring works, New Street Station is being transformed and whatever Prince Charles thinks about the new library, I think it is truly amazing.  It is beautiful and original.  What is more important is that it works.  Hundreds of thousands of people have flooded through its doors and librarians have had to work hard to keep up with the huge rise in demand for books.  That is the real measure of its success.

People hark back to the happy days of Joseph Chamberlain who as Mayor in the 1870s and thereafter transformed the city and created the legacy of civic splendor, including the University of Birmingham.  The difference between then and now is that he did have ‘astonishing power’ because he had control of both the money and the policy.  In spite of the herculean efforts of Lord Heseltine, central government controls the big money for skills, growth and infrastructure.  It is to the credit of Birmingham that they have done so much with so little.

Poverty is indeed a problem in Birmingham but not one which the city council can solve. National policies drive national poverty which is then concentrated in big cities. Birmingham is super-diverse and has a high proportion of young people.  Ethnic minorities and the young have been disproportionately effected by the recession.  Central government’s cuts to benefits to vulnerable people are shunting the costs of poverty onto local government at a time when they have few resources with which to respond.

Child protection is a stark example of this phenomenon.  Most child abuse has its roots in poverty, drug and alcohol addiction, domestic violence and mental illness.  Local government cannot solve all those ills alone.  Every serious case review and every inquest highlights a very simple lesson.  Children can only be protected when all the key agencies work together – schools, GPs, mental health services, the police, the hospitals – as well as children’s social care.  Cuts in public sector funding have a knock on effect on child protection.  West Midlands police cannot attend all the case conferences they should.  It is in those circumstances that children fall through the net.

Somehow it is always the Council that gets the blame.  They do hold the ring in a complex network of agencies, professionals and responsibilities – but they cannot always be expected to hold the blame.

Catherine Staite

Catherine Staite is the Director of INLOGOV. She provides consultancy and facilitation to local authorities and their partners, on a wide range of issues including on improving outcomes, efficiency, partnership working, strategic planning and organisational development, including integration of services and functions.

It’s not Labour or the LGA who are out of touch. It’s you, Minister!

Chris Game

Are you up to speed with your local finance jargon? If so, I wonder if you can explain the difference between a ‘widows tax’ and a ‘Bridget Jones tax’? No, it’s no use reaching for your £445 copy of the CIPFA Guide to Local Government Finance. The answer’s not in there. It’s the Conservative press you’re after, and specifically the Daily Mail and Daily Telegraph.

Monday’s edition of the Mail (that’s Monday, 6th May) thought it would be fun to scare its Bank Holiday readers with the news that “Labour plots ‘Bridget Jones tax’: Party accused of demanding an end to council tax discounts for singletons”.

Evidently the rest of what we once called Fleet Street was out to lunch, because it wasn’t until Thursday 9th that the Telegraph caught up with the story, by which time it obviously had to invent its own slant: “Town halls seek to levy ‘widows tax’”.

They are of course exactly the same thing – and neither, as we’ll see, remotely qualifies as news. But let’s stay with the papers for a bit. The Mail’s story opened as follows:

“Labour has been accused of plotting a ‘Bridget Jones tax’ on singletons as its local authorities demand an end to council tax discounts for those living alone.
In a formal submission to ministers, the Local Government Association [LGA] is calling for the power to end the 25 per cent discount offered in recognition of the fact single people place fewer demands on local services.
More than seven million are thought to benefit from the discount, at a cost of around £2.7 billion a year.”

It’s an interesting bit of reporting. The basic story is broadly accurate. One proposal in the LGA’s 24-page submission to the Government’s June Spending Review does indeed call for “the full and unconstrained ability to vary locally all council tax discounts including the single person discount”. In fact, it’s a kind of ‘belt and braces’ demand, because it could be seen as already implicit in the LGA’s more comprehensive proposal for “the removal of restrictions on council tax, so that councils can determine with their communities the appropriate level of tax and be accountable through local elections for doing so”.

The interesting bit is that the LGA is Conservative-led and Conservative-controlled – the party having been in control of over half of all English and Welsh councils following last year’s local elections. The Chairman of the LGA is therefore Conservative – Sir Merrick Cockell, from the Royal, and very Conservative, Borough of Kensington & Chelsea – and the Conservatives are also the largest group on the Association’s Executive. It would represent quite a coup for the minority representation of Labour authorities, if they had been able to hijack almost certainly the single most important document the LGA will produce this year – were it true.

Having already implied that the LGA was Labour-run, there wasn’t any real need for the Mail to offer further explanation, but there was a rather limp mention of that all-purpose stand-by for bewildered journalists – their anonymous ‘sources’. In this case, the “sources claim the campaign to end the discount is being driven by Labour authorities including Liverpool, Sheffield, Islington and Exeter”.

“and Exeter”. Brilliant. The sources certainly earned their pay-off there: three of the oldest recidivists around, and then, out of the blue, Exeter, to add real authenticity. A council that last year set one of the lowest district council tax rates in the country – so low that this year it was specifically allowed by Ministers to increase its bills by £5. A dangerous trouble maker, if ever there was one.

But it was more than enough for Communities Secretary, Eric Pickles, who not only ran with it, but suggested a name for what would have to be presented, of course, as a new tax: “There is clearly a well-orchestrated campaign being pushed forward by Labour councillors to target the most vulnerable. This is a Bridget Jones tax and shows how out of touch Labour are”.

Not, however, to quite the degree that his colleague, Brandon Lewis, appears to be. The Local Government Minister explained to the Daily Telegraph that it is in fact the LGA that “is completely out of touch by calling for stealthy council tax hikes – how strange they didn’t have the courage of their convictions to highlight this before election day.”

So let me get this straight. Our Conservative Minister would have liked it publicised, during the county council elections campaign, that the Conservative-led LGA was calling for stealthy council tax hikes? I find it a little surprising, but, if that was what he really, really wanted, he could have announced it himself – because the whole Spending Review submission – including, in bold type, the council tax discounts bid – had been produced back in March and had been in the public domain and available for every one of us to read throughout the campaign.

So which is it? Had he not read it, or forgotten it, or not realised its potential political exploitability? Whatever, I don’t think he’s in much of a position to make accusations about others being out of touch.

game

Chris is a Visiting Lecturer at INLOGOV interested in the politics of local government; local elections, electoral reform and other electoral behaviour; party politics; political leadership and management; member-officer relations; central-local relations; use of consumer and opinion research in local government; the modernisation agenda and the implementation of executive local government.

Conservative and Labour council tax claims: both right, and both deceptive

Chris Game

It used to be a toss-up which would come first: the political parties launching their local election campaigns or the letter in The Times claiming its author has heard the first cuckoo of Spring. Sadly, with the cuckoo’s drastically declining population both here and worldwide, it’s the politicians that usually win these days, but perhaps it’s some kind of compensation that they can generally be relied upon to produce some distinctly cuckoo-like behaviour – as in daftness, rather than parasitism.

David Cameron chose Nuneaton in Warwickshire for his launch of the Conservatives’ campaign, which electorally certainly made sense. With the most non-Conservative areas in several traditional counties having become unitaries, Warwickshire is one of the few genuinely marginal counties around, with the Conservatives maybe having the edge in votes, but Labour having run the county council for longer in recent years as a minority administration. Come to the West Midlands in April, though, and you have to confront the Aston Villa relegation issue. Cameron was “sure it’ll be alright in the end”, which in the circumstances, and especially as he was careful not to define “end”, was also not daft. Some of his other views, though, did seem to suggest that he might have just migrated in from Africa.

The Government’s Localism Act had empowered local government, he asserted, so local elections now mattered more than in the past …We’ve given councils much, much more freedom …”. It was the double emphasis that took the biscuit. It must be really, really difficult for most councils, having seen their grant funding slashed year by year, and having just implemented their fourth round of spending cuts to meet budget and tax ceilings effectively dictated by the Government, to identify quite where all this freedom and electoral meaningfulness are hiding.

However, it’s not the function of an INLOGOV blog to engage in partisan knockabout – no, really, it’s not. This one’s serious purpose is to try to inject a bit of factual clarification into what looks like becoming a pretty heated debate about council tax – a little ironically, talking of electoral meaningfulness, when very few of the councils holding elections are actually billing authorities.

In neighbouring Worcestershire, for instance, should electors in Bromsgrove and Malvern Hills vote as if to punish their tax-collecting Conservative councils for rejecting Cameron and Pickles’ “clear moral imperative” to freeze their council taxes for the sake of “hard-working families and pensioners”? That presumably would be a demonstration that local elections mattered. Or should they reward Conservative Worcestershire for taking the Government’s one-off grant (equivalent to a one per cent rise in council tax) and freezing the much bigger portion of their tax bill?

It’s a definite complication for the Conservatives, who would have liked to be able to contrast phalanxes of blue councils, which had obediently taken the grant and frozen their tax bills for a further year, with loads of red and orange/yellow ones that had ignored their “moral imperative” and increased theirs. There was no lack of ministerial arm-twisting (proverbial, I presume) and other threats and pressures to which Conservative council leaders were subjected, but at the end of the day, as the Sunday Telegraph was one of the first to document, the figures just didn’t turn out right.

In a mid-March survey of all 353 English councils, the Telegraph found first that a total of 124, or more than a third, were increasing their council tax bills as a way of raising revenue. Secondly, more than half of these offending councils (64) were Conservative – that’s more than one in three of those the party currently controls. Some, moreover – as can be confirmed in a more recent House of Commons briefing paper (Appendix 7) – were seriously big and embarrassing names.

The three tax-raising counties were almost bound to be Conservative, and indeed are – Cambridgeshire, Surrey, and a particularly interesting A N Other. The six London boroughs were more mixed. There were 2 of Labour’s 18 – Lewisham and Harrow; 1 of the Lib Dems’ 2 – Kingston-upon-Thames; and 3 of the Conservatives’ 11 – Bromley, Croydon, and, with the biggest increase of all at over 3%, Wandsworth. As for A N Other, the Sunday Telegraph seemed almost salivatingly pleased to note that the Tory miscreants “included Oxfordshire County Council, which is David Cameron’s local authority, and Runnymede Council in the constituency of Philip Hammond, the Defence Secretary.”

None of this, of course, is going to stop the Conservatives exhorting us in virtually every campaign speech to vote Conservative for lower council taxes. But listen carefully to what they actually say, like Cameron himself on Friday: “On average, on a Band D bill, Conservative councils continue to charge lower levels of council taxes than Labour or Lib Dems.” And it’s perfectly true. It generally is. And, unless you stop and think about it for a few moments longer than most voters are probably likely to give it, it’s seriously misleading.

As, in a very similar way, is Labour’s counter-claim that we should vote for them, because, to quote Hilary Benn, Shadow Secretary for Communities and Local Government, from last year’s election campaign and no doubt from this year’s as well: “Households in Labour-controlled authorities pay on average less council tax per year than those in Tory and Lib Dem areas”.

Note the small, but hugely significant, difference: Conservatives: average Band D; Labour: average per household/dwelling. If I were preparing students for an exam, I might suggest they use a mnemonic – say, Bullingdon and Downing Street for Band D – but I’d also try to get them to think it through, because it’s really not brain-hurting stuff.

The tax base for council tax is a ratio system based on 8 valuation bands, centred around Band D (properties valued, in 1991, at ₤68,000 to ₤88,000). Band A properties (under ₤40,000) pay 6/9 (2/3) of Band D; Band B 7/9, and so on up to Band H (over ₤320,000) paying 18/9 (2x) of Band D. Councils calculate their tax base by weighting the number of dwellings in each band to Band D, and report their budget headlines in terms of ‘Council tax for council services (Band D)’.

Band D has thus become a benchmark for comparative purposes, and it is perfectly reasonable for the Conservatives to use it – reasonable but disingenuous. Not so much because only a small minority of properties (15% in England) are actually in Band D, but because, exacerbated by the absence of any revaluation since 1991, the mix of property bands across authorities and regions nowadays varies starkly. In my own authority of Birmingham 66% of properties are in Bands A and B, and just 8% in E to H combined. Neighbouring Solihull has 29% in Bands A and B, and also 29% in E to H. In the North East there are 55% Band As, in the South East 9%, in London 3.6%.

All of which obviously means that, to raise any particular sum of money in an authority with mainly Band A to C properties requires a higher Band D tax than in one comprising many E to H properties. The average bills paid per household will vary similarly – being generally higher than the Band D figure in more affluent and Conservative-inclined areas, and lower in less affluent or Labour-inclined ones. Hence Labour’s equally disingenuous preference for average tax bill figures. Two contrasting Inner London boroughs provide an illustration. Kensington and Chelsea: Band D – £1,086; average tax per dwelling – £1,190; Tower Hamlets: Band D – £1,189; average tax per dwelling – £787.

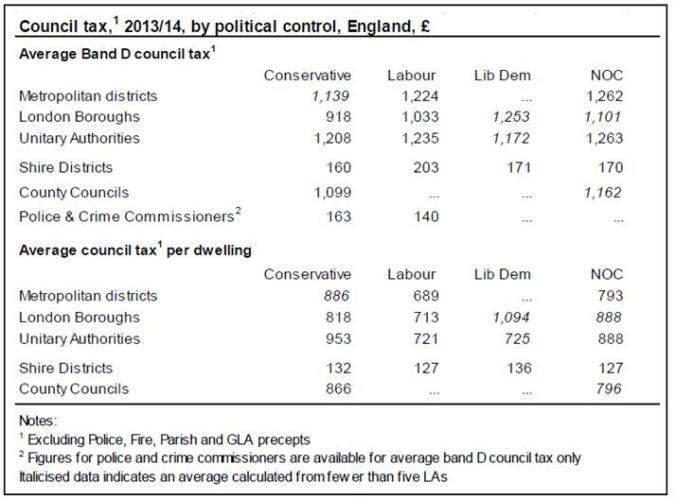
The parties have been playing this rather irritating game seemingly forever, and at one time it fell to party researchers or friendly academics to have to ascertain councils’ political control, decide whether it had been long enough to influence budgetary and tax policy, and produce the necessary statistics. In recent years, possibly irritated at hearing the same arguments repeated year after year, the estimable House of Commons Library staff (and notably Matthew Keep) have taken over, and a table on page 9 of the research briefing referred to above and reproduced here enable us, and, if they choose, MPs to compare the figures for ourselves.

game table apr 22

They show that, in all comparisons in which more than 5 authorities are involved, the average band D council tax is lower in Conservative-controlled authorities than in those controlled by Labour, the single exception being Police and Crime Commissioners, where the lower levels were set by Labour. But in all cases the average council tax per dwelling is lower in Labour-controlled authorities. It’s difficult to say just what, if anything, this proves, but it surely means that we need hear no more of these particular claims. In your dreams!

game

Chris is a Visiting Lecturer at INLOGOV interested in the politics of local government; local elections, electoral reform and other electoral behaviour; party politics; political leadership and management; member-officer relations; central-local relations; use of consumer and opinion research in local government; the modernisation agenda and the implementation of executive local government.