Want a 50% turnout in a local election? Try Neighbourhood Planning

Chris Game

Yes, there were other news stories last weekend – Grangemouth, St Jude, Plodgate, Merkel’s mobile, Lady Gaga’s new album. Still, a more than 50% turnout in something local governmenty surely merited some kind of headline.

Last autumn, remember, the national turnout in the police commissioner elections was under 15%. Yet on Thursday, in the Cheshire village of Tattenhall, they voted in droves – not for a mayor, councillor, or commissioner, but to express overwhelming backing for their neighbourhood development plan.

From the damp squib of elected mayors to the micro-meddling of Communities Secretary Eric Pickles, the Coalition’s localism agenda has hardly been an unqualified triumph. With neighbourhood planning, though, it does seem to have hit on something capable of imbuing in at least some of us “a zeal for participation”, as Nancy Holman put it in her recent, more conceptual, discussion of the topic.

Introduced in the 2011 Localism Act, neighbourhood planning is about giving people more influence over planning decisions affecting their daily lives: choosing where new homes, shops and offices should be built (or not built), what these buildings should look like, and what infrastructure is needed.

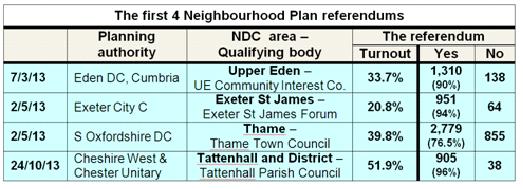
The Act allows parish and town councils or other representative community groups (as in the Upper Eden and Exeter cases described below) to formulate Neighbourhood Development Plans (NDPs), that will shape development in their area – provided they ‘have regard to’ national policies and conform with local planning strategy.

Proposed NDPs must pass an independent standards check, usually by a planning inspector, and are then put to a referendum, organised and paid for by the local planning authority. If the Plan receives majority approval, the planning authority must adopt it, and it becomes part of the legal framework with which future planning decisions must comply.

Last Thursday, in the fourth of these referendums, nearly 52% of residents turned out and 96% of them supported the Tattenhall and District NDP – which means it now has legal status? Well, not quite yet.

game table

The NDP is a professionally prepared 30-page document replete with a vision, objectives, a strategy, implementation plan, maps, appendices, and six clear policies on various aspects of community life. But not all policies are equal, and here Policy 1 on Housing Growth is clearly more equal than the others that flow from it.

There are currently 1,090 homes in Tattenhall parish and the Plan proposes allowing up to 30 new homes in the built-up village in the period to 2030, plus some smaller scale development elsewhere in the parish. Three national housebuilders, however – Wainhomes, Barratt Homes, and Taylor Wimpey – have applied to build a total of 305 homes in what the Plan regards and rejects as “large-scale inappropriate development along existing village boundaries”.

The builders contest some aspects of the Plan and also the independent examiner’s impartiality, and the first two firms have lodged a judicial review challenge, which, until the High Court has deliberated, will prevent the Plan being formally adopted and joining what Planning Minister Nick Boles has called the quiet planning revolution.

He used the phrase back in March to describe the similarly positive outcome of the first referendum in, appropriately enough, Eden – though not the Garden thereof, but Eden Valley to the east of the Cumbrian Lake District.

The Upper Eden NDP is quite different from Tattenhall’s, not least because the area is extremely sparsely populated and about 17 times Tattenhall’s size. Again, the main focus is housing, but the proposed development rate here is 40 homes a year, and 545 over the plan period to 2025 – a higher total than the 479 in the district council plan, with all 66 extra homes allocated to rural areas that the parish councils involved in preparing the NDP felt had previously been overlooked.

Other policies include increasing affordable rural housing by permitting more conversions, incentivising developers to provide more housing for older people, and improving broadband provision. This being the first NDP referendum, there was a lot riding on it, not least for Ministers, and Upper Eden delivered. In a 34% turnout – nearly double that for Cumbria’s police commissioner vote – 90% backed the Plan.

The St James area of Exeter, site of the next plan that went to referendum, is completely different again: 6,000 residents sandwiched between the city centre and university campus in a community that has been losing its traditional and diverse character through the intrusion of traffic and car parks, neglect of green space, but particularly the conversion of family homes into houses in multiple occupation (HMOs) – student occupation.

The NDP was prepared by the Exeter St James Forum, a group of local people, including students, brought together initially by residents’ associations. Key policies included restricting the spread of HMOs and bringing more social balance to the area, encouraging small businesses, a tree planting campaign, and identifying certain residential streets for ‘home zone’ treatment with reduced and slowed traffic.

In a May 2nd vote in a student-dominated ward, turnout was an unsurprisingly disappointing 21%, but the endorsement of the Plan a positively Putinesque 94%.

The last of the four NDP referendums to have taken place so far was held on the same day, in the South Oxfordshire town of Thame, and we have another quite different scenario.  For Thame’s NDP was a direct response to the core strategy in South Oxfordshire’s local plan, which proposed to allocate 600 homes on one large site on the outskirts of the town, rather than, as many residents seemingly preferred, on developable sites within the town itself.

The district council, to its credit, backed Thame Town Council’s bid for government funding to produce its own NDP, on the understanding that it could cover only non-strategic issues and not, for instance, the numbers of proposed homes. Advised by professional urban designers, the town council consulted with residents, identified more than enough potential sites, and eventually agreed on a ‘Walkable Thame’ option, the condition of which is that new homes should be within walking distance of Thame town centre.

In the May referendum it was approved by a more than 3 to 1 majority on a nearly 40% turnout. As the local media justifiably boasted, Thame residents had become the first in England to pick their own housing sites through a neighbourhood plan.

Three more referendums are currently lined up, but this is a trickle with the potential to become a flood. There are now well over 600 recognised Neighbourhood Planning Areas, and Ministers claim that over half of English local authorities are working with groups on community planning, many of whom are receiving government grant funding to help them prepare draft plans.

It’s far too early to draw any serious conclusions – as to whether neighbourhood planning will constitute a quiet revolution or anything else. But one almost instant criticism of NDPs, raised also by Nancy Holman in her references to NIMBYism, was that they would appeal most to parish and town councils in relatively less deprived rural areas in the already over-heated south-east.

It may well prove to be true, but the four very disparate Plans to have come almost arbitrarily to referendum so far offer little support.

game

Chris Game is a Visiting Lecturer at INLOGOV interested in the politics of local government; local elections, electoral reform and other electoral behaviour; party politics; political leadership and management; member-officer relations; central-local relations; use of consumer and opinion research in local government; the modernisation agenda and the implementation of executive local government.

It’s been 30 years coming, but Clause 38 is still really bad news

Chris Game

Sometimes you hear “All things”, but the ancient proverb and the modern Guinness advert agree that it’s “Good things come to those who wait”. Unfortunately, bad things do as well, and for local government Clause 38 of the Local Audit and Accountability Bill is a bad thing that’s been waiting to happen for 30 years and now finally has.

Full badness details will follow, but first, please excuse some personalised scene-setting. The LAA Bill is through the Lords and should get its Commons Second Reading later this month. Its main and originally entire purpose, embodied in Clauses 1 to 37, is to complete the Audit Commission’s abolition and introduce from 2017 a new regime for local authorities and other public bodies to appoint their own auditors. Yes, it is controversial, but a controversy best pursued by more knowledgeable others.

The sole concern here is Clause 38, one of two added by Communities Secretary Eric Pickles and the DCLG long after MPs’ scrutiny of the draft Bill had been completed. It comprises Ministers’ intention to turn the Code of Recommended Practice on Local Authority Publicity from guidelines with which councils are currently recommended to comply, into a statutory document with which they must comply.

There are several wrongs here, quite apart from Ministers’ extraordinary Humpty Dumpty attempt – “when I use a word, it means just what I choose it to mean” – to label it an exercise in ‘localism’, because it seeks to protect the interests of local newspaper publishers against those of elected local authorities. The story starts, though, in the adventitiously appropriate year of 1984.

Then, as now, Ministers were in a lather because a handful of mainly London councils were doing things they didn’t like: some admittedly dubious, but most provocatively ‘political propaganda on the rates’ – when the phrase, unlike when their successors use it today, at least made literal sense. The then Pickles, Patrick Jenkin, played to his party conference audience by announcing what would become the Widdicombe Committee of Inquiry into the Conduct of Local Authority Business, designed to do a hatchet job on those pesky Labour boroughs.

It didn’t work out quite like that – partly, I like to think (as one of the researchers), because of the Committee’s commissioning and use of an extensive programme of independent research, and partly through refusing in its main report to deliver the censorious denunciations of local government practice for which Ministers were apparently looking.

That main, research-based Widdicombe Report, though, was preceded by a quick-and-dirty, research-free interim report on local authority publicity. The Committee members didn’t want to play, and used the opportunity to rehearse their views that local authorities were more than a sum of their services, and had a duty to inform the public both of their own functions and on local government matters generally.

They delivered a divided report, but the majority verdict calling for a prohibition of publicity designed to support a political party was enough for Ministers to produce a statutory political publicity ban, based not on content, which was Widdicombe’s concern, but intent – indeed, possible intent: any material which appeared designed to affect, “or can reasonably be regarded as likely to affect”, support for a political party, cause or campaign.  Remember those conjectural words; there’s more coming up.

The only constraint on the Government in the 1983-87 Parliament were the Lords, and here they removed “likely to affect”, and a good deal else besides, and refused to agree to any code of practice being more than advisory. But the reprieve was short-lived and by 1988 there was a new Act with an even more restrictive definition of legitimate publicity, embedded in a Code of Recommended Practice to which authorities were required to “have regard”.

There have been various interim revisions of the Code, but none that have changed its fundamental character: a set of recommended principles and ultimately voluntary practices, written and scrutinised as such, with none of the forensic drafting rigour that would have been brought to a document intended for legal enforcement. But change “have regard” into “must comply” and you change everything, and that’s what the Government is doing in Clause 38.

I’ll look first at the Publicity Code itself, then at the proposed means of enforcement. The Code’s most recent revision in 2011 was driven jointly by the Newspaper Society – arguing (without much support from hard evidence) that council publications, rather than the internet and broadband, were the crucial threats to local newspapers’ sales and advertising revenues – and a receptive Eric Pickles, two of whose favourite hate taunts are ‘propaganda on the rates’ in the form of ‘town hall Pravdas’ or council newssheets.

Up front in the Code are seven key principles: that publicity by local authorities should be lawful, cost effective, objective, even-handed, and appropriate, should have regard to equality and diversity, and be issued with care during periods of heightened sensitivity.

Even here there are examples of the real slackness and imprecision with which the Code is, and will remain, littered. What do ‘have regard’ and ‘care’ mean? How tall does sensitivity have to grow? And another of those conjectural phrases we saw earlier: objectivity is infringed by “anything likely to be perceived by readers as constituting a political statement, or being a commentary on contentious areas of public policy”. Whether or not you think it reasonable for a political body to make a political statement or an observation on a contentious policy, what kind of yardstick is the likely perception of all, or most, or some, or a vexatious handful, of your readers?

To repeat: in a voluntary code, already overseen by numerous laws, auditors, and the Advertising Standards Authority, these vaguenesses are merely irritating and a potential get-out. In a statutory code, they can cost potentially serious money.

Probably the code’s most contentious provisions are that, where councils do publish “newsletters, newssheets or similar communications”, they should not be issued more frequently than quarterly, or “seek to emulate commercial newspapers in style or content”.

The majority of council newspapers are now quarterly, although even a monthly publication – an appropriate and cost effective frequency, one might argue, for keeping residents fully informed of service developments and changes, consultations, forthcoming council business, councillors’ surgeries, traffic orders and planning notices – could hardly be said to be emulating the style of commercial newspapers, whatever that might be guessed to mean.

What we have, then, is one more example of Ministers’ typical modus operandi in their dealings with local government. They see something they don’t like being done by a few London boroughs on their proverbial doorstep – in this case, distributing a weekly newspaper (Tower Hamlets) or fortnightly magazine (Newham). Then, instead of letting residents decide for themselves whether they approve of how their money’s being spent, they outlaw it with ill-prepared legislation applying to every principal and parish council in England – in the name of localism.

Which brings us to the enforcement debate. Clause 38 allows the Secretary of State to direct one, some or all authorities to comply with part or all of the Code, whether there are grounds for believing they are currently breaking it or not.

How, though, do you judge either compliance or non-compliance with a code as casually drafted as this one? Even in the apparently straightforward case of council publications, there’s no definition even of ‘newsletter’ or ‘newssheet’ or when either metamorphoses into a newspaper, let alone of what emulating commercial newspapers in style and content entails.

“Contentious issues” – like HS2, a third runway at Heathrow, large housing developments, cuts to police and fire services, hospital closures, welfare reforms – are, well, even more contentious.

At present, if an authority feels it or its residents would be severely adversely affected by a government policy, it can “have regard” to the principles of the Code, but still judge the matter sufficiently important for it to explain its opposition in a way that will certainly be perceived by at least some readers “as constituting a political statement, or being a commentary on contentious areas of public policy” – because that’s what it’s intended to be.

LGA Chairman, Sir Merrick Cockell, picks HS2, and specifically the cross-party 51M alliance of 19 local authorities opposed to it, as a topical issue that highlights the almost laughable irrationality of the Government’s proposals. The authorities have already challenged the Government’s policy in the High Court, may carry on the fight in the Supreme Court, and will surely petition Parliament for amendments to any eventual legislation. Yet, if they attempt publicly to explain their case and how they’re spending residents’ and taxpayers’ money, they would in future risk being individually and/or collectively prevented, on the grounds of infringing the Code.

It seems that, after nearly 30 years’ waiting, Pickles and his colleagues are about to achieve what their Thatcherite predecessors never quite managed: the power to gag any council’s questioning of any Government policy. It would have been bad legislation then, but in today’s hugely different political climate, it looks, if anything, even worse.

Chris Game - pic

Chris Game is a Visiting Lecturer at INLOGOV interested in the politics of local government; local elections, electoral reform and other electoral behaviour; party politics; political leadership and management; member-officer relations; central-local relations; use of consumer and opinion research in local government; the modernisation agenda and the implementation of executive local government.

George Osborne’s budget surplus: paid for by local government

Chris Game

In his party conference speech on Monday, Chancellor of the Exchequer George Osborne announced that a Conservative Government would seek, by the end of the 2015-20 Parliament, to have eliminated completely the roughly £120 billion national deficit and be running a budget surplus. It would do so, moreover, without raising taxes or cutting capital spending. The audience and most of the business world applauded, naturally, while Labour spokespersons seemed at least temporarily stunned.  The best immediate response they could manage was that the Chancellor’s record for meeting his past deficit-elimination targets was pretty flaky, so why should this one be any different.

In fairness, they had cause to be taken aback. The last time a government managed what is sometimes termed an absolute budget surplus – meaning it generated more revenues, including tax yields, than it spent – was in 2001, and it’s only happened about seven times in the past half-century. Not as rare, then, as a Brit winning Wimbledon or the Tour de France, but more so than England winning the Ashes (10, if you were wondering), and excuse, surely, for another spasm of flag-waving and nationalistic celebration?

Possibly, though probably not for most of those in or reliant upon local government, for whom it’s hard to know which scenario would be more painful: the achievement of a surplus by 2020, or being forced to aim for one and not achieving it.

The problem is that this budget surplus isn’t quite the kind of target that Local Government Association Chair, Sir Merrick Cockell, suggested subsequently at a Localis conference fringe event.  He observed that a surplus could be arrived at by one of two ways – either by government planning for the public finances to go into the black following spending reductions, or through growth in the economy increasing revenues.

Technically, of course, Sir Merrick’s right. But, wearing his LGA hat, he must know that a budget surplus by 2020 is not going to be achieved under a Conservative or Conservative-led Government either by some hitherto undreamt of explosion of economic growth, or by two lines on a graph, expenditure and revenue, each moving chummily towards the other and eventually converging.  He must know, because he’ll have seen the projections, that in this instance one line, revenue, stays unhelpfully almost horizontal throughout virtually the whole of the relevant  period, leaving the expenditure line to do all the converging on its own.

game

The graph is drawn from projections published this July by the Office for Budget Responsibility (OBR), to which local government followers of LSE’s Professor Tony Travers are regularly commended, most recently in his article in this week’s Public Finance. More specifically, the projections are from the supplementary data published alongside the OBR’s annual Fiscal Sustainability Report, of which this summer’s was the third.


Total Managed Expenditure (TME) covers all spending by central government, local authorities and public enterprises: both the directly controllable Departmental Expenditure Limits (DEL) – the budgets set for departments, Non-Departmental Public Bodies and local authorities in the three-yearly Spending Reviews – and the frustratingly uncontrollable Annually Managed Expenditure (AME) – departmental spending that can’t reasonably be restricted to three-yearly cycles (mainly social security benefits, tax credits and public sector pensions) plus debt interest. Public Sector Current Receipts (PSCRs) are largely taxes and National Insurance Contributions.

There are two potentially deceptive features of the graph as I’ve set it out: the conflated vertical axis, and the 2010-11 starting date. Between them, they have the effect of emphasising the single-year spending blip in 2013-14 and de-emphasising the remarkable nature of the trend.

The historic trend of public spending is, if I correctly recall my Latin, prorsum et sursum, onwards and upwards. Between 1956-57, the year I went to the secondary school in which I learned that Latin, and 2009-10 there was an average growth of 3.2% a year; from 2000-01 an average of 4.7%.  We’re now in an 8-year period in which it’s projected to fall by an average of 0.3% a year, in the middle of which a small upward AME lurch is but a proverbial pimple.

Sharp-eyed readers will have detected by now that, rather disappointingly after all that earlier talk of convergence, the two main lines on the graph don’t in fact converge – in 2020 or indeed at any subsequent date. The gap – the public sector net borrowing requirement – has certainly lessened, from 9.9% of GDP in 2010-11 to 6.8% in 2013-14. But the OBR’s current forecast still shows a gap of 1.5% (around £30 billion) in 2019-20, and that, of course, is one measure of the scale of the surplus problem.

The PSCR line, having struggled up to 38% in 2011-12, just stays there, projected by the Office for Budget Responsibility to fluctuate throughout the rest of the decade by barely half a percent, presumably irrespective of the political complexion of the post-2015 Government.

So, even if the Chancellor hadn’t confirmed that the deficit-vanishing trick was going to be accomplished without tax increases, it’s clear that whatever convergence there’s going to be will have to come, as suggested on the graph, from further spending cuts – and at a time when the long-term spending pressure of an ageing population is already growing by the year.

The OBR has a whole mini-vocabulary for deflecting responsibility when particularly its longer term forecasts turn out rather differently. My addition to the graph, therefore, is what they’d call an illustrative, broad-brush projection, rather than a precise forecast. The thing is, I can’t rid my mind of the image of a black arrow, heading straight for local government.

game

Chris Game is a Visiting Lecturer at INLOGOV interested in the politics of local government; local elections, electoral reform and other electoral behaviour; party politics; political leadership and management; member-officer relations; central-local relations; use of consumer and opinion research in local government; the modernisation agenda and the implementation of executive local government.

The Butler 1944 Education Act: both milestone and millstone

Chris Game

A ‘Legislative game-changer’ was what we were asked for. Or was it ‘Legislative Game-changer’?  No matter; this one was both. It’s exactly a half-century since the summer of ’63: Profumo and Keeler, Philby, the Great Train Robbery, the Beatles, Sindy dolls, and my leaving the boys’ grammar school, to which I’d ‘won’ a place seven years earlier by passing the compulsory 11-plus exam, and going to university. Statement of fact, but also declaration of interest.

The 1944 Education Act more than changed my life; it shaped it. It shaped me, like millions of others, into an entirely different person from the one I’d have become, born even 15 years earlier. Its shaping of me was, I like to think, positive, and certainly I’d be judged a successful product of the Act and the educational system it established. That shaping, though, included the acquisition of a disinclination to accept even good things entirely without question, which is why this account of the Act differs rather from the ‘Can’t-we-just-be-proud-that-we-created-an-entire-education-system-in-the-middle-of-wartime?’ story my father would undoubtedly have preferred.

That 11-plus exam, my result in which was far and away the most celebrated present I ever gave my parents (who believed it a measure of the discredited Cyril Burt’s Intelligence Quotient), had a flip side. It created roughly 80% of publicly defined 11-year old ‘less intelligent failures’ – like, four years later, my younger sister.

The 11-plus (we even called it the ‘Grading Test’) and the ‘tripartite’ or effectively bipartite system to which it was the key – aptitude-differentiated grammar, secondary modern, and a few technical schools – opened up each year new social divisions and reinforced old ones. Its General Certificate of Education (GCE) exams, normally taken at 16 and 18, disqualified a majority of the nation’s children from qualifications and ensured that full participation in secondary education remained, to quote one critic, “very much a minority pursuit”.  And that’s not to mention (yet) the Act’s failure even seriously to challenge the enduring wormcans of church/faith and independent/private schools. So yes, millstone as well as milestone.

That the Act was a milestone, landmark, etc. there can be no doubt. It replaced almost all previous education legislation, belatedly raised the school-leaving age to 15, and made secondary education free and universal. It established the famous three-cornered partnership for education in England and Wales: central government (Ministry of Education), with legal responsibility to set a national framework and allocate adequate resources; local education authorities (LEAs), with knowledge of local needs and responsibility for provision; and teachers with their professional expertise and responsibility for the curriculum. In setting this framework, moreover, the Act consciously sought to address pupils’ personal as well as academic development and the needs of the wider community.

The Act’s date and milestone-ness, though, were also its problems. It was a wartime coalition measure, passed by a Conservative-dominated Parliament, and at no point, therefore, did it engage with the more progressive agendas that had emerged in the inter-war years for, for example, a genuinely unified, national, publicly controlled educational system, a single multilateral, comprehensive/common secondary school, or a school leaving age of 16, rather than 15.  Indeed, the 1943 White Paper was welcomed by some as a Tory project that could divert some attention from the more radical Beveridge Report. It was very different, then, from what a 1946 Education Act might (possibly) have looked like, yet it was treated, even by Labour, as a systemic and at least generational settlement, requiring no more of post-war politicians than possibly some marginal tidying-up.

So whose milestone was it? Received wisdom (received by me, anyway) is that youngish, liberalish Conservative Education minister, R A Butler, skilfully persuaded a reluctant Churchill that legislating for major educational reform in wartime was a good idea – which is at best only part of the story.

First, Butler’s arrival in July 1941 as President of the Board of Education was less the promotion of a rising social reformer than a sideways exit from the Foreign Office of a discredited appeaser. Secondly, much of the Act, including the main decisions about secondary education, was set out in the Board’s ‘Green Book’, Education after the War, produced by civil servants under previous Board President, Herwald Ramsbotham (less German than his first name might suggest). If we sideline the always confusing label ‘policy makers’, it was these Board officials who were the principal authors of what was more a civil service Act than a political one. The role of the chief politician, Butler, was that of indispensable legislative facilitator.

Indispensable because Churchill was not so much reluctant as resistant: opposed to legislation, as a distraction from the ‘War project’, and uninterested in its content, apart from insisting that under no circumstances must it stir up divisions in the country. Butler’s singular achievement, and a huge tribute to his parliamentary and personal skills, was to get the legislative show on the road and, by evading, placating and defusing protest, keep it going through to the end.

At INLOGOV we’re hard-wired to sniff out underlying authoritarianism in any central-local relationship, and there were those who saw the 1944 Act as strengthening central control. Perhaps, but if that really were the framers’ objective, they could, like their 1980s’ and subsequent successors, have gone a heck of a lot further. Nor, surely, would they have created an LEA as powerful and potentially bothersome as the London County Council.

The Minister did have “the duty to secure the effective execution by the local authorities, under his control and direction, of the national policy for providing a varied and comprehensive education service in every area”. But she [the Act used entirely male pronouns, for pupils and the Minister, failing to anticipate the first post-war Minister being Ellen Wilkinson] did not provide and equip schools and colleges or employ teachers; that was the LEAs, the county and county borough councils. She did not set curricula or prescribe textbooks; that, at least until 1988, was the teachers.

The fact that easily the biggest section of the Act (Part II) was that setting out the how the new statutory system would be locally administered by the LEAs means, in itself, little: it might be stuffed full of controls and constraints. That’s not, though, how it reads. Each LEA would have an Education Committee of elected councillors, and would appoint a Chief Education Officer to head the salaried officers of the authority. They sound almost like self-contained mini-empires separate from the rest of the local authority, and often were. The LEAs were to build and maintain the county (state) schools and the one-third of schools provided by voluntary, mostly religious, bodies. They would usually appoint and always pay the teachers. They would allocate resources, including staff, buildings, equipment and materials.

It should be emphasised here that none of the terms and concepts mentioned in my opening paragraphs – 11-plus, selection, tripartite system, grammar schools, secondary moderns – appeared per se in the Act. It did require, however, the provision of opportunities for all pupils “in view of their different ages, abilities and aptitudes, and of the different periods for which they may be expected to remain at school”, and the tripartite system of grammar schools for the most able, secondary moderns for the majority, and secondary technical schools for those with a technical or scientific aptitude, was how it came to be interpreted.

Returning to LEAs, they would not have detailed control of the curriculum but were to “contribute towards the spiritual, moral, mental, and physical development of the community by securing that efficient education … shall be available to meet the needs of the population of their area”. They were to provide sufficient places for 5-15 year olds – and for 16-year olds as soon as the further rise in school-leaving age became ‘practicable’, which proved not to be until 1972. Within this framework, LEAs had and exercised in practice considerable autonomy, developing distinctive styles of administration and forms of school organisation, including the pioneering of comprehensive secondary schools.

The one part of the curriculum that was prescribed in the 1944 Act was religious/faith education, as a crucial part of the settlement negotiated between Butler and the mainly Christian church leaders. Like Tony Blair 60 years later, the authors of the 1944 Act – this time definitely including Butler – took the view that religious education was a public good, whose responsibility should be shared between state-run and religious schools, and they legislated an unevenly balanced ‘dual system’ to accommodate it, apparently indefinitely.

Offered the choice of ‘aided’ or ‘controlled’ status, two-thirds of religious schools opted for the former and one-third – far more than expected by either Butler or the Archbishop of Canterbury – for the somewhat greater LEA control and considerably greater cash.  In exchange, all state schools would provide non-denominational religious education, and each school day would begin with an act of collective worship.

Which brings us to Part III of the Act and Independent Schools.  If only from the point of view of my long passed word limit, it’s perhaps a good thing there was no extended debate over whether these, like religious schools, should somehow be integrated into the state system or simply abolished. In truth, there was no debate at all. The sole demanding imposition of Part III was that they be registered – and registered is what they remain today.

game

Chris Game is a Visiting Lecturer at INLOGOV interested in the politics of local government; local elections, electoral reform and other electoral behaviour; party politics; political leadership and management; member-officer relations; central-local relations; use of consumer and opinion research in local government; the modernisation agenda and the implementation of executive local government.

Who’ll work with the Lib Dems?

Chris Game

One of the few perks of my first paid research job was visiting the major party conferences. This was in the early 1970s, when policies were genuinely debated, votes were taken and mattered, and leaders’ speeches didn’t have to be delivered without visible notes.

I recall particularly Harold Wilson, then Opposition Leader and past his prime, but still, it seemed to me, master in that conference hall of all he surveyed. And still, more than a decade after the man’s death, getting himself an easy ovation by quoting one of Labour Conference’s forever favourite sons, Aneurin Bevan.  One such quote, used by Wilson on probably numerous occasions, was: Why look into the crystal ball when you can consult the book?

I was reminded of it this week in relation, as it happens, to the Lib Dems’ conference. There were two polls last weekend – one of Lib Dem members for the Independent on Sunday, one of Lib Dem councillors for BBC1’s Sunday Politics programme – both showing that the respondents would greatly prefer Labour, the devil they don’t really know, to the one they’re currently in coalition with.

Not exactly new news, and, moreover, entirely crystal ball stuff.  Wouldn’t it be more interesting, rather than speculating about what national politicians might do in the event of a future hung parliament, to read the metaphorical book and see what local politicians have actually done when confronted with hung councils? That’s what the rest of this blog is about.

There are currently more than 50 English hung councils, or more than 1 in 7. In the majority of these (28) there are no formal coalitions, alliances or pacts at all, because they’re run by single parties as minority administrations: 16 Conservative, 7 Labour, 3 Lib Dem (Bath & NE Somerset, Stockport, Cambridge), 1 Green (Brighton & Hove), and 1Independent (Isle of Wight).

One of these – Harrow’s Conservative minority administration – came into existence only this week, but in such exceptional circumstances that, even without any significant Lib Dem involvement, it seems worth a couple of parenthetical paragraphs before continuing with the mostly more mundane happenings recounted in the remainder of the blog.

In one of many noteworthy results buried under the post-General Election headlines in May 2010, Labour, under Bill Stevenson, took majority control of Harrow LBC. Last October, Stephenson stood down due to poor health and was replaced by Thaya Idaikkadar, the UK’s first Sri Lankan council leader. At the Labour group’s AGM in May, however, he lost the group leadership to David Perry, prompting allegations of unfairness and “elements of racism”.

Idaikkadar and 8 other councillors left the Labour Party and formed their own Independent Labour Group, leaving Labour and the Conservatives each with 25 seats. Still Council Leader, Idaikkadar sacked his entire Labour cabinet and created a kind of Independent Labour-Conservative minority coalition, but with the two Conservative cabinet members holding only non-executive posts. This ended last Monday at an extraordinary (in every sense) meeting of the Council, called by the Conservative group and at which, with sufficient Independent Labour support, they elected their own leader, Susan Hall, to head a Conservative minority administration.

These were exceptional events, but in one sense they do reflect the reality and uncertainty behind the formation of any minority administration. Even where the party concerned has the most seats and is close to an overall majority, it’s still a risk, and some sort of at least informal agreement will usually be needed to get the party over the hurdle of the annual meeting, as indicated in my blog following this May’s county council elections.

Warwickshire was one example. The Conservatives had lost their majority control of the 62-member council, but remained the largest party with 26 seats. Labour were up to 22, and there were 9 Lib Dems, 2 Greens and 3 Independents.  The Lib Dems and Greens wanted a multi-party rainbow coalition, but, as regularly happens in local government, Labour preferred to do business with their traditional opponents.

They agreed to abstain in the key vote at the annual meeting, allowed the Conservatives to form a minority administration, and in exchange took control of the scrutiny committees. There were accusations, naturally, of a stitch-up, but no cabinet seats were involved, so Labour could argue that they remain free to work and vote with the smaller parties to defeat any policies they wish to oppose.

A similar informal Conservative-Labour arrangement was negotiated in Gloucestershire, but in Lancashire it was the Conservatives who lost out. Labour had failed to regain their majority control, but with 39 of the 84 seats were the largest party. Sensing a lifeline, the Conservatives (35) tried talking with anyone who might be interested in forming an anti-Labour coalition. But the Independents (3) didn’t want an alliance with anyone, which left the 6 Lib Dems agreeing to support a Labour minority administration, its budget, but not necessarily anything further.

It’s by no means always, though, the largest party that calls the shots, and in arithmetical terms perhaps the most remarkable outcome of the May county elections was in Norfolk. The Conservatives were overwhelmingly the largest party – or should have been, with 40 out of 84 seats – but they were comprehensively outmanoeuvred. While their leader thought he had an agreement with the 9 Lib Dems to enable him to form a minority administration, Labour (14) and the Lib Dems had negotiated a (very) minority coalition of their own, with backing from the 15-strong UKIP group.

Here was one example, then, of the kind of arrangement most Lib Dems say they favour. There are others in Cumbria, in Broxtowe (Notts), where the two parties have a power-sharing history dating back ten years now, and, most recently and with some similarities to Harrow, in Worcester.

While most election-watchers’ attention back in May was on the county elections and in Worcestershire on Labour’s ultimately dashed hopes of winning enough seats to recreate the Lab/Lib Dem pact that had run the council in the 1990s, the heavy action was not in County Hall at all, but in the City Council’s Guildhall, where Labour staged a notable coup.

At 9.00 p.m. on Tuesday 14th May, the 17 Conservatives were running the 35-member council as a minority administration, backed by the 2 Lib Dems. Then by 10.00 p.m. they weren’t, having been dramatically ousted by a coalition of Labour’s 15 members, the single Green, and, yes, those same Lib Dems. They described their turnabout as a carefully considered “change of mind”; the Conservatives pronounced it shameless, unprincipled and considerably worse.

There are two other examples of Lib Dem/Labour partnerships. In Colchester the 26 Lib Dems are very much the lead party, so it is presumably their decision to extend their coalition to include the 3 Highwoods Independents, even though not arithmetically necessary for a majority.

In Stroud, by contrast, every vote in the Labour/LibDem/Green coalition counts. The Conservatives in 2012 were comfortably the largest party on the 51-member council and, with 22 seats, might reasonably have hoped to form a majority alliance with the 5 Lib Dems. However, Labour, though starting from only 16 seats, could and did assemble a similar majority in coalition with the 6 Lib Dems and 5 Greens: trickier but apparently more harmonious.

In all, then, there are 7 current examples of Labour/Lib Dem coalitions, compared to just 4 involving Conservatives and Lib Dems – Lincolnshire, Redbridge, Walsall, and Pendle, in all of which the Lib Dems are the minor partners and generally very much so.  Add in North Devon’s Lib Dem/Independent administration, and it turns out that the Lib Dems (12) are involved in at least slightly more of these formalised local coalitions than either Conservatives (10) or Labour (9).

It is interesting that there seems such minimal enthusiasm in local government to follow the lead of the Conservative and Lib Dem parties at Westminster. As to whether it’s significant, or offers any clues at all to what might happen in 2015, the answer I’m afraid must be a resounding NO.

game

Chris Game is a Visiting Lecturer at INLOGOV interested in the politics of local government; local elections, electoral reform and other electoral behaviour; party politics; political leadership and management; member-officer relations; central-local relations; use of consumer and opinion research in local government; the modernisation agenda and the implementation of executive local government.

Dr Foster’s day out in the sun: the use and abuse of hospital mortality rates

Chris Game

It was an odd happenstance that Dr Foster – a gentleman best known for his rain-ruined, nursery rhyme expedition to Gloucester – should have his proverbial 15 minutes of contemporary news fame in the middle of last week’s heat wave.

The unfortunate doctor, you may recall, went to Gloucester in a shower of rain. Ignoring the truly excruciating rhyme ahead, he stepped in a puddle, right up to his middle, and never went there again.

The news to which this doggerel relates is, of course, allegedly failing hospital trusts, and specifically Hospital Standardised Mortality Ratios (HSMRs) – the widely used measures of hospital death rates developed, publicised, defended and refined by today’s equally fictional Dr Foster.

The doctor and his HSMRs took rather a beating in last week’s report by Prof Sir Bruce Keogh, National Medical Director for the NHS in England: “However tempting it may be, it is clinically meaningless and academically reckless to use such statistical measures to quantify actual numbers of avoidable deaths” (p.5).

Strong words, and justified – because this is precisely what had happened the previous weekend, with numerous media claims that the report would be about 13,000 ‘needless deaths’ at the 14 NHS hospitals selected, because of their high mortality rates, for special investigation. It wasn’t.  The report contained no such numbers, and instead provided detailed, focused recommendations to assist the improvement of the hospitals’ serious but not irremediable problems.

Sir Bruce’s report had been calculatedly hijacked, but who he held chiefly responsible – Ministers and their advisers, the media, even some collusive involvement of Dr F himself – was unclear. The outcome, sadly, was unmistakeably clear. Health Secretary Jeremy Hunt’s parliamentary presentation of the report became a shameful partisan blame-fest – so depressing for so important a topic that, as a completely non-expert observer but low-key Dr Foster fan, I was moved to attack my keyboard.

I remember well my own first encounter with Dr Foster in January 2001.  I was teaching a course here at Birmingham University on policy research methods, and in, of all places, a two-part Sunday Times supplement, there appeared some near-perfect raw material for a student assignment: the first ever listing of standardised ‘death rates’ (HSMRs) for England’s or any other nation’s hospitals.

game

So what, my students discussed, were these ‘metrics’, and what did they really measure?  What did they include, and exclude?  Who’d collected and analysed the data? How did they relate to other possible measures of a hospital’s care and performance? What was the range, and where were the highest and lowest ratios – that ‘Where?’ question providing an additional reason for my recalling that first Dr Foster’s Good Hospital Guide.

A hospital’s Standardised Mortality Ratio is usually presented as a percentage: the recorded deaths in hospital from most (but not all) diseases, as a percentage of the number that would normally be expected, after taking account of, or standardising for, a wide range of factors concerning the patients and the nature and severity of their illnesses.

HSMRs’ other key feature, consistently misunderstood, is that they measure hospitals not against some objective clinical standard, but against each other. An HSMR of 100 is the national average; below 100 means fewer deaths than statistically expected; over 100 means more. Not needless, preventable or avoidable deaths, not deaths from incompetent care, simply more than statistically expected. Even if all hospitals were good, half would still have ratios of 100+ and look ‘bad’ – and vice versa.

The Dr Foster Guides and website emphasise these points scrupulously. A high HSMR should be treated as a warning: a risk, but not proof, of failings in care, and reason for further investigation, with attention focusing mainly on ‘outliers’ – those outside, especially if repeatedly outside, the normal range. University Hospitals Birmingham NHS Foundation Trust’s HSMRs, though consistently over 100, are thus less immediately concerning than the 130+ ratios of Basildon & Thurrock (2005-09) and Mid Staffordshire (2005-07).

However, as Sir Brian Keogh noted, in the dash for political advantage or media headlines, the temptation to elbow aside these literally health warnings is powerful indeed. So, although those first hospital ratios weren’t listed in league table format, they were quickly sorted into one and the range calculated.

It was wide and, although all mortality rates have fallen significantly in the past decade – and, of course, the HSMR baseline adjusted accordingly – it remains so today. Then, University College London Hospitals had the lowest ratio of 68, and most of the low ratios were in London and the South-East. But two of the three highest were on our proverbial doorstep in the West Midlands: Walsall Hospitals Trust with 119 and Sandwell with 117.

My recollection is that these hospitals and trusts, not to mention their patients, had little advance notification of their figures. Certainly, there were widespread protests – by those assuming that, if this was a ‘Good Hospital Guide’, high-ratio hospitals must be ‘bad’. However, despite their susceptibility to such misinterpretation, HSMRs were here to stay. Which begged the obvious question: who was this pioneering but troublesome Dr Foster?

As already indicated, there is no actual Dr Foster. The name was the whimsical invention of two journalists involved in producing the 2001 Sunday Times supplements. But, if there were a real doctor, the only possible candidate is someone you may well have seen recently on your TV screens, Professor Sir Brian Jarman.

A one-time GP who by the 1990s had become a distinguished Imperial College academic, he developed the ‘Jarman Index’ – a formula for distributing government funding to the nation’s hospitals – which gradually evolved into the HSMR, a formula for identifying a hospital’s share of responsibility for its death rates. It was a major statistical advance, but the then Health Secretary was nervous and refused Jarman permission to publish individual hospitals’ HSMRs.

He took his stats, therefore, to two journalists rather more committed to the idea that transparent, debatable research findings and more informed patients had key roles to play in improving health care: the Sunday Times’ Tim Kelsey and the Financial Times’ Roger Taylor. The outcomes were swift and far-reaching: the first of the now annual Dr Foster Good Hospital Guides, and Dr Foster Intelligence – an initially private company that since 2006 has been half-owned by the Department of Health (another controversial development) and is today an internationally renowned provider of healthcare information.

And the drivers of almost all this growth, and indeed of the career progression of the key actors, have been HSMRs – which might surprise some of my 2001 students, who had no difficulty identifying what they saw as potential weaknesses.

Yes, HSMRs are a purely statistical exercise – no visits, inspections, interviews or case notes. Yes, if the indicators in the formula change, so too could the ratios. Yes, they record only in-hospital deaths, and not even all of them. Yes, they surely could be manipulated – by discharging terminally ill patients into hospices or ‘the community’, or (as three West Midlands trusts were later accused of doing) by stretching the ‘admitted for palliative care’ code and thereby raising the expected death rate. And yes, it does seem a rather blunt way of measuring quality of care – or indeed the overall performance of a large hospital.

To their credit, many hospitals’ response to a high HSMR has been to work with the Dr Foster team, to try to understand better the causes and thereby bring the ratio down. Walsall, for example, reduced its HSMR in five successive years, down to 103 by 2005/06.

There have also, though, been continuous criticisms of both HSMR methodology and interpretation – from health care professionals, the media and academia – particularly after 2007, when some of Dr Foster’s statistical ratios contradicted the inspection-based assessments of the Care Quality Commission.

There followed the first Francis Inquiry into the Mid Staffordshire NHS Foundation Trust, and with it the development and official approval of a new, more comprehensive mortality measure – the Summary Hospital-level Mortality Indicator (SHMI) – covering all, instead of most, in-hospital patient deaths, plus those occurring up to 30 days after discharge from hospital.

The two measures sound similar, and frequently they produce broadly similar results, as shown in the 2012 Dr Foster Guide. Birmingham’s HSMR is 112, its SHMI 105; Sandwell & West Birmingham 99 and 97; Coventry & Warwickshire 103 and 107; Walsall 117 and 113; Royal Wolverhampton 100 and 103.

But they can differ significantly – and did for several of the 14 trusts investigated in the Keogh Report. You might think that the Government, having finally found in SHMIs a more comprehensive mortality measure than HSMRs, which most statisticians and clinicians seem to accept as more reliable, would use it to select the hospital trusts it wished to have investigated.

Wrong!  The supposedly failing trusts were picked because of being high ‘outliers’ for two consecutive years (2010/11 and 2011/12) on either of the two measures. So Tameside and Basildon/Thurrock, for example, were included apparently because of their higher than expected SHMIs, but Burton and Sherwood because of higher than expected HSMRs.

We’re into circumstantial evidence here. But, suppose you were a Government keen to rubbish Labour’s NHS record and frighten patients and electors into viewing further privatisation more favourably. It surely wouldn’t seem a bad tactic to maximise the number of allegedly  failing ‘killer’ hospitals – 14 is nearly one in 10 of England’s acute hospital trusts – and feed the media scare stories about thousands of ‘avoidable’ deaths. Or has my imagination run away with me?

game

Chris Game is a Visiting Lecturer at INLOGOV interested in the politics of local government; local elections, electoral reform and other electoral behaviour; party politics; political leadership and management; member-officer relations; central-local relations; use of consumer and opinion research in local government; the modernisation agenda and the implementation of executive local government.