Conservative and Labour council tax claims: both right, and both deceptive

Chris Game

It used to be a toss-up which would come first: the political parties launching their local election campaigns or the letter in The Times claiming its author has heard the first cuckoo of Spring. Sadly, with the cuckoo’s drastically declining population both here and worldwide, it’s the politicians that usually win these days, but perhaps it’s some kind of compensation that they can generally be relied upon to produce some distinctly cuckoo-like behaviour – as in daftness, rather than parasitism.

David Cameron chose Nuneaton in Warwickshire for his launch of the Conservatives’ campaign, which electorally certainly made sense. With the most non-Conservative areas in several traditional counties having become unitaries, Warwickshire is one of the few genuinely marginal counties around, with the Conservatives maybe having the edge in votes, but Labour having run the county council for longer in recent years as a minority administration. Come to the West Midlands in April, though, and you have to confront the Aston Villa relegation issue. Cameron was “sure it’ll be alright in the end”, which in the circumstances, and especially as he was careful not to define “end”, was also not daft. Some of his other views, though, did seem to suggest that he might have just migrated in from Africa.

The Government’s Localism Act had empowered local government, he asserted, so local elections now mattered more than in the past …We’ve given councils much, much more freedom …”. It was the double emphasis that took the biscuit. It must be really, really difficult for most councils, having seen their grant funding slashed year by year, and having just implemented their fourth round of spending cuts to meet budget and tax ceilings effectively dictated by the Government, to identify quite where all this freedom and electoral meaningfulness are hiding.

However, it’s not the function of an INLOGOV blog to engage in partisan knockabout – no, really, it’s not. This one’s serious purpose is to try to inject a bit of factual clarification into what looks like becoming a pretty heated debate about council tax – a little ironically, talking of electoral meaningfulness, when very few of the councils holding elections are actually billing authorities.

In neighbouring Worcestershire, for instance, should electors in Bromsgrove and Malvern Hills vote as if to punish their tax-collecting Conservative councils for rejecting Cameron and Pickles’ “clear moral imperative” to freeze their council taxes for the sake of “hard-working families and pensioners”? That presumably would be a demonstration that local elections mattered. Or should they reward Conservative Worcestershire for taking the Government’s one-off grant (equivalent to a one per cent rise in council tax) and freezing the much bigger portion of their tax bill?

It’s a definite complication for the Conservatives, who would have liked to be able to contrast phalanxes of blue councils, which had obediently taken the grant and frozen their tax bills for a further year, with loads of red and orange/yellow ones that had ignored their “moral imperative” and increased theirs. There was no lack of ministerial arm-twisting (proverbial, I presume) and other threats and pressures to which Conservative council leaders were subjected, but at the end of the day, as the Sunday Telegraph was one of the first to document, the figures just didn’t turn out right.

In a mid-March survey of all 353 English councils, the Telegraph found first that a total of 124, or more than a third, were increasing their council tax bills as a way of raising revenue. Secondly, more than half of these offending councils (64) were Conservative – that’s more than one in three of those the party currently controls. Some, moreover – as can be confirmed in a more recent House of Commons briefing paper (Appendix 7) – were seriously big and embarrassing names.

The three tax-raising counties were almost bound to be Conservative, and indeed are – Cambridgeshire, Surrey, and a particularly interesting A N Other. The six London boroughs were more mixed. There were 2 of Labour’s 18 – Lewisham and Harrow; 1 of the Lib Dems’ 2 – Kingston-upon-Thames; and 3 of the Conservatives’ 11 – Bromley, Croydon, and, with the biggest increase of all at over 3%, Wandsworth. As for A N Other, the Sunday Telegraph seemed almost salivatingly pleased to note that the Tory miscreants “included Oxfordshire County Council, which is David Cameron’s local authority, and Runnymede Council in the constituency of Philip Hammond, the Defence Secretary.”

None of this, of course, is going to stop the Conservatives exhorting us in virtually every campaign speech to vote Conservative for lower council taxes. But listen carefully to what they actually say, like Cameron himself on Friday: “On average, on a Band D bill, Conservative councils continue to charge lower levels of council taxes than Labour or Lib Dems.” And it’s perfectly true. It generally is. And, unless you stop and think about it for a few moments longer than most voters are probably likely to give it, it’s seriously misleading.

As, in a very similar way, is Labour’s counter-claim that we should vote for them, because, to quote Hilary Benn, Shadow Secretary for Communities and Local Government, from last year’s election campaign and no doubt from this year’s as well: “Households in Labour-controlled authorities pay on average less council tax per year than those in Tory and Lib Dem areas”.

Note the small, but hugely significant, difference: Conservatives: average Band D; Labour: average per household/dwelling. If I were preparing students for an exam, I might suggest they use a mnemonic – say, Bullingdon and Downing Street for Band D – but I’d also try to get them to think it through, because it’s really not brain-hurting stuff.

The tax base for council tax is a ratio system based on 8 valuation bands, centred around Band D (properties valued, in 1991, at ₤68,000 to ₤88,000). Band A properties (under ₤40,000) pay 6/9 (2/3) of Band D; Band B 7/9, and so on up to Band H (over ₤320,000) paying 18/9 (2x) of Band D. Councils calculate their tax base by weighting the number of dwellings in each band to Band D, and report their budget headlines in terms of ‘Council tax for council services (Band D)’.

Band D has thus become a benchmark for comparative purposes, and it is perfectly reasonable for the Conservatives to use it – reasonable but disingenuous. Not so much because only a small minority of properties (15% in England) are actually in Band D, but because, exacerbated by the absence of any revaluation since 1991, the mix of property bands across authorities and regions nowadays varies starkly. In my own authority of Birmingham 66% of properties are in Bands A and B, and just 8% in E to H combined. Neighbouring Solihull has 29% in Bands A and B, and also 29% in E to H. In the North East there are 55% Band As, in the South East 9%, in London 3.6%.

All of which obviously means that, to raise any particular sum of money in an authority with mainly Band A to C properties requires a higher Band D tax than in one comprising many E to H properties. The average bills paid per household will vary similarly – being generally higher than the Band D figure in more affluent and Conservative-inclined areas, and lower in less affluent or Labour-inclined ones. Hence Labour’s equally disingenuous preference for average tax bill figures. Two contrasting Inner London boroughs provide an illustration. Kensington and Chelsea: Band D – £1,086; average tax per dwelling – £1,190; Tower Hamlets: Band D – £1,189; average tax per dwelling – £787.

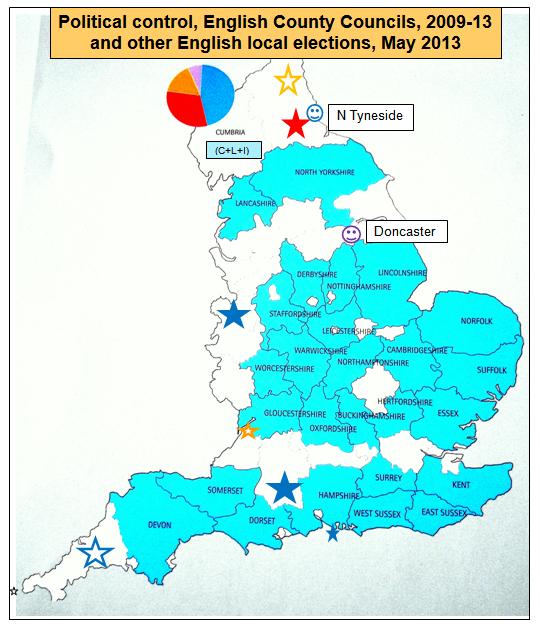
The parties have been playing this rather irritating game seemingly forever, and at one time it fell to party researchers or friendly academics to have to ascertain councils’ political control, decide whether it had been long enough to influence budgetary and tax policy, and produce the necessary statistics. In recent years, possibly irritated at hearing the same arguments repeated year after year, the estimable House of Commons Library staff (and notably Matthew Keep) have taken over, and a table on page 9 of the research briefing referred to above and reproduced here enable us, and, if they choose, MPs to compare the figures for ourselves.

game table apr 22

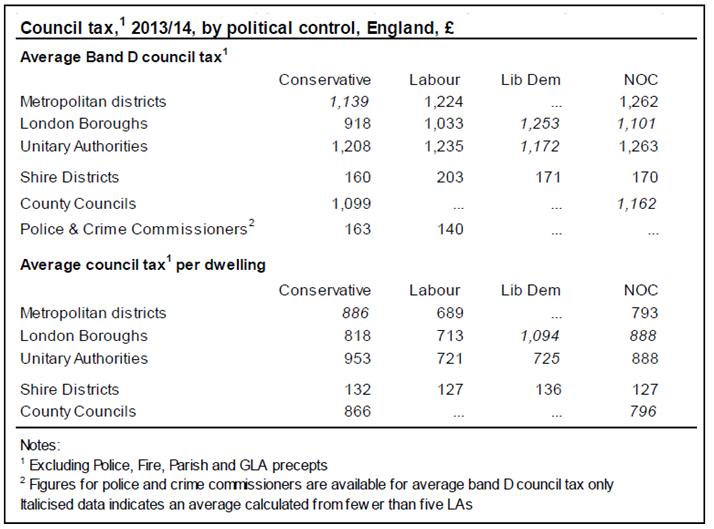
They show that, in all comparisons in which more than 5 authorities are involved, the average band D council tax is lower in Conservative-controlled authorities than in those controlled by Labour, the single exception being Police and Crime Commissioners, where the lower levels were set by Labour. But in all cases the average council tax per dwelling is lower in Labour-controlled authorities. It’s difficult to say just what, if anything, this proves, but it surely means that we need hear no more of these particular claims. In your dreams!

game

Chris is a Visiting Lecturer at INLOGOV interested in the politics of local government; local elections, electoral reform and other electoral behaviour; party politics; political leadership and management; member-officer relations; central-local relations; use of consumer and opinion research in local government; the modernisation agenda and the implementation of executive local government.

The 2013 local elections – a preview and protest

Over the next two weeks, the INLOGOV blog will be featuring a range of posts related to the local elections. Check the blog regularly for all the expert commentary, and follow us on Twitter to stay up to date.

Chris Game

There’s a view – shared by, among others, the Electoral Commission, the members of the 2007 Councillors Commission, and me – that voters’ lives would be easier and their turnout at least a smidgeon higher, if the 4-year cycle of local elections were uniform across the whole of England, and based on all-out or ‘whole council’ elections for all councils being held on the same ‘Local Elections Day’ (LED).

There could be one LED either every four years, or, if it were felt preferable, every other year: with LED1 being for voters to elect members of their ‘most immediate’ councils – districts, unitaries, London and metropolitan boroughs – and LED2 for those in two-tier areas to elect their county councils and the London Assembly. Neither LED would coincide and be forced to share the stage with a General or European Parliament election.

There would be several benefits. The election campaign, both by the political parties and in the media, would have to give greater attention than at present to local government issues and the performance of local councils and councillors, which should in turn raise the public’s awareness and understanding, and in some their inclination to vote.

Just as importantly, all voters in the same type of local authority would have the same number of opportunities to elect their councillors, and, even if they chose not to use those votes, they’d at least know each year whether they had a vote not to use. At present, voters in a district that elects its council by thirds, with elections in three years out of four, can have three times the number of voting opportunities as those in a neighbouring district with all-out elections. There seems, to me at least, something seriously unbalanced about a system of local democracy in which ministers think uniform frequency should apply to bin collection but not to voting opportunity.

End of protest (well, nearly), and time to look at what will be happening where on Thursday 2nd May. For this is the first in a short series of blogs by INLOGOV colleagues over the next fortnight or so on different aspects of this year’s local elections, and so will endeavour to set the scene. Which, in truth, really shouldn’t take that long, because there can rarely have been a local election year involving fewer local authorities.

Indeed, it takes almost as long to explain why this is, but, since it illustrates my case about the system’s pointless complexity, I’m afraid I’m going to – though I’ll let you off with England only. It has to do with the (usually) 4-year election cycles referred to above, in which 2009, 2013 and 2017 can be seen as the 4th years. In Year 1 – 2010, 2014 – we have elections for the met boroughs, who have to elect their councils by thirds; for the roughly one-third of unitary and shire district councils who have chosen to; for the London boroughs, who are required to have all-out elections; plus a few elected mayors. About 160 authorities involved in total.

Year 2 – 2011, 2015 – is the big year, when the national media have a better excuse than usual for pretending that local government is staging a mini-General Election for their benefit. We have the mets, all districts (even those choosing all-out elections can’t choose the year), most but not all unitaries (don’t ask – I told you it was designed to baffle), and a few more mayors. About 280 authorities in all. Year 3 should be a near-repeat of Year 1, with Londoners electing the Mayor and Assembly, instead of borough councils, plus, from 2016 and assuming they still exist, Police and Crime Commissioners.

And so we come to this year, Year 4, in which we have just the 27 remaining county councils, a few all-out unitaries, a couple of mayors, and a stray from Wales. And that’s it – not just in England, but in the whole UK. Which sounds as if it might represent something of a let-off for any party struggling in the opinion polls – but in this case it almost certainly doesn’t.

Although I do have, I promise you, several more artistic offerings on my office walls, on the door there hangs – courtesy of the Local Government Chronicle and the incomparable local elections experts, Professors Rallings and Thrasher – a poster mapping the political control of all GB councils. An inset map on the poster focuses solely on the county councils, and it seemed a good place to start.

game map apr 13

Ignoring the added symbols for the moment, this potentially multi-coloured map comprised, when it was produced at the start of the current political year, just the one colour – blue for Conservative majority control – and some white spaces. The latter, moreover, actually dilute the true extent of one-party domination among these big, upper-tier councils which, it should be remembered, are responsible for roughly 90% of local government revenue spending in their respective areas, compared to the 10% contributed by the 201 lower-tier districts. For, with one exception, the apparently blank spaces are not non-Conservative controlled counties, but single-tier metropolitan and unitary authorities. That exception, the one county where in May 2009 the Conservatives didn’t take majority control, is Cumbria, where they are comfortably the largest party but lead an interesting power-sharing administration of Conservatives, Labour and an Independent, with the Lib Dems in official opposition.

There is in fact now a second exception in Derbyshire. Labour-dominated since 1981, it was numerically the Conservatives’ narrowest capture in 2009, with 33 of the council’s 64 seats. In the past few months, though, they have lost that overall majority, with one councillor having to resign for unsavoury personal reasons and another switching allegiance to the UK Independence Party (UKIP). Not the best position from which to enter what was always bound to be an uphill battle to retain control.

Those 2009 elections took place when Labour’s standing nationally was about as low as it could get. The Government was in disarray, there were leadership plots against Gordon Brown, some ministers were in trouble over their expenses, others were resigning like proverbial rats from an apparently sinking ship – and that was in the week before the elections. In the pre-election opinion polls the Conservatives were 16 points ahead: 39% to Labour’s 23% and the Lib Dems’ 19%. As they generally do, the election results reflected the polls, and the Conservatives, already the dominant party in this tier of local government, gained blanket control by taking Derbyshire, Lancashire, Nottinghamshire and Staffordshire from Labour, Warwickshire from Labour minority control, and Devon and Somerset from the Lib Dems.

Today, the voting intention opinion polls are not quite as bad for the Conservatives as they were in 2009 for Labour, but they’re hardly encouraging. They show the Conservatives trailing Labour by about 11 points, with 30% to 41%, while their Lib Dem coalition partners are battling it out with UKIP on around 12%. I’ll be looking in more detail in a later blog at what these national standings and other considerations signal for actual changes in control among the counties, but I want to conclude this preview by mentioning the other elections that are taking place.

The added stars on the map identify the 8 unitary authorities holding elections. Five are from the most recent generation of unitaries and were until 2009 upper-tier county councils in the two-tier part of the structure. Their extraordinary scale – for what is the supposedly ‘local’ government in their areas – earns them the biggest stars on the map. Two – Shropshire and Wiltshire – are currently solidly blue for majority Conservative control, and Durham is equally solidly Labour. Labour also controlled neighbouring Northumberland for its last ten years as a county council, and must hope at least to regain its position as largest party and end the present minority Lib Dem administration. Cornwall’s last years as a county council were spent under majority Lib Dem control, but the Conservatives now lead a coalition administration with the Independents and may have their sights set on the overall majority that they’ve never so far achieved.

The Isle of Wight was also a county council until 1995 and also in its final years controlled by the Lib Dems. The party today, though, is reduced to just four councillors, and it is the Conservatives who have a majority. Bristol, even by UK standards, is an electoral oddity. The Council voted recently – to the relief of pretty well all concerned – to switch from election by thirds to all-out elections, coinciding with the election of the city’s mayor. But not, sadly, until 2016, which means that, for barely comprehensible reasons, it is the single authority this year to be electing only a third of its council. This necessarily restricts the scope for change, but there could still be sufficient for the Lib Dems to lose their minority control and for Labour to regain its position as largest single party.

All of which leaves just the odds and sods. The smiley faces on the map are the two elected mayors hoping for re-election, and there will be more about them in the next blog. The Welsh elections are for a new Isle of Anglesey council – postponed from last year, following a period in which the former council had to be replaced by appointed commissioners and a programme of recovery and democratic renewal undertaken.

And the barely visible little star off the coast of Cornwall is, of course, the Isles of Scilly. The 21-member, entirely Independent, council can legitimately claim to provide a range of services not just equivalent to but, as a surviving water and sewage authority, greater than that of any mainland unitary authority. They’re not, strictly speaking, a unitary, but they’re counted as one by the Office for National Statistics, and on St Mary’s at least, if not perhaps on all the ‘Off Islands’, they too will be voting on 2nd May.

game

Chris is a Visiting Lecturer at INLOGOV interested in the politics of local government; local elections, electoral reform and other electoral behaviour; party politics; political leadership and management; member-officer relations; central-local relations; use of consumer and opinion research in local government; the modernisation agenda and the implementation of executive local government.

Localisation of the Discretionary Social Fund – from cash loans to food stamps and Asda cards

Chris Game

Two recent Japanese visitors to INLOGOV included among their ‘etiquette gifts’ a set of Furusato or prefecture stamps – postage stamps produced to promote local government in, in this case, Hyogo, one of the 47 prefectures that are the equivalent of our counties. The stamps are attractive and easy to admire, and we inevitably wondered out loud how much Birmingham – or even the West Midlands region, whose 5.6 million population is similar to Hyogo’s – might pay for a similar PO issue .

Not out loud, I also wondered about mentioning that by coincidence some of our local authorities too would shortly be launching their own sets of stamps. But, with these being not pretty promotional ones, but wartime-echoing food stamps, I decided against it. But I will do here.

So many welfare and tax changes are being introduced at the start of this financial year that, apart obviously from planning how to spend the 5% tax cut on our £150,000+ incomes, it’s genuinely hard to keep track of them all. Almost all the changes, moreover, are controversial, which probably partly explains why the abolition or localisation of much of the Discretionary Social Fund (DSF) – a vital but admittedly small part of the total welfare system – has received less, and less critical, attention than it should have done.

The Social Fund was set up in the 1980s, to provide interest-free loans and grants through both a regulated scheme and a cash-limited discretionary scheme. There are four regulated fund payments: cold weather, winter fuel and funeral payments, and Sure Start maternity grants. These will continue, and the Social Fund itself, therefore, is not being abolished.

The discretionary scheme is intended to be the final welfare safety net – the safety net’s safety net, as it were – and it comprises three distinct elements. Budgeting Loans, the largest element, are interest-free loans for people on benefits who have difficulty managing intermittent expenses such as the replacement of white goods and household items, and who might otherwise turn to loan sharks.

Community Care Grants are non-repayable grants, conditional on receipt of income-related benefit, and intended to help vulnerable people – young people leaving a children’s home or foster care, women fleeing from domestic violence – to return to or remain in the community, or to ease exceptional pressure following a family breakdown or other emergency.

Crisis Loans are modest, interest-free loans available to anyone, whether on benefit or not. Applicants must show that, following an unforeseen emergency or disaster, they or their family cannot meet immediate short-term needs and would otherwise face serious risk to their health or safety. Loans, already being ‘managed back’ to pre-2006 levels, before telephone claims were introduced, are restricted to what are defined as essential items.

All three elements will now change, but in different ways. Budgeting Loans will become Budgeting Advances, provided as now by the Department for Work and Pensions (DWP), and, for those eligible, will gradually be incorporated into Universal Credit. It’s the other two – Community Care Grants and Crisis Loans – that particularly concern us here, for it is these that are actually being abolished, with funding being made available to English local authorities (and the devolved administrations in Scotland and Wales) to enable them to provide new locally-administered assistance to vulnerable groups, under existing powers.

Mark those last three words. They may sound harmless, but they’re crucial. They mean that councils have no new statutory duty to provide any specific form of support, for some of the poorest and most marginalised members of our society, out of funding that is not ‘ring-fenced’, and at a time when their diminishing resources are already under the acutest pressure.

Ministerial guidance to councils is expressed in questionable English, but impeccably localist rhetoric. “The Government has decided it would not be appropriate to place a new duty on local authorities in respect of the new provision you are planning. You need to be able to flex the provision in a way that is suitable and appropriate to meet the needs of your local communities.”

Even Ministers, though, acknowledge that it’s much more about savings than about ‘flexing provision’: “It will mean that individuals will have to take more responsibility in managing their own finances and plan for their future, rather than building up benefit debts they can ill afford.” You local councils, in other words, must be even tougher that we in central government have been. And, by the way, we no longer accept any responsibility for this ultimate safety net of our supposedly national welfare system.

It’s similar to what’s happening with Council Tax Benefit: systems run till now by the DWP being transferred to local authorities, but with significant reductions in funding and minimal preparation time. In both cases, localisation is a good principle which in time should provide more efficient, more responsive and more integrated services for local residents. But here in Birmingham, for example, the Council has been expected to devise and launch a scheme of ‘back-stop’ local welfare provision, with all its attendant criteria and considerations – eligibility rules, forms of assistance, degrees of discretion, advice to unsuccessful applicants, appeals procedures, and, of course, action if or when the money runs out – with ‘start-up’ funding of just over ₤60,000.

Naturally, councils have been ‘flexing’ their own schemes and coming up with differing solutions.  Some will issue charity food parcels; others plan to give cash grants to food banks to enable them to employ full-time staff and extend opening hours. A minority will continue the practice of cash payments for specified emergency items, or maybe low-interest (rather than interest-free) loans with local credit unions. It’s clear, though, that most have opted, more or less reluctantly, for what generically seem likely to become known as ‘food stamps’: not cash loans, but one-off vouchers redeemable for a list of approved goods, such as food and nappies.

Birmingham’s Labour council has negotiated its own, to date unique, form of voucher scheme, outlined in its publication – Local Welfare Provision (LWP): What is happening in Birmingham from April 2013?  The ‘provision’ is described initially in terms of ‘awards’ and ‘grants’, but by page 3 it becomes clear, in the boldest type, that one big thing that’s happening is that “There will be no cash alternative as part of the LWP scheme”. What there will be, for successful applicants “in crisis”, are pre-paid Asda cards, enabling the purchase of emergency food and essentials – as opposed to, although they’re not actually mentioned, tobacco, alcohol, phone-related items, and other undesirables.

Quite apart from the inflexibility and inconvenience of prepaid cards, and the almost predictable technical teething problems, there are obviously some pretty hefty principles involved in this cash-to-cards switch – enough indeed to justify a blog in their own right. As refugee support agencies and human rights organisations have argued over the years, they’re potentially humiliating, stigmatising, socially marginalising, and ultimately infantilising.

And yet (you can probably guess what’s coming next) it’s the so far exclusive deal with Asda – scarcely involving a genuine point of principle at all – that has attracted all the media attention and a public ‘clarification’ by the Council, who say they’re also in negotiation with a wide range of other retailers. We shall see, but my personal bet is that, unless they sign up a good few others pdq, they’ll acquire, and find it very difficult to lose, the adhesive tag of ‘the Asda council’ – the one consolation being that they won’t need to spend too much on publicising the scheme.

Note: Earlier (and longer) version of this article posted by our fine colleagues at The Chamberlain Files.


game

Chris is a Visiting Lecturer at INLOGOV interested in the politics of local government; local elections, electoral reform and other electoral behaviour; party politics; political leadership and management; member-officer relations; central-local relations; use of consumer and opinion research in local government; the modernisation agenda and the implementation of executive local government.

Street names – Mid Devon fails Birmingham’s comma sense test

Chris Game

Mid Devon District Council has just had to reprint and re-issue tens of thousands of council tax demands, after sending the majority of its taxpayers bills for up to £5 more than they were due to pay.  A hapless council officer had miscalculated the parish precept part of the bills, thereby costing the council an estimated £12,000 in re-billing charges.

A pretty big deal, you might think – one that would surely top the agenda at this week’s cabinet meeting.  But you’d be wrong. Sure, folks are annoyed and the Council’s taken some flak, but the annoyance and flak over this expensive and embarrassing boo-boo are NOTHING compared with the literally global outcry prompted by the Council’s announcement that it was planning to formalise its street naming guidelines by, among other things, avoiding in new street names and signs “all punctuation, including apostrophes”.

Yes, I’m fully aware we’re approaching April 1st, but I promise you, this is serious stuff. The professionals, or obsessionals, set the pace. The Apostrophe Protection Society thought it “appalling, disgusting, pointless”. The Plain English Society was less hesitant, and in very plain English wondered, after the “murder” of the apostrophe, “where’s it going to stop? Are we going to declare war on commas, outlaw full stops?”

Then the locals leapt in – the obligatory quote from the Exeter University Eng lit lecturer; a tweet from Exeter MP and former Culture Secretary, Ben Bradshaw, who, if encouraged, would tweet about his breakfast; and the local politician, with a beautifully crafted own goal. The Mayor of Tiverton Town Council, possibly still peeved by the fact that, when first invented in 1974, the meaningless ‘Mid Devon’ was in fact Tiverton District, thought “it’s ridiculous just to remove them” (they weren’t; the proposal was for new street names only). “If for example Blundell’s Road belongs to Blundell then it should have an apostrophe.”

Precisely. And, if it no longer does, then presumably it shouldn’t. Blundell’s Road and Avenue in Tiverton are two of only about four currently apostrophised street names in the whole Mid Devon district. They are named after the extremely rich 16th Century merchant, Peter Blundell, but probably never actually belonged to him, and certainly don’t today. Game and set, one would think, to the Mid Devon reformers, but sadly, as we shall see, not the match.

By now, any Birmingham readers will have recalled that we went through all this sound and fury back in 2009, when the City Council similarly decided to formalise what had become conventional practice and remove all apostrophes from those place and street names that still, sometimes and arbitrarily, retained them. The author of the policy was a Lib Dem councillor for Moseley and Kings Heath ward and Chair of the Transportation Scrutiny Committee, Martin Mullaney.

Mullaney’s initial concern was to get a ruling on Kings Heath and Kings Norton, which wasn’t easy. The Gazetteer of British Place Names, for example, refuses even to recognise any such place name without a possessive apostrophe, if there’s any chance at all that it might once have warranted one. So Acock’s Green (another Birmingham ward) remains apparently the possession of one member of the Acock family, Druid’s Heath (in the same South Birmingham area) the playground of a single druid, and King’s Heath and King’s Norton are treated as if they were still part of the property portfolio of a monarch who flogged them off more than two centuries ago.

To any right-thinking person this is barmy, and thankfully the City Council had long recognised it as such.  Some decades previously, it had followed the lead of the Americans (of course) and several other English-speaking countries and dropped the possessive apostrophe completely from Birmingham place names – though more in the interests of convenience and economy than of improving historical or grammatical logic.

And to me, convenience or what one might call comma sense, are the key points in this particular debate. On the whole, I’m pretty keen on using punctuation properly and observing its rules. I don’t want, as the Plain English Campaign puts it, to “murder” the apostrophe, or any other punctuation mark. I’ve no wish to be rid of it altogether, even though it’s often more trouble than it’s worth (despite the potential confusion between it’s and its, you’d still understand this sentence, even if I’d left out all six apostrophes), and in the real world is on its way out anyway. It’s the possessive pronoun in names and signs, not its ‘omission’ purpose of signalling missing letters, that I’d do away with.

We know from linguistic historians that the apostrophe’s use to signify possession, as opposed to indicating letters omitted, is a punctuation oddball – a latecomer, essentially in the 19th Century, owing more to printers than grammarians, with rules that are never clear cut and frequently unknowable. Why, to pick just one example, no apostrophe with possessive pronouns – hers, his, yours, ours, its – but with the possessive of some indefinite pronouns – one’s, anyone’s, somebody’s?

When it comes to names, if, in order to use the apostrophe correctly, you need to research the life history of the person or place (as with Tiverton’s Peter Blundell), or know the chosen corporate preference of the company, then you’re better off without it. I think it was Queens College that decided me. As an academic, I happen to know that it’s The Queen’s College, Oxford and Queens’ College, Cambridge. And the reason – come on, pay attention there! – is that the former was founded in honour of one Queen (Philippa of Hainault – the then French one, not the East London one), while the latter commemorates the two Queens of Henry VI and Edward IV. Yes, I’m not certain even Michael Caine knows that.

Companies, sports stadia and the like are even trickier. If you’re pro-apostrophe, you’ve got Sainsbury’s with you and Morrisons against you; Blackwell’s with you, Foyles and, since last year, Waterstones against; McDonald’s for, Harrods, Selfridges and Starbucks against; Lord’s (cricket ground) for, Ladbrokes against; St Andrew’s (Birmingham City) and St James’ Park (Newcastle) for, St James Park (Exeter) against.

Which brings us back to Birmingham.  In 2009 the Council attracted just the same OTT outrage and ridicule as Mid Devon has. Councillor Mullaney got himself on New Zealand television, and similarly Mid Devon has been reported and mocked by the Belfast Telegraph, the Canberra Times and Newstrack India. The big difference has been that, whereas Councillor Mullaney and Birmingham City Council stood their ground, went ahead and abolished, their Mid Devon counterparts have rather pathetically caved in.

The Council’s Conservative Leader, hyphenated Peter Hare-Scott, having reviewed the situation, decided against taking on the out-of-town punctuation fascists, and, when Agenda Item 4(c): Street Naming and Numbering comes up, will recommend that the Cabinet “amend the policy so that street names may in future have apostrophes”. Eric Pickles for one will be pleased. A spokesman from the Department for Communities and Local Government said: “Whilst this is ultimately a matter for the local council, ministers’ view is that England’s apostrophes should be cherished.”  Their view of Conservative-led councils who cost their hard-working taxpayers money by miscalculating their council tax demands isn’t recorded

Note: A version of this blog post appeared previously on TheChamberlainFiles.com

game

Chris is a Visiting Lecturer at INLOGOV interested in the politics of local government; local elections, electoral reform and other electoral behaviour; party politics; political leadership and management; member-officer relations; central-local relations; use of consumer and opinion research in local government; the modernisation agenda and the implementation of executive local government.

The Budget Red Book – the small print containing local government’s big headlines

Chris Game

I do love Wikipedia. It being Budget Week, I thought I’d check out what it had to say about the Red Book, as the documented version of the Chancellor’s Financial Statement and Budget Report is generally known among those to whom these things matter. As ever, it had plenty – almost 50 separate entries.

I skipped the music – Bacharach and David’s (and Manfred Mann’s) ‘My Little Red Book’; also Mao’s pocketbook of catchy quotations, Monty Python’s Big Red Book, and the notorious 1969 Danish-originated and UK-prosecuted Little Red School Book of practical advice to young people on how to do sex and drugs. ‘Reference manuals’ seemed more promising, and there are Red Books aplenty on landscape gardens, fire-service training, paediatric infectious diseases, and much else besides. But no mention of the UK Treasury, nor indeed of the Bank of England’s entirely separate ‘Red Book’, its money market manual with which the Treasury’s publication is occasionally confused.  So, characteristically entertaining, Wiki, but this time, no cigar!

The Red Book I was after – Budget 2013, to give it its official title – is where you go to check exactly what the Chancellor said, or meant, and the story and statistics underpinning it all.   It’s obviously primarily about the national economy, and much of it is beyond me, or at least beyond my interest. But this year I reckon there are two or three items that between them constitute the 120-point headlines for local government over the coming few years.

First, not exactly a headline, but an updated and always useful reminder for those of us seeking to educate people about the realities of UK local government: that, of every £1 we pay in tax, over 95% goes to the central Exchequer, and less than 5p or 5% to our local councils – compared to between 12% and 18% in France, Italy and Austria, and between 20% and 32% in Finland, Denmark, Spain, Germany and Sweden.

Gamefig1

In fact, the figures in the chart on p.6 of the Red Book show that Eric Pickles’ largely effective attempts to freeze council tax have reduced its contribution to total government receipts from a figure that in 2010-11 rounded up to 5% to today’s just 4.4%. This, however, is about as low as it’s likely to go, as the inflation calculations of the Office for Budget Responsibility (OBR) are assuming a 2% annual increase in council tax from next year, no matter how much Mr P or his successors may protest.

All that means, though, is that ‘locally financed current expenditure’ will constitute a fractionally higher proportion of a steadily, and increasingly alarmingly, falling total. The immediate and upfront task of the Budget was to ‘fix the envelope’ for total government spending for 2015-16, prior to the publication of individual departmental budgets in June. But for local government I’d suggest this Budget’s real headlines are embedded in the Government’s updated assumptions beyond 2015-16:

“In line with previous policy, this Budget sets a fiscal assumption that TME [Total    Managed Expenditure] in 2016-17 and 2017-18 will continue to fall in real terms at               the same rate as over the Spending Review 2010 period.” (para. 1.59)

So, more of the same, for longer than we were fearing – it’s hardly good news, but alarming?  Certainly, there’s no alarmism in the explanatory Red Book text, but that’s because the actual figures, and particularly those for 2017-18, are revealed only in the supplementary tables at the end. The key lines are in Table B.4 on p.103, and I’m afraid they probably require – at least for those readers a bit hazy about the precise meaning of ‘PSCE in RDEL’ – an embarrassingly over-simplified introduction to some of the jargon used by Resource Accountants and Budget wallahs.

GameFig2

Public Sector Current Expenditure (PSCE) is divided into two categories, according to the degree to which it is controllable within three-year spending cycles by the Government departments responsible for it. For their supposedly controllable expenditure, departments must account to the Treasury against Departmental Expenditure Limits (DELs), the Resource DEL (RDEL) being current expenditure – pay, running costs – and also some non-cash items, like depreciation.

Departments are also responsible, though, for Annually Managed Expenditure (AME) – demand-led spending, like social security benefits, tax credits, central government debt interest, and, of course, locally-financed council spending – for which departments can’t be held accountable in the same way, and which therefore doesn’t form part of their DELs or of Spending Review settlements.

You can see immediately what’s been going on, and will continue to go on, and to an escalating degree, well into the next Parliament.  TME will carry on rising annually in cash (though not in real) terms, solely through the AME expenditures that the Government can’t actually stop, while RDELs take all the hits – down by £3.6 billion in 2014-15, then a further £3.1 billion in 2015-16, £6.8 billion in 2016-17, and £8.3 billion in 2017-18.

Dramatic as these figures are, they don’t in themselves capture the suddenness and severity of the U-turn forced upon this controlled element of public expenditure since 2010-11. For that you need a graph, of the kind produced by the Institute for Fiscal Studies (IFS) in one of their admirable post-Budget analyses.

GAMEFIG3

In the words of the IFS’ own summary (p.11): “Departmental spending [is] forecast to be cut by more than 18% in real terms from its 2010-11 level by 2017-18 – [that is] back to around 2002-03 level of real spending and pre-1998 level as % of national income”.

We’re still, though, talking about all departmental current spending – and in the present context misleadingly, for since the 2010 Spending Review several major expenditure heads have been and will continue to be either frozen or ‘protected’: notably, Overseas Development Assistance, ‘front-line’ NHS spending, plus spending on schools, 16-19 participation, and Sure Start. The impact of this service apartheid on what finance expert, Tony Travers, calls “the unloved and unprotected” – local government, defence, the police, fire, transport, business services – made itself felt immediately, and has been modelled through to 2017-18 in another IFS analysis.

We are looking at a real terms drop in total RDEL spending between 2010-11 and 2017-18 of 16.9%. Within that figure, though, spending on the NHS would have increased by 2.9%, on schools by 0.6%, and on the albeit modest-sized aid budget by 41.7% – while that on the unprotected remainder would have fallen by 31.5% (p.12). Local government from the outset has been among the most “unloved and unprotected” and, as Travers notes, “if capital spending becomes a greater priority, the impact on revenue spending within the unprotected part of DEL will be greater still. It now seems likely that local government … will face a real terms reduction of at least 50 per cent in expenditure over the period to 2017-18” – .

With figures like these, there is no need to speculate about the consequences of the Chancellor’s economic growth projections proving once again to be overly optimistic. Even if they’re right, the unavoidable truth is that local government as a sector and (remaining) local councils individually will be organised and will operate in fundamentally different ways from in the past, and, while there wasn’t a great deal in the Budget to cheer about, there were perhaps, again tucked away in the Red Book, some more positive headlines of what those different ways of operating might look like.

In, as it happens, the paragraph (1.58) immediately preceding the one about the Government’s fiscal assumptions beyond 2015-16, we read about the need for “ongoing reform of public services”:

“The four areas that participated in the recent Whole Place Community Budget pilots   estimate that they can save £800 million over five years by implementing their plans. To support the local adoption of similar approaches, the Government is establishing a new multi-agency network and will announce plans to extend the benefits of this approach across the country at the 2015-16 Spending Round.”

Oh dear! That £800 million: so big, so rounded, so headlineable – and so suspect.  Sometimes, fierce competition though there is, the Government’s own worst enemy can be itself. The figure appears to come from – though I’m fairly sure doesn’t actually appear in – the National Audit Office (NAO) review of the four Whole-Place Community Budget pilots that had been published the previous week. The report, as would be expected from the NAO, is a good one: thorough, insightful, critical, cautious, and constructive – but not shouty.

In Budget Week, however, the Government decided it needed shouty, so out came the Arthur Daley pocket calculator and added together the four areas’ estimates of potential savings – savings defined in different ways, reflecting different projects and activities, across different service areas, over different time periods (Westminster, Kensington & Chelsea – 1 year; Greater Manchester, and Cheshire West & Chester – 5 years; ‘Whole Essex’ – 6 years), and with differing degrees of assuredness. Total: £810 million; round down for luck, and you have your £800 million.

Normally, you’d run a mile from something so patently tacky, but there are two big considerations here. First, the indications are that this Government is rather more committed, at least at present, to the Whole-Place Community Budget approach than its predecessors were to similar earlier initiatives – local and multi-area agreements, Total Place, etc.  In apparent confirmation of that commitment, a letter has already gone out from Local Government Minister, Brandon Lewis, asking councils to submit expressions of interest to join the new multi-agency network to share learning from the existing four Community Budget pilots.

This letter more or less coincided with an estimate from Ernst & Young that the community budget approach to pooling budgets in a local area and working across public agencies could save up to £20.6 billion over the next five years. Another magic figure perhaps, but it brings us to the second big consideration – that Whole-Place Community Budgets would seem the only game in town capable of making any significant dent in all those lost billions identified earlier.

game

Chris is a Visiting Lecturer at INLOGOV interested in the politics of local government; local elections, electoral reform and other electoral behaviour; party politics; political leadership and management; member-officer relations; central-local relations; use of consumer and opinion research in local government; the modernisation agenda and the implementation of executive local government.

Budget cuts, outsourcing, council mergers: 12,000 miles travelled, but Cornwall’s ex-CE will find plenty that’s familiar

Chris Game

Even allowing for local government’s legendary Stakhanovite working practices, the sector can’t usually manage that many hot news stories on Christmas Eve, so you do tend to notice them, especially if they contain a strand of possible personal interest. I remember well, then, the BBC’s announcement this past Christmas Eve that Cornwall Council CE, Kevin Lavery, had accepted a five-year appointment as CE of Wellington City Council and would be moving to New Zealand to take up the post in March – oh yes, at an annual salary of NZ$400,000, which converted then into £203,000, but today into £219,000 (I note irritably).

The reason (for my remembering, not for his moving) was that I happened to know that England’s cricketers would be playing the second Test Match in their series against the New Zealanders at Wellington’s charming and historic Basin Reserve ground in March – and I was planning to watch it. How brilliant, I thought, if I could do a quick interview with Lavery, just a couple of weeks into his new job, about his first impressions, contrasts with Cornwall, etc. Unfortunately, it quickly turned out that – for, I have to concede, eminently good reasons – ‘March’ in fact meant 31st March, by which time I would be well back in the UK.

More recently – like this morning – it also turned out that the final day of the said Wellington Test Match would almost certainly be rained off. So, lacking anything better to do, I thought I’d report anyway on some of the stuff that the interview might have covered.
First, the contrasts and similarities. Wellington City has a population of 200,000 and the biggest of 9 and a bit elected councils (1 regional, 8 and a bit city and district – don’t ask!) in the Wellington region. The council has an elected mayor (currently Green), 14 councillors, employs 1,500 staff, and has a budget of NZ$400 million (£220 million).

Cornwall has a population of 535,000 and a 123-member council – roughly the number of councillors plus mayors in the whole Wellington region. The council employs 19,000 staff – not far short of NZ local government’s total employment – and has a budget of about £1 billion.

In short, Lavery’s new job represents an apparently significant drop in scale, but barely a drop at all in remuneration. I quoted his salary at the outset, partly because the NZ media (and possibly public) are at least as fascinated/obsessed with executive pay, pay-offs, etc. as ours are, but mainly because so far his financial cost is one of the very few things that most Wellingtonians, including most councillors, know about their new CE. He was head-hunted in a recruitment process that cost NZ$157,000, including NZ$12,000+ to fly him out for interview; he can claim up to NZ$40,000 removal costs, and is promised a ‘golden parachute’ payment of up to NZ$200,000, if the job disappears in the regional governmental reorganisation expected over the coming couple of years. As one councillor put it: “We don’t know what we’re getting, but he’s cost us a bomb to get and he’ll cost us a bomb if he goes”.

So it’s fair to say that his relations, initially at least, with some councillors could be as touchy as they were with some of those in Cornwall, where, it may be recalled, the Conservative leader, Alec Robertson, was deposed and plans for a massive Lavery-driven shared services joint venture project had to be halted after they’d failed to win majority councillor backing.

Reportedly, Lavery was first sounded out by the Wellington headhunters immediately following the leadership change and the resulting withdrawal of one of the two bidders for the shared service joint venture, leaving only BT, one of Lavery’s former employers. But whatever the detailed sequence of events, the reputation preceding him to Wellington has been that of a ‘Marmite (or perhaps Vegemite) bureaucrat’ – you either love him or loathe him – and one with an undisguised enthusiasm for privatising and outsourcing services.

From which you might suppose that the costly new appointment was perhaps a symbolic act on the part of a council whose leadership had recently taken a shift to the right, and was looking at one and the same time to signal its political authority and a major change in policy direction. You might, but you’d be quite wrong.

If party politics in Cornish local government is, by UK standards, relatively low-key, in Wellington – and indeed in NZ local government generally – it is barely visible and almost uninterpretable to the untrained eye. In the city’s 2010 local elections, only 3 of the 14 successful candidates had stood openly under party labels (2 Labour and 1 Green), and the Mayor, elected for the first time (like councillors, for a three-year term), though a Green party member, had campaigned as an Independent.

Celia Wade-Brown’s election as Mayor seemed to surprise her almost as much as it did pretty well everyone else. Born and brought up in England, she came to NZ only in her late twenties, and, with little prior public warning, decided in 2010 not to recontest her council seat, but instead to challenge the high-profile mayoral incumbent, Kerry Prendergast, seeking her fourth term of office. In the STV election, Prendergast was a comfortable 6% ahead after the count of first preference votes, was still ahead on the second, third and fourth counts, but was overtaken by Wade-Brown on the fifth and final count by just 176 out of more than 60,000 votes cast.

The mayoral and councillor results combined were interpreted as representing at least a modest move towards the centre-left, but if voters were looking for a significant leftward policy swing, most must have been disappointed. Indeed, the CE appointment, involving as it did the personally humiliating dismissal of the former CE after 15 years and for apparently nothing very particular, was one of the few visible signs of an intended change of direction. As far as the 2013/14 Draft Annual Plan and budget is concerned, the headlines must look as familiar to Wellington electors as they do to us: large-scale savings (NZ$240 million over 10 years), necessitating service cuts, job losses, increases in fees and charges, and ongoing outsourcing.

A major reason for Lavery not taking up his post until the end of the month is that there are three important events taking place between now and then, the consequences of which will take up a sizeable chunk of his in-tray. One is the Council vote on 27th March to approve the Draft Annual Plan, detailing the Council’s work programme and proposed rate and fee increases, following which it will, as required, go out for a month’s public consultation, before coming back to the Council for final approval in June.
This year’s Draft Plan cuts council spending by NZ$9 million and proposes a rate (property tax) increase of 2.8%, and several of the detailed cuts especially are controversial: restricted library opening hours, increased parking charges, “changing the operating model” of the aquatic centre crèche (unsubtle euphemism there!), reduced grants to the Zoo Trust and ‘Positively Wellington Tourism’. All can, of course, and doubtless will be compared to the new CE’s salary.

Before that, on 21st March, another public consultation begins – on three options for local government reform across the whole Wellington region. Two of the three are alternative ‘super city’ models, as favoured by the regional reform working party. The third is a minimally modified status quo, added by the Mayor and councillors who oppose a super-city solution and argue that the public should be presented with a wider-ranging choice. Lavery will be on familiar territory here.

Also on 21st March Wellington councillors vote again on the national Transport Agency’s proposal for a 300-metre long, 9-metre high concrete flyover to ease the perpetual congestion round the huge roundabout within which is situated the Basin Reserve cricket ground (where in fact I should be sitting at this moment). We cricket fans fear the flyover would seriously blight our spectating, to say nothing of its impact on hundreds of local residents. The Mayor – for whom almost any kind of road development is anathema – and a majority of councillors argue that the congestion can be resolved by a combination of other means. However, some of the Mayor’s phraseology is worrying. She talks rather vaguely of ‘fine-tuning’ the present roundabout, and of how Basin Reserve “must not be blighted by a naked block of concrete”, as if various forms of pleasingly attired concrete were available alternatives. And now there’s talk of a couple of the eight councillors who opposed the flyover in December maybe switching sides following a two-month council staff investigation. What a pity I couldn’t have given the new CE a short personal briefing on the issue.

game

Chris is a Visiting Lecturer at INLOGOV interested in the politics of local government; local elections, electoral reform and other electoral behaviour; party politics; political leadership and management; member-officer relations; central-local relations; use of consumer and opinion research in local government; the modernisation agenda and the implementation of executive local government.