5 reasons why we need a new female leadership paradigm for the public sector

Catherine Mangan

As it’s International Women’s Day, I’m reflecting on the fabulous women I have the privilege to work with as part of the national leadership programmes we convene. One recurring question I’m asked by women (and one that I often ask myself) is whether they ‘fit’ the prevailing paradigm of a leader in the public sector. They have often been told (typically by male colleagues) that they need to act more like a leader – be more assertive, more confident, and speak up more in meetings – in other words, told to act more like current male role models.

This seems to me an outdated view of leadership, which is no longer fit for the complex world of public service. And on International Women’s Day I’m feeling empowered and provocative and (putting aside for the moment the debate about whether male and female styles of leadership map onto being men and women) I’m going to suggest that we need a new, more female paradigm of leadership for public services.

There are (at least) 5 reasons why:

  1. Female leaders, in my experience, not only talk to their staff, and residents, but they actively listen to them. They gather ideas and opinions from others, are genuinely interested in what different people have to say, and create a better solution from working with others. They are also prepared to change their minds. This is not a weakness, but a strength.
  2. They say ‘Come with me’ rather than ‘Do what I tell you’. They take time to explain to people why changes are necessary and offer encouragement and sense making. This is not a lack of direction, but an approach which recognises that change is difficult for people.
  3. They don’t view their role as a competition with other leaders. Rather, they have a level of humility that helps them to understand that it’s not about who can take the credit for the new initiative, it’s about whether it makes life better for their residents. This is not a sign of selling out, or not protecting the interests of your organisation. It’s effective systems leadership.
  4. They don’t think that they know the answer to everything. They recognise the complexity of the world in which they are working and understand that they can’t do everything on their own and need to collaborate with others rather than shying away from revealing a lack of knowledge. Asking others to help come up with potential solutions is the only way to tackle the wicked issues public services deal with.
  5. They have self-doubt about their abilities. This means they ask for feedback, they check out the impact of their approach, and are reflective practitioners who learn from their own practice.

So I say to all those women who think they don’t fit the mould of a leader – don’t try and shape yourself to fit an outdated mould – let’s re-shape the leadership paradigm so it looks a lot more like us.

mangan-catherineCatherine Mangan is Director of INLOGOV, co-convenes the Win Win network at the University of Birmingham, and facilitates national leadership programmes including Total Leadership, Aspiring Directors of Public Health and the National Graduate Development Programme

Why You Get More Than Just a Degree When You Study at INLOGOV

Yulei Lei graduated from INLOGOV last year and reflects on the time she had with us…

As I was finishing my undergraduate studies at my university in China, I decided I wanted to go on to further study. My undergraduate was in accounting, but I decided I wanted to study a topic that would broaden my areas of expertise and that I wanted to come to the UK. Then the most exciting thing happened – I received an unconditional offer to study an MSc in Public Management (taught) at the University of Birmingham.

Like that, in September of 2016, I started studying at INLOGOV at the University of Birmingham. I remember the 22nd was the first day I came to INLOGOV. I still remember how excited I was. That day I met all my classmates who were coming from so many different countries. And the lecturers introduced us to many things which were relevant to my time on the Masters; for example, the modules, the career events, and many other activities on campus. As an international student, my favorite part was the BIA English class and Lunch Time English, which were a complimentary offer from the University to support international students in order to improve their English. It was very interesting and useful.

The modules I took at INLOGOV were divided into two different parts: compulsory core modules, which were Public Management, Performance Management, Strategic Management and a dissertation; and three optional modules – I chose Leadership in Public Services, Regulation and Finance, and Community and Local Governance. I enjoyed all these modules to the point that I could not say which one was best, because all of the modules had a fabulous professional lecturer who would not let the course become boring or tedious. My favorite part of class was group discussion. In this part, you were able to express your thoughts and discuss them with your classmates and lecturer, and they always helped me clear my mind and put forward my ideas. This was very helpful to me because I did not have much experience with practical examples, as opposed to the professors and many of my classmates, who had abundant experience from their jobs. Also, the teaching staff in INLOGOV were very friendly and helpful, they are very open to answering your questions and give you a hand on your assignments. It can figuratively be said that it was as if one were ‘standing upon the shoulders of Giants’ (Isaac Newton).

Group class photo.jpeg

Studying at INLOGOV, what I got was not only a degree, but also many friends from many different countries. We discussed the differences concerning the social situation in our own countries and shared ideas on how to improve things in public management. Then we summarized the good experiences to be used in our own projects. This is a good way to understand optimum outcomes. The module leaders and students can show you different ways of thinking and stimulate your brain to search for and discover many good ways to improve your skills in public services and management. INLOGOV is a department which brings many different cultures together to learn from one and other. Through our group, we exchanged thoughts, expressed ideas and completed projects successfully.

Besides studying, I also took part in some activities with the Student Guild of the University of Birmingham, I met new friends there and learnt new skills, for example how to grow a shrub and how to cut down a tree for gardening management. Moreover, I do love the new 360 sports centre which is the place I also often went to in my spare time. The facilities are new and it has a fabulous swimming pool.

All in all, my year of masters study at the University of Birmingham was very joyful. I met very professional staff and made lovely friends. I acquired lots of new knowledge and learnt lots of skills. I will miss all the things from when I was at INLOGOV, in the University of Birmingham, and in the UK for my Masters journey. Also, I hope I can use what I learnt from INLOGOV in my future career. If possible, I wish to take what I have learnt and apply it in my own country to help to improve the performance management systems in different organizations, not only in the public sector.

Yulei Lei graduation photo (2)Yulei Lei graduated from INLOGOV in December 2017 with an MSc in Public Management. She is from South West China.

Find out more about our postgraduate programmes here.

Children’s Services Spending: Where has the axe fallen?

Calum Webb (University of Sheffield) and Paul Bywaters (Huddersfield University)

Children’s and Young Peoples’ Services, encapsulating children’s centres, safeguarding and social work, family support, services associated with looked after children, often totals nearly £10 billion of spending annually. Despite this, limited attention is paid to how these funds are spent, and much less is known about how such spending has changed over time. Has spending increased or decreased under austerity? Have budgets for front-line services for some of the most vulnerable and voiceless members of society – children at risk of abuse and neglect – been protected, as is often claimed, or axed, in the face of the rising strain placed on local government finances? Where cuts have been made to cope with reduced budgets, where have they fallen? Have cuts to children’s services been greater in more deprived local authorities, as previous research by the Joseph Rowntree Foundation has indicated, further disadvantaging children from poorer communities and with greater needs?

The contradictory findings from government departments does not inspire confidence in their ability to answer any of these questions convincingly. A 2016 report from the National Audit Office concluded that expenditure on children’s services had risen by approximately 12 per cent between 2012 and 2015. This report, however, only looks at a sum of between £1.6 billion and £1.8 billion, and we had no luck replicating this figure – not with any combination of categories or adjustments for inflation.

A more recent report published by the Department for Education came to fundamentally different conclusions, namely that total expenditure had fallen by 9 per cent between 2010 and 2016, and that between 2012 and 2015, the same period covered by the NAO report, spending had reduced from £9.2 billion to £8.9 billion, a 3 per cent reduction.

The problem is partly down to the quality of the data – the inconsistency of categories between years prevents any meaningful long term comparisons of very specific spending areas. A few of the broader spending categories are fairly stable over time, namely spending on looked after children and spending on safeguarding, and the remainder of categories can loosely be considered ‘preventative’ or ‘early intervention’ services. These are the Sure Start centres or family support services that are intended to address the difficulties children in need may face before these problems develop to the point that they require more drastic interventions.

The second major problem with the official reports is the tendency to only focus on changes in the total national levels of expenditure, rather than focusing on what has been happening on a local authority level. All it takes is a few of the larger local authorities, the ‘big spenders’, to see an increase to dwarf many negative trends in smaller local authorities. This approach therefore doesn’t necessarily reflect the reality for children across England.

When we looked at expenditure after taking these things into account we found very clear patterns. The most deprived 20 per cent of local authorities had seen reductions in spending of 25 per cent, whereas the least deprived 20 per cent have had cuts of 4 or 5 per cent. When we split local authorities into three equally sized groups of 50 (the City of London and Isles of Scilly LAs are excluded as outliers), based on their deprivation scores, we found significant differences in the expenditure trends: rapid rundowns of expenditure per child in the 50 most deprived local authorities, less extreme cuts for the 50 ‘middle’ deprived local authorities, and far less severe cuts for the 50 least deprived local authorities. This is in part due to the indiscriminate way in which austerity measures have been introduced, without attention to the fact that more deprived local authorities typically have higher spending per child to meet greater levels of more complex needs. This means a hypothetical 10 per cent cut in Middlesbrough is going to result in a much bigger loss of £-per-child than a 10 per cent cut in Wokingham.

What’s more is that the share of spending across the different services has changed substantially, mirroring patterns in social work practice more broadly. The share of spending has shifted away from the aforementioned preventative and support services in favour of maintaining the share of safeguarding spending and increasing the share of looked after children spending. On average, local authorities spent around 46 per cent of their children’s services budget on more prevention focused services in 2010-11. By 2014-15 this had fallen to only 33.5 per cent. This has been fairly universal across all local authorities, but slightly more extreme in the most deprived third, and is best seen visually.

CW graph for blog feb

We don’t know completely what impact this will have on the lives of children, but we do know that since 2010 there has been evidence of an increase in demand for children’s social services; with average Looked After Children rates increasing from 57.5 children per 10,000 in 2010-11 to 62 children per 10,000 in 2014-15, and the number of children in the population rising by approximately 750,000 since 2010. Furthermore, this population increase has been largely concentrated in the most deprived local authorities (12%) compared to the least deprived local authorities (4%), meaning stable intervention rates – such as rates of children in care – actually represent a substantial increase in workload for practitioners. This is just one part of a complex picture of disadvantage that children living in poverty face. What we do know is that there needs to be a clear commitment to improving the quality and detail of the data that is collected about expenditure and deprivation because, as Ofsted’s Annual Report has acknowledged, there is a link between this and the quality of the services children receive across the country.

The research presented here was funded by the Nuffield Foundation and is part of the Child Welfare Inequalities Project and will be published in Local Government Studies in February 2018. Evidence from the project is being presented to an APPG for Children on the 7th February 2018.

Calum WebbCalum Webb is an ESRC White Rose postgraduate research student at the University of Sheffield’s Department of Sociological Studies. He has recently contributed to the ESRC funded research project ‘Developing a Policy Learning Tool for Anti-Poverty Policy Design and Assessment’ and the Nuffield Foundation funded ‘Child Welfare Inequalities Project’. His PhD research investigates approaches to the longitudinal measurement of multidimensional poverty. Calum tweets using @cjrwebb

Paul BywatersPaul Bywaters is Professor of Social Work at Huddersfield University working in the Centre for Applied Childhood, Youth and Family Research. He has led a series of research projects funded by the Nuffield Foundation and the Joseph Rowntree Foundation which have examined inequalities in the incidence of and responses to child abuse and neglect between and within the four UK countries. For more information can be found here. Paul tweets using @PaulBywaters


The colour (and gender) of power

Chris Game

As a blogger, I see myself as a kind of Middlesbrough in the Premier League: beigey. Not significant enough to attract the serious detestation of a Chelsea or Man United, but nor with the widespread likeability of a Bournemouth or Burnley. It means any feedback I receive is rarely obscene and generally supportive or constructive – an example being my recent blog on the West Midlands Combined Authority, whose initials, I’d suggested, could stand for “the (almost) Wholly Male Combined Authority”.

A respondent from Localise WM, a not-for-profit organisation that promotes local trading, tweeted that the initials “could alternatively stand for White and Male Combined Authority”.  And they were quite right. The figures are identical: one woman member and one (different) BAME member on the currently 33-member WMCA Board.

I had two main reasons for omitting any discussion in that blog of the minority ethnic dimension. First, space. I wanted to record not just the statistics of women’s under-representation in the elected Combined Authority world, but the efforts to improve that representation in, for example, Greater Manchester and Liverpool, prompted by local women’s campaign groups.

The second reason was that I was aware of a project on the point of publication that would almost certainly furnish the data to enable a more informed and better illustrated discussion. Not, as it happens, this week’s delayed launch of the Cabinet Office Race Disparity Unit, intended to monitor how public services discriminatorily treat people from different racial and ethnic backgrounds. I had in mind the Guardian newspaper’s international Inequality Project, a small but important part of which is ‘The Colour of Power’ (CoP) study undertaken by Operation Black Vote and the business management company, Green Park.

The CoP website suggests that “when we embarked on this journey, we did not know exactly what we would find”. Commendably open-minded, but my guess is they actually had a VERY good idea of what they’d find – that “in 2017, pathways to the very top jobs for Britain’s black and minority ethnic communities are almost non-existent” – and wanted to use an obvious but still highly effective means of quantifying and publicising it. The actual figures they recorded were that “for over 1,000 of the most senior posts in the UK, only 3.4% of occupants are BAME [30 men, 7 women], and less than 24% women”.

Shocking as such statistics ought to seem on their own, pictures are harder to ignore or refute – one reason why the row over the BBC presenters’ gender pay gap took off so instantly: we knew what most of them looked like. And it was why, following the similar 2016 #Oscarssowhite furore, the New York Times produced its famous ‘Faces of American Power’ feature, actually picturing the faces – and genders and colours – of the ‘Power People of America’.

That’s precisely how ‘Colour of Power’ have presented their data. There are 37 sets of pictures in all, from the CEOs of FTSE 100 companies, public bodies, advertising agencies and top charities to editors of women’s lifestyle mags and Premier League football managers – a selection of which, mainly from national and local government, I’ve summarised in my table.

Colour%20of%20Power%20table.JPG

Knowing an albeit ludicrously dated authorial photograph would accompany this blog, and having recently celebrated my no-longer-titian beard’s 40th birthday, I did briefly contemplate adding a facial hair column to the table. But it turned into a version of the even older Peter Cook sketch, about it being only his lack of Latin that prevented his becoming a judge, rather than a coal miner.

It became apparent that my becoming not just a Supreme Court Judge, but a Chief Constable, Permanent Secretary, or CEO of a top bank, was effectively stymied from the outset by the beard. Easily my best chance of even proximity to power would have been, like Jeremy Corbyn, to become a party leader, with three of the eight male leaders unvictimized for their full facial hair.

I did, though, want to illustrate CoP’s method and presentation, and I chose the politician and officer leaders of the councils which, outside London, have the highest numbers and proportions of BAME residents: the 36 metropolitan boroughs, with approaching 2 million or nearly 15%. I wasn’t expecting the councils’ members and officers to reflect these figures in any statistically significant way, but I did think they might come fractionally closer than, say, unitaries. So it was fortunate I didn’t put money on it.


Operation Black Vote, ‘The Colour of Power’, BAME political representation, International Inequality Project, Race Disparity Unit, women local authority CEOs

Met%20Borough%20leaders.JPG

A few of the leaders were apparently camera-shy, but the contrast between the M/F balance of leaders and CEOs – here particularly, but in councils of all types – was something else I hadn’t entirely anticipated. The clear majority of women CEOs in the mets, incidentally, was the only such figure apart from the MDs of media agencies and editors of women’s fashion and lifestyle magazines – and I did briefly consider using just the middle row, or even the phalanx of five just left of centre.

Which would have been a nice positive note on which to close, but in the circumstances also a false one. For the message of the CoP exercise – the almost complete absence of BAME faces, here and throughout the local government tables – is simply an embarrassment. Yet these are the people responsible, accountable even, for many of the services producing the disparities and ‘burning injustices’ that the PM and her Disparity Unit are pledged to eradicate. Quite an ask.

gameChris Game is a Visiting Lecturer at INLOGOV interested in the politics of local government; local elections, electoral reform and other electoral behaviour; party politics; political leadership and management; member-officer relations; central-local relations; use of consumer and opinion research in local government; the modernisation agenda and the implementation of executive local government.

Control freakery: Understanding who really gets to take control

Steve Rolfe

When Michael Gove reiterated the Brexiteers’ mantra of ‘taking back control’ at the recent Conservative Party Conference there was a strong sense of déjà vu about the whole performance. And not just because we’ve all heard the ‘taking back control’ message over and over again in the last 18 months. The repeated rhetoric of control also has strong echoes of an earlier Conservative policy idea – the notion of a ‘Control Shift’ at the heart of Localism and the Big Society. And the parallels go further. Just as campaigners have questioned what it might mean to ‘take back control’ after Brexit and who ends up in control, so my Local Government Studies paper, ‘Divergence in Community Participation Policy: Analysing Localism and Community Empowerment Using a Theory of Change Approach’ questions the policies which ostensibly aim to give power and control to communities.

Back in the early days of the Coalition government (remember those innocent pre-EU-referendum days?), the ideas of the ‘Big Society’ and shifting control to communities through Localism were big news, even if nobody could really work out what David Cameron meant by the Big Society. A whole raft of ‘new community rights’ were created, giving communities opportunities to challenge and take over public services, buy local assets, create their own Neighbourhood Plans and even develop local housing. Alongside this, the Localism Act aimed to ‘strengthen accountability’ of public sector organisations through directly elected mayors and Police and Crime Commissioners, plus referenda on ‘excessive’ council tax increases. At the same time, the Scottish Government were using similar language to set out their Community Empowerment agenda, giving communities rights to participate in service improvement and extending rights relating to control and ownership of land and assets. Both these policy frameworks are still in place, shaping community participation across England and Scotland, albeit that anything non-Brexit gets very little media attention these days.

On the surface, Localism and Community Empowerment seem to share many common features. Both see community voices as an important tool to improve public services, and community action as a means to fill some of the gaps between such services. Moreover, the language of ‘devolving power to communities’ sounds very similar on both sides of the border. However, as I try to argue in my paper, a more detailed look at the assumptions underlying Localism and Community Empowerment suggest that the UK and Scottish Governments have quite different ideas about how communities should participate and how they should relate to public sector agencies.

Crucially, the Scottish Government’s agenda emphasises a positive-sum conception of empowerment, where communities and public sector agencies each gain power by working together collaboratively. By contrast, most of the elements within Localism operate on a zero-sum basis, focusing on taking power away from the local state to give it to communities. Clearly there are risks in both approaches. In the Scottish partnership approach local authorities may simply hang on to power and refuse to collaborate – the evidence from decades of community work in Scotland provides many examples of intransigent bureaucrats, although also many tales of productive cooperation. In England, analysis of the policy detail suggests there are more complex and subtle risks involved. Hidden beneath the rhetoric of community rights are mechanisms which turn communities into ‘market-makers’, forcing local authorities to put services out to tender and challenging limits on house-building. Hence control is not so much shifted to communities, but rather handed to the free market and private businesses.

Interestingly, however, the more recent evidence about the use of Localism’s ‘new community rights’ suggests that communities are savvier than David Cameron perhaps expected. The Community Right to Challenge (the most blatantly market-focused element) has been hardly used in the six years since it was instituted. And whilst Neighbourhood Planning has proved very popular across England, most communities are attempting to use it to exert some control over the local housing market, rather than letting it rip.

So perhaps those fans of Brexit who continue to trumpet the idea of ‘taking back control’ may need to reflect a little on who is actually gaining control as we leave the EU. The evidence from community participation policy suggests not just that the rhetoric may be concealing the intended winners in the process of shifting control, but also that such processes are often unpredictable as multiple actors attempt to impose their own notions of control.


Steve%20Rolfe%20pic.jpgSteve Rolfe is a Research Fellow at the University of Stirling. His research interests include community participation and empowerment, social enterprise and housing. Before entering academia, he worked in local government for 15 years in a range of community development and policy roles.

Measuring Mandates – Let’s at least use the facts

Chris Game

Maybe it was a Monday morning thing.  But when last Monday’s Times – once, to foreigners at least, the ‘newspaper of record’ – recycled for the umpteenth time the claptrap about London Mayor, Sadiq Khan, having “the third biggest personal mandate of any directly elected politician in Europe”, my 16 months’ silent tolerance ran out.

The probably familiar story was that Mayor Khan, not being an ‘ordinary’ Labour Party member, had been barred from addressing ‘the people’s conference’. But then, presumably because he’s one of the relatively few Labour people who do actually run something – like Greater London – and decide stuff – like the fate of Uber – he was unbarred.

Unlike Mayor Andy Burnham, who also runs something – Greater Manchester – but who actually challenged Jeremy Corbyn for the party leadership, and has a willy – sorry, personal mandate – smaller than Corbyn’s, barely a quarter the size of Khan’s, and was easily side-lined to fringe meetings.

Because that’s what most of these things are fundamentally about in the male-dominated world of politics: if you’re a union leader, the size of your membership; if an MP, the size of your majority; if a council leader, the size of your electorate; and if a directly elected leader, the size of your mandate – all willy substitutes. Which is why it’s important to get the measurements right – unlike The Times, which, like at least some of our students, apparently uses Wikipedia as its bible of factual information.

The pity is that Sadiq Khan’s genuine statistical achievements are impressive enough not to need exaggerating. Largest personal mandate of any politician in UK history. First elected Muslim mayor of any major western capital.

To me, it was the precision of the Wiki/Times factoid that made it immediately suspicious – ‘third biggest’ personal mandate, of any directly elected European politician? It never even sounded right. After all, Europe’s a biggish place. Nearly 50 countries, even excluding the Vatican. At least 30 with populations over 3 million, where a personal vote bigger than Khan’s 1.3 million is at least conceivable.

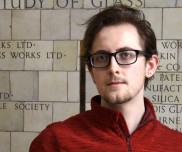
It seemed a bit like assuming Andy Street, because he’s elected mayor of the largest mayoral Combined Authority, has the biggest personal mandate of any political figure outside London – instead of, as shown in my table, only the second biggest in the West Midlands.

Politicians%27%20personal%20mandates%202.JPG

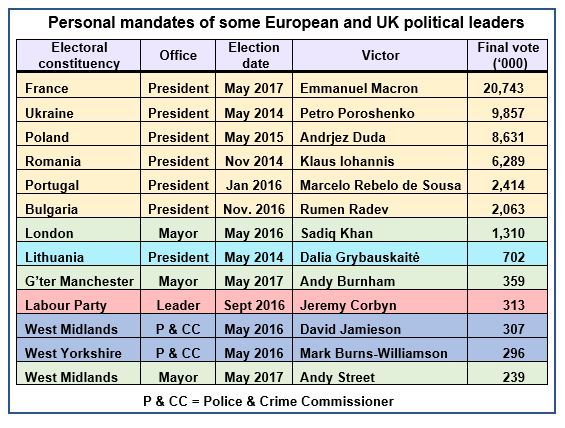
Anyway, back to the Khan claim, and a couple of early concessions. Let’s accept President Erdoğan’s Turkey, with the great majority of its population in Asia, and despite most holiday insurance classifications allowing it as European, counts as either Asia or Middle East. And Russia, though over three-quarters of its population live in Europe, as technically Eurasian. Otherwise, President Putin’s nearly 47 million votes in 2012 would present quite a hurdle.

But Ukraine, as every pub quizzer knows, is the largest country entirely in Europe.  Maybe not your established, Scandinavian-model democracy, but it is a kind of French-style semi-presidential republic, with a multi-party system. And its 2014 post-revolution presidential election – though excluding the annexed Crimea and certain other areas – was accepted by scrutineers both for its (broadly) democratic conduct and outcome: President Poroshenko’s decisive first-round victory.

France itself is one of Wiki’s top two, Emmanuel Macron comfortably topping 20 million personal votes in the second round of this May’s presidential elections. The other Wiki nominee, though, is Portugal’s President Rebelo de Sousa, which would be fine, were he not the only other nominee.

Like France, Portugal is one of the semi-presidential systems that constitute almost the governmental norm in modern-day Europe. They’re all different, particularly in their division of powers between the head of government and head of state. The key questions: is the president/head of state directly or indirectly elected, and, if directly, is s/he politically significant or essentially a ceremonial figurehead?

Portugal’s President was elected in a party political election and has real powers, from dismissing governments to vetoing laws and granting pardons. Wiki is quite right, therefore, to include it – but quite wrong to suggest that President Rebelo de Sousa is, apart from Macron, the only European politician with a bigger personal mandate than the London Mayor’s.

Wrong, partly because it appears not to understand the huge breadth of practice found in different ‘semi-presidential’ systems, and partly because its ‘Europe’ appears to stop at the Oder-Neisse Line, the former border between the German Democratic Republic and Poland. Even then, though, Poland, Romania and Bulgaria, like Ukraine, were European countries – their EU membership is a bit of a giveaway – and today, like France and Portugal, are semi-presidential republics whose Presidents are very far from symbolic.

If you’ve any doubt, just think back to the Polish bit of William and Kate’s embarrassing summer ‘Brexit tour’. Monday, they were shaking hands with President Duda at the Pres’s palace. Tuesday, he was assuring TV viewers that his Law & Justice Party’s plans to give government the power to appoint and dismiss judges were purely to increase judicial efficiency, and really nothing alarming. Wednesday, legislation was rushed through parliament allowing the government to dismiss at will any of the 83 Supreme Court judges.

Not exactly the kind of stuff a genuinely ceremonial Head of State like William’s grandma gets up to, so let’s hope the handshake was worth it when it comes to Poland’s vote on any Brexit deal – if indeed the EU Commission hasn’t by then suspended the country’s voting rights.

Apologies for the digression, but my point is simply that Presidents Duda, Iohannis, Radev and Poroshenko are no less “directly elected European politicians” than President Macron, which I reckon puts Mayor Sadiq Khan’s mandate down from 3rd to 7th in the list. Still ahead of that of any directly elected woman politician in Europe – Lithuania’s President Dalia Grybauskaitė – but then she hasn’t got one to feel the need to wave.

gameChris Game is a Visiting Lecturer at INLOGOV interested in the politics of local government; local elections, electoral reform and other electoral behaviour; party politics; political leadership and management; member-officer relations; central-local relations; use of consumer and opinion research in local government; the modernisation agenda and the implementation of executive local government.