Chris Game
The LGA’s Magna Carta web pages have recently featured a delightful homophone – sounds the same as another word, but different spelling and meaning. Among this summer’s many MC commemorative events will reportedly be “a programme of inciteful lectures and talks” (my emphasis).
Excellent, I thought. Insight’s for wimps. Rousing incitement is what’s needed if, like the LGA, we’re to model today’s struggle for devolution on that of the 13th Century rebel barons with their tyrannical but cash-strapped King, and what better rouser than the Association’s aptly named Chair, David Sparks.
Given the countless products already being promoted by June’s 800th anniversary – from Jay Z’s free-to-smartphone album, Magna Carta Holy Grail, to the British Library’s ginger fudge – cynics might accuse the LGA of bandwagon jumping. But they’d be unfair.
There is much more local government stuff in Magna Carta than I for one first appreciated. I knew the main local government clause (13), about the City of London and “all other cities, boroughs, vills [towns] and ports” being assured all their “ancient liberties and free customs, by both land and water”. But I’d no clear idea what the liberties and customs were, and also assumed that was about all there was.
In fact, most of clauses 23 to 31, ostensibly about such things as county farms and commandeering of timber, actually referred to malpractices of the King’s local agents – sheriffs, bailiffs, and so on – with clause 25, perhaps most relevantly to modern-day concerns, limiting the financial burdens placed by the King on the counties.
Then there’s clause 48, empowering 12 knights elected in each county to investigate and abolish those malpractices, which can be seen as part of a wider local self-government campaign around the turn of the 13th Century.
Even so, there’s a still better instance of early local self-government in a contemporaneous charter which, though less known, was important in itself and also played a key part in shaping the Runnymede agenda: the King’s Charter for London of May 9th 1215.
The London here, of course, is the famous Square Mile – today’s City of London Corporation – some of whose ‘ancient liberties’ predated the Norman Conquest. From 1067, in exchange for London’s supporting the King with cash or troops, these liberties were extended in successive royal charters, and included exemptions from certain taxes and tolls, right of trial by the City’s own courts, and the right to appoint civic officials.
Richard I (1189-99) was particularly indebted to Londoners, as funders of his crusades overseas and defenders against his baronial opponents at home, and it earned them in the early years of his reign both a recognized body of self-government, in the form of a Norman-style ‘commune’ – precursor of the City Corporation – and their own mayor, in place of the King’s Portreeve or sheriff.
Historians dispute precise dates, but the City claims 1189 as the year Henry Fitz-Ailwin de Londonestone was appointed its first Mayor – the addition of ‘Lord’ took another 200 years – and proceeded to serve a never remotely repeated 24 terms.
This circumstantial evidence alone suggests Fitzy was not only entirely acceptable to the King, but probably a financial backer and appointed by him. And explicit reinforcement comes in the May 2015 Charter, King John’s last desperate (and unsuccessful) attempt to detach London from the baronial insurgency that would culminate in the following month’s Magna Carta.
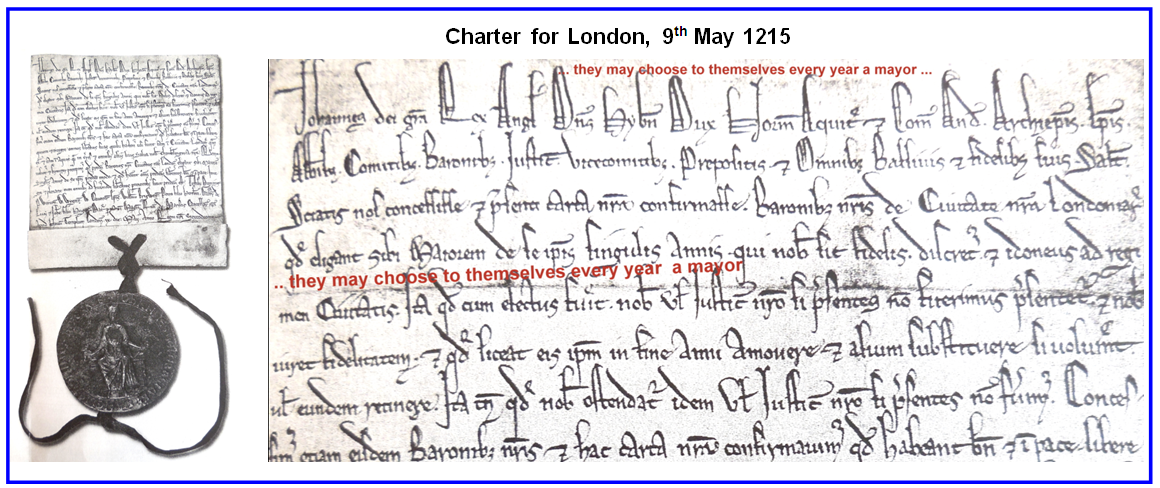
In a key concession and, it seems, the first documented reference in this country to a popularly elected mayor, the Charter grants “to our barons of the City of London, that they may choose to themselves every year a mayor …”.
The full translation, from the second line of the illustrated extract, runs:
“Know ye that we have granted … to our barons of our city of London, that they may choose to themselves every year a mayor, who to us may be faithful, discreet and fit for government of the city, so as, when he shall be chosen, to be presented unto us, or our Justice if we shall not be present… and he shall swear to be faithful to us; and that it shall be lawful to them, to amove him and substitute another, if they will, or the same to retain …”
The King’s climb down could not be clearer. The tables are turned: You now choose your own Mayor, and I get to approve his faithfulness, rather than the reverse. It wasn’t his biggest surrender of that 1215 summer, but it was significant then and, whatever you happen to think of even the idea of directly elected mayors, it obviously still has its relevance today.
The story, and this blog, could obviously end here, but that would have involved omitting quite an interesting postscript, which links these events directly to the one Lord Mayor of London that even most non-Londoners can name: Richard Whittington.
We need to set aside much of the pantomime tale: the Gloucestershire lad, Dick, and his fictional cat who, returning home up Highgate Hill after failing to find his fortune in London, heard the distant Bow Bells preternaturally telling him to fulfil his destiny and “Turn again, Whittington, thrice Lord Mayor of London”.
Never mind what he was doing returning to Gloucestershire via Highgate Hill, or whether he could conceivably have heard the Bow Bells chiming five miles away. The interesting bit is the ‘thrice’ – because, by the time this bit of nonsense was written, centuries later, Whittington had in fact served four mayoral terms: 1397-98, 1406 and 1419. So why the confusion?
No Lord Mayor since Whittington has served as many terms, so there can be no doubting his renown and popularity during his own lifetime. His money helped. A successful import-export merchant, he’d have easily made the Sunday Times Rich List, and he spread it around judiciously. Plenty was ‘borrowed’ by the King of the day, but plenty also went to good causes and public works – including an unmarried mothers’ ward at St Thomas’ Hospital, rebuilding the Guildhall, and a 128-seat public toilet.
The one big irony in all this is that the early public affection for Whittington’s mayoralty owed much to his initially NOT having been popularly elected – despite it having become the established practice by then for London citizens ‘at large’ to choose their mayor, with the King formally ratifying their choice.
However, when the incumbent mayor died in June 1397, Richard II, in one of his absolutist moods, decided he’d do the electing and simply imposed Whittington, one of his long-term creditors, on the City. The new mayor responded by negotiating a costly but popular deal, buying back for London its own usurped privileges for £10,000 (around £6 million today), and in October was triumphantly elected by a grateful citizenry – the two separate assumptions of office in the same year apparently accounting for the doggerel-writer’s ‘thrice’, unless of course it was the difficulty of scanning ‘quadruple’.

Chris Game is a Visiting Lecturer at INLOGOV interested in the politics of local government; local elections, electoral reform and other electoral behaviour; party politics; political leadership and management; member-officer relations; central-local relations; use of consumer and opinion research in local government; the modernisation agenda and the implementation of executive local government.