Are you a public servant who has had a wiggly or a squiggly career? Do you wish you had? Μaybe you think it’s just not that important? Or perhaps it’s just too difficult to do?
The idea of a squiggly career, in other words, thinking less about career ladders and more about sideways, downwards and cross sector moves, is one that has gained some interest over the last few years.
And it has a particular resonance in the context of public services.
For one thing, as working across organisational boundaries becomes more and more critical for public servants, so does the need to be able to speak the different ‘languages’ of different organisations and sectors. Having experience of actually working in those other settings could be a real help when it comes working across organisational borders.
Squiggly careers might also promote innovation – sideways movers bringing a fresh perspective on challenges and a handle on what has worked elsewhere.
And downwards moves might be important as well. Frontline experience helps to bring empathy and understanding – both for the people receiving public services and for those colleagues providing them.
Of course, it might not work for everyone. Some public sector professions have set career paths and it’s not always that easy to jump organisation or sector when you are in competition with the natives.
Even if a clean jump is not possible there might always be the possibly of placements and secondments.
And shouldn’t managers be promoting these kinds of experiences and career moves? After all, isn’t it good for individuals and isn’t it good for public services in general if workers have a variety of experiences to draw on when facing the complex challenges of 21st century public service?
We’d be interested to hear your thoughts on future public service careers, to inform our work updating the 21st Century Public Servant framework.
Dr Dave McKenna is an independent consultant and researcher who helps councils and other public bodies with training, research and improvement work. He is part of the research team currently updating our 21st Century Public Servant framework.
Maybe you love it, maybe you hate it, maybe you are somewhere in between. Either way you know that remote working is here to stay. Should we be happy with how it’s going though? Are public services adapting or struggling with this new normal?
A lasting legacy of the pandemic, the expansion of remote working is definitely seen a good thing by many public servants. Less travelling, a chance to keep an eye on things at home and a chance to stick the washing on. You can have your work space exactly how you want and, when so many public services are looking to save money on costly office accommodation, it helps with that as well.
Of course, it doesn’t work for everyone. Unwanted interruptions, not having a good space to work in and missing those ‘water cooler’ conversations are all negatives. Also, isolation, professional and social, can take its toll and affect mental health. It’s no fun taking a distressing call in your own home with no-one around to talk to about it afterwards.
Three years on from the first shock of the pandemic, a more complex picture of remote working is starting to emerge – something that we are picking up as part of refreshing the 21st Century Public Servant research 10 years on (link in the comments).
For example, is there something concerning about the way that remote working can divide teams? After all, when Joe is working at home the rest of us are left to answer the office phones or respond to the people turning up the front desk – and Jane is worried that Joe might not be really working at all. He certainly seems invisible.
There are also worries about people who joined their teams during lockdowns and formed their relationships with co-workers over Zoom. How might starting a job in ‘virtual limbo’ affect people when they finally start to meet their team in person?
We’ve also come across the idea that long term remote workers form stronger relationships with virtual co-workers and find it easier to distance themselves from work relationships they see as negative – perhaps withdrawing from their teams in a way that office-based staff might not.
And what about citizens? On the one hand public servants can be more accessible and might have more time due to less travel but is the quality of their interactions affected? When public servants are being asked to be more relational in their work can this be achieved in the same way through Teams or Zoom?
The challenge for public servants, it seems, is to adapt to remote working, or perhaps more accurately, to hybrid workplaces. To maintain the benefits of remote working while staying connected to co-workers and to the communities they serve.
We think it’s an intriguing topic of research and we are looking to learn more…
Dr Dave McKenna is an independent consultant and researcher who helps councils and other public bodies with training, research and improvement work. He is part of the research team currently updating our 21st Century Public Servant framework.
Promising Artificial Intelligence (AI) tools, most recently the likes of ChatGPT, have created an atmosphere of imminent disruptive change. News outlets bombard us with novel tools and applications that are poised to become the ‘new game in town’, revolutionising various sectors, jobs and ultimately the entire global economy. However, such sensationalist predictions often overlook the complexity of moving from where we are today to working effectively with novel, AI-powered tools in specific, concrete contexts and situations.
AI in the built environment: Digital twins
One such example of a recent hype are digital twins (DTs). Digital twins (virtual replicas) of physical objects or systems have been used for over two decades, most prominently in product engineering and manufacturing. Applications of the technology in the built environment are more recent, and in the UK in particular, the development of digital twins for built environment assets, systems and processes has been triggered by the National Infrastructure Commission’s Data for the Public Good (2017) report. Despite this relatively short history, technology promoters (often suppliers themselves) nowadays pitch the ‘digital twin’ as a ready-made, off-the-shelf data product to city authorities. Further contributing to the hype are various cities who market themselves on the global stage as leaders in digital innovation, and their digital twin projects, including the likes of Helsinki, Singapore, Barcelona, Xiong’an or Herrenberg. In the UK, cities such as Cambridge, Birmingham, Bristol and London have been experimenting with digital twins.
Are urban digital twins better characterised as ‘technology’ or ‘socio-technical innovation’ and why does it matter?
The urban digital twin (UDT) as a technology is often defined as a three-dimensional virtual replica of a city that makes use of a combination of technological innovation in sensors, big data and data science; building and city information modelling (BIM and CIM); and artificial intelligence (AI), machine learning (ML) and automation. At a more fundamental level, it is underpinned by a motivation to create an all-encompassing, single-source-of-truth digital simulation of the city’s built environment which is linked to the physical city via automated bi-dimensional data flows. Whilst the objective may be seen as admirable, there remain a myriad of unanswered questions when trying to unpack the UDT concept from a more practical view, including but not limited to:
Is the large-scale investment into the digital infrastructure (sensing, data storage and processing, analytics and modelling) justifiable given the expected benefits?
Is there enough good-quality evidence to suggest that the expected benefits can in fact be delivered in a particular context?
If so, what conditions might be necessary to enable benefit realisation?
How does the UDT project affect and/or incorporate urban citizens, communities and other stakeholders?
How does the proposed UDT fit into the existing landscape of data and digital tools in use?
To local authority practitioners these questions may sound common-sense or even routine. However, taking such issues into consideration essentially represents a move away from the purely technological towards a ‘socio-technical’ understanding of UDTs. From this perspective, UDTs are not off-the-shelf data products as they do not exist independently of the contexts in which they are applied. Ultimately, any digital twin will only ever be a partial representation of a city and its built environment, and therefore there are key decisions involved in designing UDTs for different cities (or regions). Such decisions can identify diverse technology design and/or implementation requirements based on specific, pertinent local policy questions or problems, existing data availability and digital twins (e.g., of energy systems) internally or accessed from other stakeholders, citizen and community preferences or needs, currently existing digital expertise, and so on. This process of developing requirements and solutions for digital twins has been termed ‘digital twinning’ in the literature, with scholars arguing that it represents an ‘act of governance’.
This is not to say that each and every UDT will, or need to be, bespoke. However, neither do UDTs need to be uniform, holistic and all-encompassing from the start – even if this were at all possible. Instead, federated systems of digital twins representing different aspects of cities can organically develop and evolve over time and as needs arise and change.
An alternative conceptualisation of UDTs: Transcending silos
Whilst it may not be possible or desirable to develop all-encompassing, ‘single-source-of-truth digital twins, UDTs nevertheless offer the possibility of linking certain currently siloed policy and governance processes which may benefit from some degree of integration to respond to contemporary challenges. One such example could be the intersection of energy, environment, transport and land-use in support of policy goals relating to net zero transition, affordable housing, mobility and employment – a use case we explored in the context of Cambridge.
Siloed working within and between local and regional authorities led to generic policy goals and targets being translated into conflicting sectoral implementation strategies across development planning (for housing, industry and services), electric charging infrastructure and incentives, and upgrades to the electric grid. Developing solution options to this issue necessitates understanding why different people travel, how and where they travel and therefore when and where they might charge their (future) electric cars.
Addressing it did not require extensive sensor deployment for data collection, or the development of ‘single-source-of-truth’ digital twin technology – instead, we could draw on existing available data (e.g., census and employment data) and models (e.g., land-use and transport models). The research team developed a small ‘module’ which served to integrate previously unconnected models and data sources. The exercise concluded that a potentially impactful policy option would be to offer incentives for charging at home and/or disincentives for charging (and/or parking) at workplace for electric car drivers, given travel patterns, the locations of housing, services and employment centres, and electric infrastructure upgrade needs and costs.
Conclusion: Working effectively with digital twins?
So what does such a socio-technical perspective imply in terms of working with UDTs in (local) government? Working effectively with digital twins may, in fact, require more collaborative working both across and between local and regional authorities, as well as with technology and data product designers – as opposed to joining the digital (twin) hype. Collaboration can also contribute to learning and skills development, beyond technology design. Re-establishing some specialist technical competencies through extensive collaboration (which may have been lost in local government in the last few decades) can in turn help developing confidence and competence in commissioning digital (and/or AI-powered) tools, and understanding the impact and implications of their adoption.
If you have any comments or would like to discuss any of the above, please feel free to get in touch via email ([email protected]). If you would like to read more on using a socio-technical perspective to design and implement digital twins for cities, or explore other use cases, you may wish to consult our recent book on Digital Twins for Smart Cities: Conceptualisation, Challenges and Practices.
Timea Nochta is a Lecturer at the Institute of Local Government Studies (INLOGOV) in the Department of Public Administration and Policy, at the University of Birmingham. Her research focuses on networks and governance in urban policy and implementation in the context of technological change, especially decarbonisation and digitalisation.
A year’s gone and I’ve been given the OK to start year two of my PhD, but what have I achieved? Three passes in the taught modules on social science research and piles, nay heaps of reading.
And have I learned anything? That fairness is a complex subject. It is one of a number of moral behaviours that humans (and some other animals) have evolved over deep time to improve cooperation within groups. It’s innate, like language ability, and like language ability conceptions of fairness can differ depending on upbringing and life experiences. You can change your notions of it too although the chances of that recede as you grow older.
Does any of this relate to local government? I plan to look at councillors’ views on fairness; to see how they vary within and across persons in reaction to different case examples, ones they might typically come across in their daily interactions; all treated with confidentiality of course.
Opinions on fairness are usually made very quickly, within a second, and in any group of councillors (past and present) you can be sure that some will react one way and some another.
There are many realms on planet fairness: equality, merit, equity, opportunity, process, power and rights to name a few. Each has different sensitivities and opportunities for disagreement. My working model is that people will respond differently to the same situation due to their diverse backgrounds or assumptions; some will immediately fly off to one realm whereas others will jump to another. Some will be talking merit and just deserts whereas others will be thinking equality. This can lead to profound divergence over perceptions of fairness of a proposed policy or decision.
In local government much emphasis is placed on fairness of process. Areas of responsibility like social care, licensing and planning for example will have policy, and a decision based on policy is deemed fair if due-process has been followed; meaning no bias and a right to hear about and state one’s case. Public acceptance relies on a ‘fairness heuristic’, a natural mental shortcut, where one assumes fair treatment as long as the process followed is fair. Most research studies, but not all, show this heuristic. But is this fair? Firstly, local government policy can be set many years earlier, in different economic or political times, long before it is used to guide decisions. And secondly, was the policy making itself fair or was it dominated by large organisations or outdated assumptions.
The academic study of fairness has extra complexities…the term ‘equity’ is understood differently by those working in psychology (and business) to those in education and health. To the former it means merit; with rewards and punishments proportional to effort and input. To the latter it means giving a helping hand to those that need it. As humans we engage with both meanings.
Fairness is a field rich with research opportunity – too much for me to test them all. So in the coming year, once I have finished the readings, I need to discuss which areas might be of interest to councillors and create some examples for discussion in interviews and focus groups.
This is all with an aim to do what? That’s dictated by the results. For example, if it is discovered that there are some fairness situations which are more likely to trigger discord then, perhaps, adding more context and creating opportunity for discussion and reflection before councillors take a view might lead to better, fairer and more efficient decision making; especially when discussing mitigation of harm to affected residents or businesses.
Clive was a Bristol City Councillor and author of the book of his experiences, After The Revolution. He is entering Year 2 of a PhD at the University of Bristol. He blogs at https://sageandonion.substack.com/ and can be contacted at [email protected]
Right – we, meaning I, must start with a dilemma declaration. How to deal with a major national news item – “Birmingham City Council declares itself bankrupt” – the consequences of which, as a long-term Birmingham resident and ratepayer, will affect you personally and about which in the distant past you might well have been invited to opine seriously and professionally. Yes, carry on being retired and/or pretend you’re still on your hols.
Obviously, I’ve chosen an alternative route, emphasising background and context and stuff that might just provide some clarification, or at least updating. And, if it seems frivolous, tasteless or just indulgent, I apologise. Blame me, not the editor.
I’ll start, as it’s in the intendedly eye-catching title, with numerology – the study of the hidden, divine or mystical meaning of numbers. Even if you’re not into it, you’ll quite likely have come across ‘angel numbers’, aka ‘lucky primes’ – sequences of digits that supposedly bode well and make you feel good. Or, as the ologists put it, messages from the spiritual universe offering insight, wisdom, and directionality – three-digit ‘lucky primes’ usually including 127, 151, 163, 193, etc.
And which bunch of local government personnel, more than most, could benefit from having such character traits built into their job descriptions? Section 151 Officers, of course; aka Chief Finance Officers (CFOs) – those required by Section 151 of the 1972 Local Government Act to arrange and take responsibility for the proper administration of their local authorities’ financial affairs.
Just check out the numerologists. “The energies of number 1 combined with the vibrations of number 5 … a sign from the divine realm that you need to be strong, act as a leader, and be in control of your future life …” etc. etc.
The only problem being that, with a bit of searching, you can get similar hokum for almost any three- or four-digit number. So, somewhat to my disappointment I admit, no fiddling whatever would have been required of the Office of the Parliamentary Counsel – the people who actually draft our laws – to ensure that these matters would be dealt with by Section 151 of the 1972 Act. Excepting possibly the Satanic 666, which would make the Act impossibly long anyway, almost any three-digit number would have served.
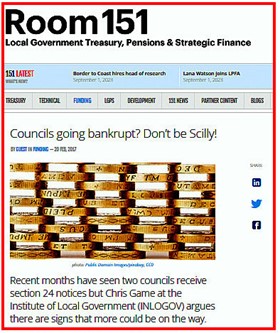
I knew this back in 2017, but I’ve habitually kept a vague look-out for any published follow-up from my INLOGOV blogs and admit that I was quite chuffed when a few years ago one was picked up and passed on by Room 151 – the “online news, opinion and resource service for local authority Section 151 and other senior officers covering treasury, pensions, strategic finance, funding, resources and risk …”.
Chuffed too to that, albeit over a lengthier time period than I was envisaging, the broad thrust of my argument of more being on the way has proved to be accurate – a somewhat nerdy argument, admittedly, that can certainly be made even nerdier, but that, for current blogging purposes, can also be tolerably summarised in a few sentences.
So here goes! If a council’s Chief Finance/Section 151 Officer (forever male, of course, in the 1988 LG Finance Act, although Birmingham’s current Interim Director of Finance happens to be Fiona Greenway) reckons his council’s expenditure is likely to exceed available resources, he issues a Section 114 Notice prohibiting any new spending apart from that funding statutory services and existing contractual obligations. OK, geeks, they’re technically ‘Reports’, not ‘Notices’, but that really, really isn’t the serious issue.
It’s a situation in which things are pretty obviously and publicly getting out of hand – current spending way over budget, reserves virtually exhausted, no imminent solution. The alternative, however, is worse: Section 24 of the Local Audit and Accountability Act 2014, or washing your dirty linen in public – the council’s EXTERNAL auditors appending a Section 24 ‘Recommendation’ to their Annual Audit letter, “copied to the Secretary of State”.
Which may sound chummy, but, I suggested, was “the bullet-shaped chumminess of a Mafia ‘message job’”: very nasty, and rarer even than 114 Notices – historically. Yet – and this is what prompted that 2017 blog – in the space of two months two Section 24s had been issued, to councils at the very extreme ends of the council scale spectrum: the Scilly Isles and Birmingham, the latter’s then Labour Leader, Cllr Sir Albert Bore, describing it as “the most concerning audit letter” he’d seen in his 36 years as a councillor. For the record, though, and without further explanation, that’s the last you’ll read of them in this particular blog.
The distinctions between the 114/24 courses of action were interesting and debatable, but you didn’t have to be a terribly nerdy follower of local government finances to see the probable beginnings of a trend, so it was pleasing to have been reckoned insightful by the serious pros in Room 151. Especially when the trend didn’t gather pace as quickly and widely as I speculated it might.
However, given the way local government finance ‘works’ in this country, particularly under Conservative administrations, it was only going to be a matter of time, and gradually the signals became unmissable – accelerating in quite a big way with (then Lab) Croydon LBC in late 2020, who issued not one but two s114 Notices in successive months, having again failed to balance its budget in the permitted 21 days of grace. Understandably, it prompted a Commons Inquiry by Clive Betts’ ever-watchful Local Government (sorry – Levelling-up, Housing & Communities) Committee.
Slough BC (Lab then, C/LD now) was next in July 2021, despite having been one of eight councils granted “exceptional support” the previous year, as Ministers became increasingly concerned at the adverse publicity generated by threats of councils ‘going broke’.
Come December and Cumbria’s Copeland BC (Lab then, since abolished and incorporated into Cumberland) was reported to be “in Section 114 territory”, but was soon overshadowed by (Lab) Nottingham City Council’s unlawfully diverting cash from what should have been a ring-fenced Housing Revenue Account to ‘General Funds’ – an ‘accounting error’ which personally I found extraordinary, since it’s one of the few bits of tekkie lg finance that even I know. And it dragged on.
2022 saw serious acceleration. In May Northumberland Council (Con)issued a s114 for unlawful expenditure, including allowances paid to the council’s Chief Executive. It was possibly the case generating least sympathy for the beleaguered council, whose elected members and officers went public with their mutual distrust – not the only such example, but probably the bitterest.
Towards the end of 2022 it became clear how desperate the situation – or at least the search for commissioners available to ’intervene’ – was becoming, as returning Local Government Secretary Michael Gove sought to launch anticipatory “turnaround programmes” short of sending in commissioners – ‘risk-mitigation directions’, in Govester jargon.
Not in time, however, to prevent Croydon LBC (NOC) issuing its third s114 in three years, and Thurrock Council (Con) having the courage/desperation to report that it would require “exceptional support” from Gove’s Department “over a number of years … to stabilise our financial position and give us time to have balanced budgets.”
At which point – after an obviously uplifting Christmas and New Year – “Whitehall officials”, in the person of Jeremy Pocklington, Permanent Secretary of the Department for Levelling Up, Housing and Communities (DLUHC), had the confidence/nerve/effrontery to announce to a Select Committee that even at the time sounded, well, brave.
As reported in The MJ (Jan 10th), “Whitehall officials are not expecting councils to issue further Section 114 notices in the coming weeks … our assessment, looking at the sector as a whole, is that the financial position is sustainable … strengthened by the additional resources made available in the Autumn Statement.”
Apart, that is, from the nine councils within the Special Interest Group of Municipal Authorities (Sigoma) who warned last week that they could issue a Section 114 notice by 2025; Stoke-on-Trent City Council (Lab) that announced this week that it is on the verge of bankruptcy … oh yes, and Birmingham.
Chris Game is an INLOGOV Associate, and Visiting Professor at Kwansei Gakuin University, Osaka, Japan. He is joint-author (with Professor David Wilson) of the successive editions of Local Government in the United Kingdom, and a regular columnist for The Birmingham Post.
“Things from the past you’ll never see again”. I came across a listing of these recently, and they were – well, moderately interesting. More so, anyway, than the accompanying “trends that have unfortunately returned” – pleated skirts, corsets, and structured vests, whatever they were.
The never-see-agains included smoking adverts, bubblegum cigarettes, and rotary push lawnmowers – to which I might easily have added “The Barnet Graph of Doom” as at least a never-expected-to-see-again.
It was a visual aid devised a dozen or so years ago primarily for the councillors of the London Borough of Barnet. It would come, however, to be associated with/appropriated by Birmingham City Council, and something with which some INLOGOV colleagues were so taken that it was discussed and illustrated in these pages not once but repeatedly – by, inter alia, me in May 2012 and January 2013 and the Institute’s then Director and this blog’s progenitor, Catherine Staite, in December 2012 and October 2013. Indeed, as Catherine notes in that second blog, it at least part-prompted an INLOGOV ‘book’ or, more accurately, Discussion Paper.
Impactful at the time, then, but at least not prominently, I presumed, over the ensuing decade. Certainly I, though at best semi-detached from these matters nowadays, was genuinely surprised to be confronted by its reappearance in a recent Financial Times (indeed, its double reappearance). Somewhat less so that it was credited entirely to Birmingham City Council, with Barnet getting, as my mother would have said, nary a mention. Which justifies at least a brief résumé, and for more senior readers a bit of reminiscence.
Some 15 years or so ago the very Conservative Barnet LBC acquired the not entirely flattering moniker of ‘easyCouncil’ – that precise orthography/spelling, though frequently ignored in the media, being arguably the policy’s most appealing attribute. With its stray upper-case C intendedly referencing the easyJet business model that inspired the council’s almost boundless outsourcing drive for no-frills efficiency, it embraced pretty well all services, from reduced-size waste bins and privatised street cleaning to limited ‘personalised’ adult social care budgets.
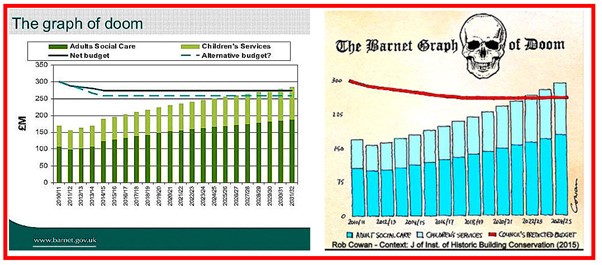
Improved and cheaper services were obviously the aim, but senior officers foresaw that the sheer scale of demographic change – more children, more elderly – would in any foreseeable future take up an unmanageable proportion of the Council’s increasingly constricted budget. “No libraries, no parks, no leisure centres – not even bin collections”. Hence the original Barnet Graph of Doom. The one on the left of the illustration, that is – the other, pleasing if more alarmist one, being a public ‘reminder’ tweeted a few years later, just as the social services budget was seriously taking off as forecast.
The Barnet graph, described at some length in my first blog and more summarily by the Guardian’s Public Services editor, David Brindle, started life as part of first a PowerPoint, later video, presentation used by the Council’s Chief Executive, Nick Walkley, to:
“focus the thoughts of colleagues and councillors … In five to seven years we get to the point where it starts to restrict our ability to do anything very much else. Over a 20-year period, unless there was really radical corrective action, adult social care and children’s services would need to take up the totality of our existing budget.”
The tone, as Brindle noted, was deliberately alarmist, with the policy making no provision, inter alia, for Barnet’s anticipated rise in income through regeneration schemes. As an illustrative device, though, it was hugely effective. It featured regularly in local government media, and also in presentations by the late Sir Bob Kerslake – then Permanent Secretary at the DCLG, and whose outstanding career in both central and local government was fulsomely recounted following his recent death.
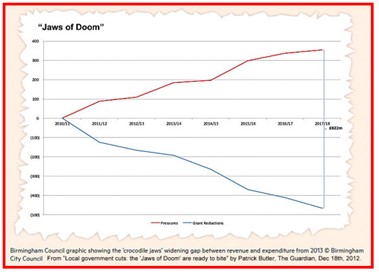
Alarming, yes, but “Where are the jaws?”, I hear you ask – and, of course, there weren’t any, yet. They were Birmingham Council’s contribution when it took the idea over and “simplified/dramatised” it by, as Patrick Butler put it, again in The Guardian, projecting “a ‘budget pressures’ line rising steeply to the top right of the grid, and a ‘grant reductions’ line crashing to the bottom right.” It featured prominently as a ‘Jaws of Doom Graph’ in the council’s 2013 Budget Consultation document, and could indeed resemble, as Butler suggested, “a child’s depiction of a shark, or crocodile, about to bite its prey. Lunch, in this case, appears to be local government itself.”
In my January 2013 blog I sought to address the question of whether the ‘doom-mongering’ was entirely fair: Were “Birmingham and urban councils generally, or Labour councils, or the country’s most deprived areas, being particularly harshly treated by the government’s grant funding cuts?”
Which, you’ll be relieved to learn, I’ll not be bothering you with here – not least because, as already noted, for the vast bulk of the past decade I’ve personally given these particular ‘Jaws of Doom’ and their graph scarcely a passing thought. Now, though, I wonder whether that’s simply another consequence of a retiree’s detachment from the daily concerns and parlance of local government personnel. Could it be that this is what today’s finance officers jaw about, as it were, down the pub of an evening?
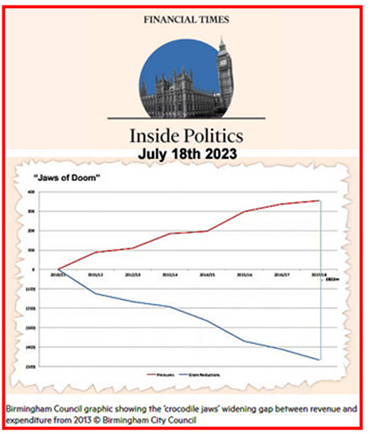
For suddenly there it was, weeks before the journalistic ‘silly season’, and in ‘The Pink Un’ – no, not Norwich City FC’s newsletter, but the albeit self-styled “worldʼs leading global business publication”: “The Jaws of Doom” graph in its original glory, and not once but twice. First, in a kind of editorial intro by Associate Editor, Stephen Bush, commending to readers William Wallis’ “excellent piece … featuring this alarming chart [shown on the right below] about the … ‘jaws of doom’ facing local authorities”. And then Wallis’ article itself.
As you’d expect, it’s a good summary presentation – that I’d certainly be recommending to students, if I still had any – the thrust of which is that:
“for more than a decade, local authorities in England have been sacrificing services and staff to what they call “the jaws of doom” – a reference to a graphic produced by Birmingham city council to show worsening budgetary pressures, that resembled a crocodile’s mouth.
Between rising demand for social care and other essential services, and the dwindling funds councils have received to provide these, discretionary spending on everything from libraries to youth clubs has already been eaten up.
Although local authorities won a better than usual financial settlement for 2023-24, 9.4% up on the year before, inflation running at 8.7% is eroding any benefits.”
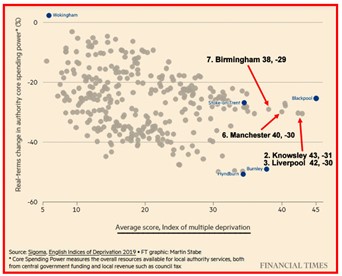
And, having already well exceeded a thousand words, that’s where I’ll stop … though not before sharing the interesting and, more importantly, interactive graph of Sigoma’s English Indices of Multiple Deprivation also included in Wallis’ article – not new, so doubtless familiar to some readers, but to me unfamiliar, informative (see added results), surprising in places, and, I felt, worth sharing. It made me (almost) sad not still to be lecturing and so able to play with it in public, as they say!
Chris Game is an INLOGOV Associate, and Visiting Professor at Kwansei Gakuin University, Osaka, Japan. He is joint-author (with Professor David Wilson) of the successive editions of Local Government in the United Kingdom, and a regular columnist for The Birmingham Post.