Inter-municipal Cooperation is the key to better environments in our cities.

Victor Osei Kwadwo

The 2021 United Nations Climate Change Conference (COP26) aims at “Uniting the World to Tackle Climate Change”. While the technical aspects to addressing climate change is more evident in the goals of COP 26, it is time attention is equally paid to the governance of climate change at the metropolitan scale made up of our major cities.

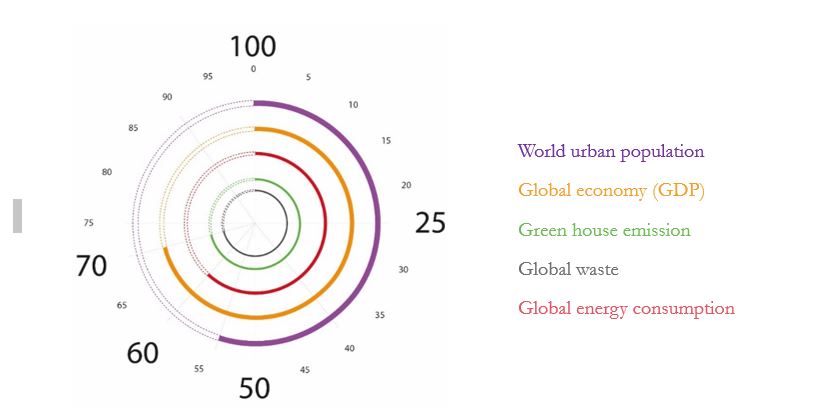
Due to rapid urbanization, the world is increasingly becoming metropolitan. Cities have expanded outwards and have become more interdependent with their immediate peripheries. Cities occupy only approximately 2% of the world’s total land yet host 54.5% of the world’s population. Cities are responsible for 70% of the world’s GDP, over 60% of global energy consumption, 70% of global greenhouse gas emissions, and 70% of global waste.

As cities agglomerate, the footprint and interdependence within and between cities blur existing administrative boundaries to the extent that development issues in one local government jurisdiction have spillover effects on neighbouring jurisdictions. These spillover effects have led to a call for cooperation on functional grounds, making metropolitan areas a salient scale for public policy interventions. Metropolitan areas such as Cape Town, London, Mexico City, São Paulo and Tokyo are mainly characterised by densely inhabited functional urban areas and their surrounding interconnected lower-density areas.

In the management of metropolitan areas, for instance, many cities in the USA, Greater London, Brussels, Dar es Salaam and Greater Accra, the joint provision of metropolitan-wide services or jointly addressing a cross-boundary problem is an explicit choice of local governments that make up the metropolitan area. This voluntary nature of cooperation poses a collective action dilemma when local governments have to address problems jointly.

The dilemma arises from the externalities of environmental outcomes that drive low incentives for cooperation and a high risk of free-riding. To find joint solutions to cross-boundary problems in metropolitan areas, inter-municipal cooperation (IMC) is identified as critical for better economic and environmental outcomes in service delivery. There is empirical evidence that inter-municipal cooperation saves costs but does it also improve environmental outcomes?

Governments tend to be reluctant to cooperate when environmental outcomes are at stake, and this is partly due to the limited evidence on the impact of cooperation on environmental outcomes. It is therefore important to provide an evidential basis on which local governments can justify and initiate cooperation arrangements to address environmental concerns jointly.

In a study I co-authored with Tatiana Skripka, we provide this evidence using data covering 229 metropolitan areas in 16 OECD countries. The study tests the impact of cooperation in transportation on CO2 transport emissions. We did this by estimating a three-level mixed-effects model that takes into account both national and metropolitan-specific characteristics.

The results demonstrate that if local governments cooperate, better environmental outcomes can be achieved. Metropolitan areas that worked together on transportation issues were able to reduce CO2 transport emissions.

The findings give an indication of what needs to be done to effectively fight the environmental challenge. More significantly, beyond normative predictions, the findings provide a basis for local governments to justify and pursue local to local partnerships to address environmental issues.

What we measured

We used “working together on transportation” as a measure of cooperation and “CO2 transport emissions” for environmental outcomes to estimate the impact of cooperation on CO2 transport emissions reported in 2000, 2005 and 2008 for 229 metropolitan areas in 16 OECD countries.

We accounted for factors such as the year of observation, economic status, socio-cultural, geographical, technological and governance measures such as mitigation policies, enforcement, and metropolitan structure. The factors covered both the national and metropolitan area-specific characteristics: socio-cultural conditions, level of technology, geography, and metropolitan governance structure. We used data from the OECD metropolitan governance database, the OECD Metropolitan Governance Survey, the World Bank, among others.

Key findings

We found that metropolitan governance structures, whether fragmented or consolidated, are equally inefficient in delivering reduction in CO2 transport emissions. The finding contrasts with an increasing trend of scholars advocating for fragmented metropolitan structures that favour voluntary cooperation, compared to consolidated structures that address collective action problem through coercion.

We also found that countries with a higher GDP were more efficient in reducing CO2 transport emissions. In contrast, metropolitan areas with higher GDP recorded increases in CO2 transport emissions. While national funding can dictate climate-related interventions and standards, metropolitan wealth is more flexible in taking on such obligations. As metropolitan areas are mainly production centres, investments in environmentally-friendly interventions may be more easily sacrificed at the metropolitan level for economic gains.

We further found that CO2 transport emissions increase despite the mere presence of environmental mitigation policies. This is consistent with empirical observations. For example, while the Paris Agreement has 196 Parties adopting to limit global warming to less than 2 degrees Celsius, emissions have continued to rise globally by 1.4 per cent per year on average since 2010. Environmental policy effectiveness lies in the ability of the cooperating parties to ensure widespread policy implementation and enforcement.

The crucial factor explaining the reduction of CO2 transport emissions in metropolitan areas is inter-municipal cooperation that facilitates coherence and widespread enforcement of mitigation policies. The impact of cooperation on CO2 transport emissions is magnified in metropolitan areas within countries that have stringent environmental mitigation policies.

Next steps

Inter-municipal cooperation (IMC) is critical in the governance of metropolitan areas if better environmental outcomes are to be achieved in our cities. Cooperation ensure policy uniformity, facilitates the possibility of widespread enforcement and reduces incentives for free-riding irrespective of governance structure. It is recommended that scholars and policymakers emphasise how to incentivise effective cooperation regardless of the metropolitan governance structure. Also, efforts must be geared toward uniform mitigation policies and their subsequent enforcement across local jurisdictions in metropolitan areas.

Read the full paper here

https://www.tandfonline.com/doi/full/10.1080/03003930.2021.1958785

Victor Osei Kwadwo is a PhD fellow in Economics and Governance at UNU-MERIT and Maastricht University. He has broad expertise in political science, economics, and public policy with a special emphasis on urban governance and development. For his PhD, he explores how and why independent local governments cooperation arrangements emerge to address transboundary issues in metropolitan areas.

NOC NOC! Is anybody there – or are you all botching each other?

Chris Game

NOC – that’s what this blog’s about.  It’s prompted, like many I assume, by the topic being one the author has a ‘thing’ about – only here it’s two things. There, authorial duty done: you’ve now been warned.

The first ‘thing’, I’m guessing, originated with an enthusiastic primary school English teacher, keen for as many of us as possible to pass the 11+ or ‘grading test’ that would get us into grammar school. Anyway, it was when I probably learnt the crucial distinction between common abbreviations and what most of us interpreted even then as posher/middle class acronyms and initialisms.

Abbreviations – for the benefit, obviously, of non-native English speakers/readers – are simply shortened forms of words: approx, dept, tbs (tablespoon), etc.  Acronyms are the posh, clever ones – comprising the first letters of several words but pronounced as if they are words themselves.

Most famous in these parts is obviously INLOGOV – but not, sadly, the most structurally perfect, which must be CREES.  Outside academia my favourite, because I’d bet even some police users don’t know it, is TASER – Thomas A. Swift’s Electric Rifle.

So, to initialisms, which comprise the first letters of several words, but can’t be (or are bewildering if) pronounced as words themselves – and which are regularly and incorrectly called acronyms.

Like NOC, which – whether referring to a National Olympics Committee, a prescription treatment for scurvy, or, as here, an elected body under ‘No Overall Control’ – is always pronounced, and in the case of the scurvy tablets spelt, ENOCEE.   

The elected bodies are usually councils, but strictly speaking Scotland was under NOC until recently, when the Scottish Greens’ co-leaders became ministers in the Holyrood Government, creating a power-sharing SNP-Green coalition.

It’s true that NOC sounds less alarming than OOC (Out Of Control) would be, but it’s entirely unclear what it does signify.  It’s certainly unhelpful – but worse, I’d suggest, in being a positive deterrent to trying to learn more – in metamorphosing indeed into No One Cares.

As a recent description of Kabul, as Taliban militants seized rapid control from Afghanistan’s civilian government, NOC would for maybe two days max have been fair and accurate. But not thereafter.

Nor when used for months on end apparently to describe the political management and day-to-day running of constitutionally elected UK local government councils. That, I suggest, is both disappointingly unhelpful and misleading.

Immediately following an inconclusive local election, with no single party securing an overall majority of councillors, some uncertainty – even within the council – may be unavoidable. There may well follow perhaps a fortnight’s discussions within and between the various party groups and maybe Independents before the Annual Meeting, at which ‘Who Runs the Council?’ has to be officially determined.

Whereupon there should be public clarity. If previously there hadn’t been, through no single party having an overall majority of councillors, the Council should, surely, officially announce and publicly explain the new situation – the leadership, any agreement/working arrangement between parties, Cabinet composition, and so on – ideally in the local media and certainly prominently (within a couple of clicks) on its own website.

That way it would matter less that the BBC, for instance, can’t be troubled to update its ‘Elections 2021’ statistics or even to footnote news of the actual resolutions of the 29 blackish ‘No Overall Control’ splotches and dots on its English councils map

NOC map

Still, however – and despite my having mentioned it on numerous occasions, not least in these columns – some councils don’t.  And what really p****s – sorry, incenses me is that the process and outcome of these post-NOC negotiations are not just factually informative, but frequently rather more fascinating than the elections that brought them about.

Bear with me, please, while I try to illustrate with the ‘aid’ of said map – or at least reference to it. You will observe three large blackish splotches, which you might imagine would be the three – all geographically large – county councils that have been NOC since at least the May elections: Cambridgeshire, Oxfordshire and Cumbria.

Until you note that the top splotch is on the wrong side: not Cumbria, but Durham, which you may also know ceased being a county when in 2009 it became a unitary.  It did, however, produce surely the most historic result of this year’s ‘large’ authority elections, with Labour losing overall control of the council for the first time in over a century, and being replaced by a barely hyperbolic ‘rainbow’ coalition of the Lib Dems, Conservatives, Independents, and the North East Party – led moreover by the Council’s first-ever female leader, Lib Dem Amanda Hopgood.

So, to the two central England splotches – Cambridgeshire and Oxfordshire County Councils – plus what would have been a third, had Cumbria’s election, like those of Somerset and North Yorkshire CCs not been postponed pending the outcome of already submitted unitary proposals.

In both cases the Conservatives had most councillors following the May elections, but no overall council majority. And in both cases the outcome of post-election negotiations was that the other party leaders and groups felt they had more in common with, or simply preferred working with, each other than with the historically dominant Conservatives.

And something essentially similar would doubtless have happened in Cumbria too, with the council having had a single party in majority control for just four of the past 36 years. So, when someone comes NOC NOCing on the Cumbria House door in Carlisle’s delightfully named Botchergate, they will be met not by rioting, out-of-control councillors, botching each other, but a seemly Labour/Liberal Democrat coalition. 

Likewise in Oxbridge, where they will encounter what tend to qualify nowadays as ‘rainbow coalitions’: comprising in Oxfordshire the Lib Dems (yellow), Labour (red) and Greens, and in Cambridgeshire Lib Dems, Labour and Independents. Doing indeed what voters reportedly tell pollsters they want party politicians to do: work together rather than just shout across the council chamber at one another.

Personally, in case you were wondering, I have ambivalent views about ‘rainbow coalitions’ – the terminology, I should stress, not their existence, which is almost invariably fascinating to observe. I used to reckon that, with rainbows having seven colours, a ‘rainbow coalition’ ought to comprise at least a majority – i.e. four parties or political groups.

The obvious problem, though, is that it restricts the field and would deprive many local newspaper editors of potentially appealing headlines.  By my reckoning – and with possibly excessive reliance on Open Council Data UK – England currently has just seven of these ‘proper’ rainbow coalitions: Durham, Folkestone & Hythe, Lewes, North Somerset, Swale, Waverley, and our own local Wyre Forest. 

Add in three-group coalitions, though, and you almost triple the number, while still lagging well behind the 32 single-party minority administrations and the 28 two-party arrangements. 

It also enables me to fulfil a tiny part of a kind of promise to INLOGOV Head of Department and blog editor, Jason Lowther – to whom I mentioned a round-up of May’s local election results, in the tabulated form I’ve sometimes managed previously, including my patented symbols for ‘rainbow coalitions’. 

For several reasons, including the sheer number of NOCs nowadays, I stalled after the ‘biggies’, but, thanks to the previously described Oxbridge tendency, there are at least a couple of rainbows.

NOC table

______________________

A more West Midlands-focussed version of this blog was published in the Birmingham Post on 9th September.

Photo

Chris Game is an INLOGOV Associate, and Visiting Professor at Kwansei Gakuin University, Osaka, Japan.  He is joint-author (with Professor David Wilson) of the successive editions of Local Government in the United Kingdom, and author of the Local Government chapter in the just published 10th edition of Politics UK (Routledge), about the only surviving sizeable (just the 780pp.) textbook of its kind.