By Chris Game
A fortnight ago, planning how to open the second part of this two-part blog, I counted the number of EU countries with national coalitions: 18. Then, in Italy, Matteo Salvini collapsed his far-right Lega Nord party’s coalition with the populist Five Star Movement, hoping to prompt and win a snap General Election. 18 became 17 – then 18 again, as Five Star agreed a surprise coalition deal – think Farage/Corbyn – with the centre-left Democratic Party.
Either way, it’s around two-thirds, confirming both that and why coalition-working comes more instinctively to other EU countries’ national politicians, with their mostly proportional electoral systems, than it does to ours. By my count, six of the EU’s current 18 comprise two parties, 11 three parties, and the Netherlands four. Four parties, four colours: Liberals blue; D66 (not a code or road, just date of formation!) blue/green; Christians yellow; Orthodox Protestants orange.
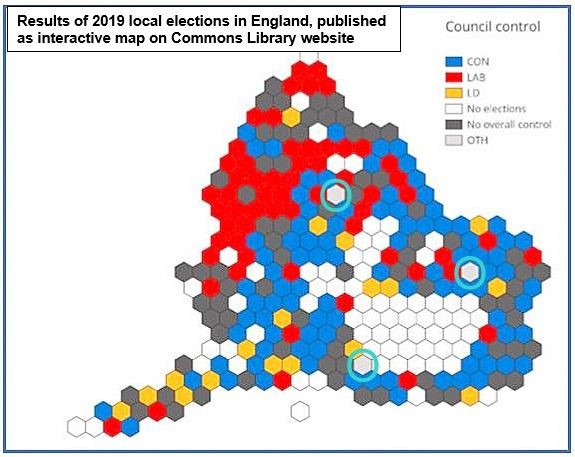
Almost a complete rainbow, and certainly sufficiently close to have prompted my own ‘Rainbow search’ among the larger-than-usual number of NOC results in our own May local elections – defined, as detailed in the earlier blog, as explicit working agreements involving at least three distinct political groups.
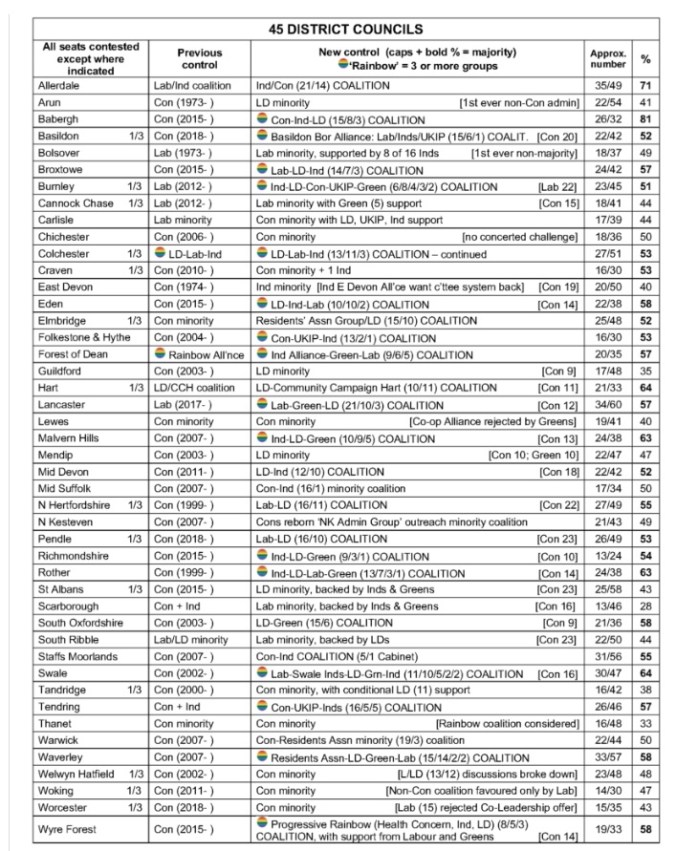
That first blog bemoaned many councils’ reluctance even fully to report the nature and outcomes of these inter-party negotiations, let alone any implications – and sought to fill the information gap in a disconcertingly large table. This blog’s far more modest table attempts to bring some order to those individual council numbers, and, I admit, to share my personal satisfaction in seeing broadly confirmed the albeit not terribly bold hypotheses that initially prompted the exercise.
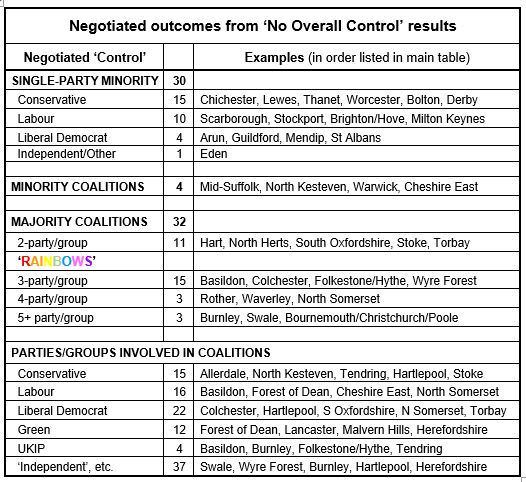
Hypothesis 1 was that coalitions, even if not labelled as such by the participating parties, would outnumber single-party minority administrations, which has certainly not always been the case even in the recent past, with both major parties being chary of ‘sharing power’ with either smaller fry or Independents. Single-party minority administrations formed after the 2014 elections, for example, outnumbered coalitions by well over two to one.
Hypothesis 2 was that ‘Rainbow coalitions’, as defined above, would outnumber two-party coalitions. There were several back in 2014 – I recall particularly the at least four-group ‘Brentwood Accord’, as well as ‘regulars’ like Southend-on-Sea, Colchester (they’re naturally congenial in Essex) and Stroud – but nothing approaching this year’s 21.
Hypothesis 3 was that the party involved in the greatest number of coalitions would be the Lib Dems, and that the Greens would be much more extensively involved than even their greatly boosted councillor numbers would suggest. Hypothesis 4, added admittedly after seeing their exceptional number of seat gains, was that ‘Independents’ collectively would feature in the most coalitions – partly because their usually smallish numbers can offer bigger parties a relatively cheap means of pushing them into majority territory.
The obvious problem in this instance of being proved so right is that behind almost every one of the 66 cases summarised in the table is a potentially recountable story, making selection somewhere between invidious and impossible. I have no structured solution, so will simply start with the biggest rainbows and stop when a tolerable word limit looms.
The first is easy. It has to be the Unity Alliance now running Bournemouth, Christchurch and Poole (BCP) council, one of the two unitaries created just this April – it having been decreed that nine (all Conservative-run) councils and 333 councillors constituted far more local government than was good for Dorset’s 780,000 citizens, who would feel much better served by just two councils and under half the councillors. Not surprisingly, Conservatives won most BCP seats in May, but, with the Lib Dems and Independents hugely increasing their votes, they fell short of a majority. Hence the Unity Alliance, led by Lib Dem Vikki Slade and comprising – wait for it – 15 Lib Dems, 8 Christchurch Independents, 7 ‘Poole People’, 3 other Independents, 3 Labour, 2 Greens, and a one-member ‘Alliance for Local Living’. Enough groups to make the Dutch jealous, and for a full, traditional Newtonian seven-colour rainbow.
Exceptional, yes, but Burnley came close, with Labour playing the grouchy role of the BCP Tories. Having only narrowly lost their majority on the 45-member council, the 22 Labour members hoped to out-organise the disparate and less experienced ‘opposition’ at the full council meeting vote and hang on to the leadership. Bad mistake. First outvoted, they then declined to join a five-group coalition of Burnley and Padiham Independents (5), Lib Dems (8), Conservatives (4), UKIP – since turned Brexit Party (3), and Greens (2).
As already indicated, though, there are several councils for whom coalition government has become the norm in recent years – and for whom the instability insinuations of the ‘No Overall Control’ label are particularly misleading. Colchester is one example. A political mapping of the district will show that for most of the past 20 years it has been predominantly Conservative blue – except for the Colchester/Wivenhoe patch in the east where the University of Essex happens to be. Which accounts for the Lib Dems having generally been the largest party on the council and for the past decade having headed a Lib Dem/Labour/Independent coalition every bit as stable as most single-party administrations.
As already indicated, I have no profound conclusion or message with which to close this extended blog. So I will end with two of the numerous cases that invariably make this kind of ‘research’ worthwhile. If there were an ‘Admire the nerve!’ award, it would surely go to North Kesteven’s Cllr Richard Wright, Leader of the Conservative group which lost, by a margin, control of the council it had dominated for 12 years. Wright, however, comes from the John Cleese/Black Knight ‘Tis but a scratch’ school. Unfortunate, he conceded, but it was “a protest vote, not on local issues … about the ongoing deadlock between the national parties on Brexit.” The solution – obvious! The Conservative Group would “no longer exist”, the council would be run by the ‘North Kesteven Administration’, led by him, with Conservatives in all leading roles – oh yes, plus a couple of Independents to make the executive “more inclusive”.
Finally, one of several ‘well, you’d not have guessed that a few years ago’ outcomes. Hartlepool achieved local government notoriety in 2002 for electing H’Angus the Monkey, the football club’s mascot, as its first elected executive mayor. Stuart Drummond, for it was he, became the first elected mayor to win a third term, following which the townspeople voted to abolish the post. Whereupon Labour resumed its long-term dominance of the council – until, following a well-publicised internal personal and ideological split, the party lost its overall council majority, mainly to candidates of the recently formed Hartlepool Independent Union (HIU). Within days of this May’s election, the Labour council leader and two other Labour councillors defected to the Socialist Labour Party, the HIU formed a coalition with the Conservatives and the Veterans’ and People’s Party, and the subsequently elected Chair of the influential Regeneration Committee is … former Labour council leader, Cllr Akers-Belcher. And still there are people who reckon local government is boring!
 Chris Game is a Visiting Lecturer at INLOGOV interested in the politics of local government; local elections, electoral reform and other electoral behaviour; party politics; political leadership and management; member-officer relations; central-local relations; use of consumer and opinion research in local government; the modernisation agenda and the implementation of executive local government.
With thanks to Democratic Audit for allowing us to re-post this blog.
The views in the blog represent those of the author and not those of INLOGOV or the University of Birmingham.