Combined Authority mayors – their first 100 days

Chris Game

My recent blog, endeavouring to mark our first six Combined Authority mayors’ 100 days in office by comparing their CAs’ corporate logos, was accompanied by a regret about not offering something more substantive. Prompted partly by the recent encouragement to prospective contributors to “accompany your blog, if possible, with a photo or image”, this is an attempt to do so.

The other, completely indispensable, prompt was the Local Government Chronicle team’s recent extensive assessment of the mayors’ first 100 days. For other purposes, I tabulated some of the LGC data, which enables more to be fitted into one blog than might otherwise be possible, and also explains the tables’ West Midlands upper case emphasis.

CAmayoralsalaries

The first table is compiled from Mark Smulian’s pay analysis, showing that, dividing the mayors’ annual salaries by the size of the population they serve, the “cheapest” mayor is West Midlands’ Andy Street – his £79,000 p.a. representing just under 3p per head. The calculation formula is obviously crucial. Street’s is far from the lowest salary, but it’s nearly a third lower than Andy Burnham’s in the slightly less populous Greater Manchester. And it remains lower (2.8p against 3.4p), even allowing for Burnham’s first public mayoral act being to launch a homelessness fund, pledge 15% of his own salary towards it, and encourage others to do likewise.

More conventional comparisons – based, say, on the CAs’ budgets – are difficult, since, beyond their Investment Fund and transport grants, we’ve little idea of what they’ll eventually be. So, for what it’s worth, by the same measure Sadiq Khan costs Londoners 1.7p p.a., and Birmingham City Council leader, John Clancy, costs me 6p. Which is only fractionally less than will WMCA chief executive, Birmingham-born, -raised and -university educated Deborah Cadman, both highly regarded and highly rewarded.

Before venturing further, it’s worth emphasising how arbitrary this 100 days business is. Good politics for the guy who coined the now gimmicky cliché: US President Franklin Roosevelt in 1932, already New York Governor, campaigning for about the most powerful executive office in the world on the measures required to deal with the Great Depression. But tough for, say, Tees Valley’s Ben Houchen – five opposition years as a Conservative Stockton-on-Tees councillor, and expecting, probably up to election day, to continue running his sporting goods business, rather than a CA comprising entirely Labour-run councils; or Tim Bowles, similarly a backbench councillor in South Gloucestershire, before heading a West of England CA with even less certainty about its identity than the West Midlands.

Moreover, personal experience aside, it’s simply unrealistic to expect in barely three months a substantial record of policy achievement – in a completely new office, with a skeletal organisation, in which personally the incumbents can’t, Trump-like, sign daily executive orders, or indeed actually DO a great deal. One thing, however, they can be expected to do is to staff that skeletal organisation by making top appointments. In the West of England and Liverpool City Region they haven’t, and in their differing ways both seem concerning.

CAMayors100daystable

In the West of England, it seems they’re simply slow to emerge from – or possibly even get into – what Mayor Bowles terms ‘start-up mode’. It’s easy – though here, as I’ll suggest, possibly misguided – to question the real-world value of some of the other measures in the table: the ministerial hobnobbing, press releases and suchlike. But to be eating the dust on everything – even the “notable mayoral achievements” were suggested by me! – and still apparently unclear on even your CA’s eventual organisational size, doesn’t look good, either to councillors or an already sceptical public, whom Bowles has already cost over 2p a head.

In the now six-borough Liverpool City Region – as opposed to the fomer five-borough Merseyside Met County Council, which is perhaps part of the issue – the problem seems more obvious. It’s dissent: personal, political and geographical. First, there’s the evidently ongoing power struggle between Liverpool mayor Joe Anderson and metro mayor Steve Rotheram, dating back at least to the latter’s victory over the former in the battle for the metro candidacy. Then there’s the inter-borough stuff, with St Helens most openly but probably others too continuing to question the whole CA-based devolution exercise as “set up to help the cities. The councils who align with Liverpool can control things. The whole concept is flawed.”

The concept’s creator, George Osborne – and no doubt Mayors Rotheram and Burnham – would like Theresa May to revive his Northern Powerhouse project by announcing at either the Conservative Conference or in the Autumn Statement some version of HS3, linking Liverpool to Manchester, Sheffield, Leeds and even Hull. But, with these cities having not one Conservative MP between them, it seems, for this PM, an unlikely priority.

And here those listed ministerial meetings surely do mean something – most obviously that “the ministerial access and contact with senior echelons of government that the mayors have been afforded is more than council leaders and chief executives would normally expect”. And while his defeated Labour opponent Siôn Simon may label Mayor Street as “Tory London’s man in the West Midlands”, in this case it was the Tory Minister who did the calling: Business Secretary Greg Clark, who, in person and in this very university, delivered the Government’s confirmation of a second devolution deal.

In doing so, moreover, Clark kickstarted a policy affecting potentially the whole of English local government that for the previous 12 months seemed almost completely to have stalled. For that reason alone, and with due acknowledgement of Andy Burnham’s adept handling of the aftermath of the Manchester Arena bomb attack, and the other mayors’ early achievements in this artificially short time span, Mayor Andy Street has to be the recipient of my Michael Fish award for just possibly prompting a change in the local government weather.


Chris Game - pic

Chris Game is a Visiting Lecturer at INLOGOV interested in the politics of local government; local elections, electoral reform and other electoral behaviour; party politics; political leadership and management; member-officer relations; central-local relations; use of consumer and opinion research in local government; the modernisation agenda and the implementation of executive local government.

The fairness (or otherwise) of the 2015-16 local government finance settlement

Chris Game

In choosing to announce the 2015-16 local government finance settlement just eight days before Christmas, ministers presumably hoped – as, indeed, I’d expected – that the argument about the presentation of funding and spending cut statistics for local authorities, both collectively and individually, would have died away by mid-January. However, it hasn’t, which is why I too am returning to the topic, which had its importance re-emphasised several times over the past week. First, Paul Woods, until recently Newcastle’s long-term and respected Treasurer, expressed in a Local Government Chronicle column (13 Jan.) his disappointment at the widespread:

“Acceptance being given to a low 1.8% spending power cut, as opposed to the more realistic analysis by the Chartered Institute of Public Finance & Accountancy (CIPFA) of a 6% cut. A truly independent and objective analysis of the settlement … would be unlikely to conclude that spending power has only been cut by 1.8% … [or that] as the government has claimed, the settlement is fair to north, south, urban and rural areas”.

That last ‘claim’ was a direct quote from the opening paragraph of an article that Local Government Minister, Kris Hopkins, had evidently felt it necessary to write for the same magazine (LGC 12 Jan.). Not surprisingly, it largely reiterated points from his settlement announcement – including that “councils facing the highest demand for services continue to receive substantially more funding … than authorities facing less pressure”, and that, for pooled budgets like the public health grant, “it would be perverse not to consider [all] the money as part of the funding available” to local authorities, including that actually spent by the NHS. Then, last Friday, we had the open letter from Rob Whiteman, CIPFA Chief Executive, to DCLG’s new Permanent Secretary, Melanie Dawes. After congratulating Dawes on her appointment, Whiteman attempted quite a barbed lecturette on “ethics in government”, including the need for “greater clarity” in the department’s public communications, as opposed:

“to the rhetoric and spin that has too often characterised the presentation of the numbers by DCLG and others over the past few years … [meaning that] … the public are being misinformed about official information and data. For example, describing transferred resources that still must be spent on the NHS as increasing councils’ ‘spending power’ in a way that under-reports their loss of DCLG grant is disingenuous.”

Given these developments, it seemed worthwhile using these columns – in which it is possible to include both links/references and a couple of rather striking graphs – to explain a bit more fully, if very definitely non-technically – what this dispute is about.

Grants and grant funding can seem both bewildering and paint-dryingly boring. But, at our combined average age of ten, my younger sister Jennifer and I didn’t know this, and we reckoned we’d cracked at least the essential principles – which was fortunate, as we and our mum were even more heavily grant-dependent than today’s metropolitan borough councils.

In our traditional patriarchal household, my father was the sole wage-earner, and he funded my mother through her weekly (Friday) ‘housekeeping’ grant, and us children through our weekly (Saturday) pocket-money grants. Opportunistically, through grandparental charity or the undertaking of ‘errands’ (mainly me) and ‘chores’ (J), we could increase our revenue spending power. But we could also suffer largely non-negotiable grant-loss, to pay for the upkeep of J’s pet rabbit, a cricket ball-broken window, or – seasonal touch here – Christmas gifts for the afore-mentioned grandparents.

The point is that, callow as we were, we understood perfectly the distinction between grant funding and spending power – unlike the sections of our media who either parroted or headlined not the finance settlement’s actual words – let alone its meaning – but DCLG ministers’ political message. ITV was typical: “the amount of funding councils will get in central government grants will be reduced by 1.8% in 2015-16”.

That’s what ministers hoped we’d hear, but for them the F-for-funding word has become as unmentionable in company as the Old English F-expletive. ‘Amount of funding’ is much too coarse, measurable and comprehensible. It’s far more refined – and cryptic – to talk of spending power (SP), particularly if you get to define it yourself. What minister Hopkins announced, therefore, was that “the average spending power reduction for councils in 2015-16 is just 1.8%”. Indeed, with “the additional transformation money the government is giving councils to improve services, this reduction falls to 1.6%” (emphases added). See, it’s getting even better. Moreover:

“Those facing the highest demand for services continue to receive substantially more funding. For example, Middlesbrough has a spending power per household of £2,441, which is £871 more than the £1,570 per household in Windsor and Maidenhead.”

This is the fifth year in which ministers have attempted this sleight of hand, and, to be fair, most of the media have caught on. Most did report that the 1.8% cut is not in councils’ grant-funding, but their spending power – though still only a minority explained the distinction and its significance.

It would have been like my father deciding in one of the 1950s’ sterling crises that we should all (kids included) be in it together, and imposing a three pence austerity cut in my pocket money of two shillings and sixpence (2/6 = 30 pre-decimal pence) – but overlooking that he’d already cut it by sixpence for cricketing misdemeanours, which I’d subsequently made up through errand work. As he might have explained, it was only a 10% reduction in my spending power, not the 12.5% grant cut I was claiming. Besides, he knew of better-off families in Westcliff (SE Essex’s nearly-as-posh equivalent of Windsor and Maidenhead) whose children didn’t even get weekly pocket money.

Following the Coalition’s ideological decision to reduce the budget deficit largely but selectively through public spending cuts, local government ministers in 2010-11 faced the problem of explaining to the public that they’d be cutting central government grant funding of council revenue spending by an unprecedented 28% in cash terms (40% in real terms, allowing for inflation) over four years, with 21% ‘front-loaded’ in the first two years.

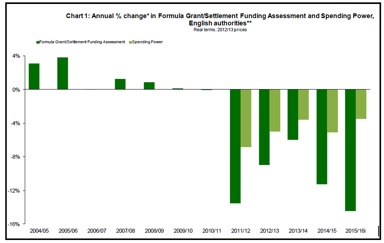
The scale of ministers’ task can be seen in a simple but powerful chart in a recent House of Commons research paper, in which the dark green columns represent the savage annual average percentage cuts in councils’ grant funding, in contrast to the generally modest increases to which they’d been accustomed. Their solution: to replace the nasty dark green columns with much less alarming light green ones.

Game1 First, they – or their civil servants – restructured the whole grant system, to make before-after comparisons more difficult. They then created their Revenue Spending Power measure, which they claimed would – by including council tax receipts, certain specific grants, and NHS social care funding – give a fuller picture of a council’s overall financial position.

Fuller, yes, but not full. Contrary to what is stated in the Government’s Plain English Guide to the 2015-16 Grant Settlement (para. 3)  income from fees, charges and investments is NOT included in SP. These are income sources likely to decline in a recession and whose addition to SP would emphasise, rather than de-emphasise, councils’ grant dependency – so nothing like as politically helpful as the contrived SP measure, which could instantly reduce a 28% grant cut to a 14% cut in spending power.

Ministers, then, view SP in the same way as Humpty Dumpty in Alice Through the Looking Glass. It can mean just what they choose it to mean – or more, or less. If, say, they excluded council tax receipts from SP, any percentage grant cut would immediately become more (bad). If, on the other hand, they could include the whole of the new Better Care Fund (BCF) – a single pooled budget to incentivise the NHS and local councils to work more collaboratively – any cut would immediately become less (good).

Yes, of course it’s confusing; that’s its whole point. Present the public with two, three or more magnitudes of ‘spending power cuts’, and the chances are we’ll either turn off altogether or hear the one that’s shouted loudest: the Government’s. For 2015-16, as we’ve seen, the Government’s figure is 1.8% – or possibly 1.6%.

Neither the figures nor ministers’ form of presentation came, by this time, as a surprise, and the Local Government Association (LGA), attempting to get its retaliation in at least simultaneously, released its own figures to coincide with ministers’ announcements. These showed first that the Government’s total funding support to local authorities will be cut by 13.7% from the 2014-15 figure. It’s that F-for-funding word again, so ministers didn’t bother mentioning it, but it’s shown as a provisional figure in the Commons chart.

The LGA’s second calculation was that, if council tax income were excluded from SP – since it’s a completely different type of income from government grant – the average reduction would be not 1.8%, but 3.7%. Third, if you also exclude the NHS’s portion of the £3.5 billion Better Care Fund and include in SP only the estimated £2 billion spent on social care services by local authorities, the arguably rather truer average reduction in councils’ revenue spending power becomes 8.8%, or nearly five times the Government’s figure.  

CIPFA’s analysis, as we’ve already seen, was different again: a 6% drop in spending power – through including council tax income but excluding ring-fenced grants and the Better Care Fund. To adapt the old Punch cartoon caption: you takes your choice of definition, but you still loses your money.

And that spending power cut, to repeat, is the average for all English local authorities – and even under the Government’s SP figures, individual authorities could lose up to 6.4% of their spending power, though others would receive a nice little increase. But, especially with a General Election imminent, ministers like Kris Hopkins want to persuade us that their settlement “offers a fair deal to taxpayers all over the country; north and south, rural and urban. Councils facing the highest demand for services continue to receive substantially more funding and have about 40% higher spending power than authorities facing less pressure.”

That last sentence really is disingenuous. Any formula or block grant comprises both a redistributive element, to compensate for local authorities’ differing needs, and a negative ‘resources’ element, to reflect their differing ability to raise their own money through council tax. Even this government hasn’t contemplated abolishing the redistributive principle altogether. But let’s see how it judges that its way of doing things offers a ‘fair deal’ to taxpayers, regardless of where they live.

Again, I’ll start personally. I pay my council tax to Birmingham City Council, whose cut in spending power, according to the Government’s figures, is 6%, close to the maximum 6.4%. Cuts for other West Midlands metropolitan authorities run from Sandwell (5.1%) and Wolverhampton (5%), through Walsall (4%), Coventry (3.9%) and Dudley (2.8%) to Solihull – the sole Conservative-controlled council and, as it transpires, the only one whose SP will increase (+0.4%).

So Birmingham’s cut is proportionately the greatest, despite, as noted in Sir Bob Kerslake’s recent highly critical report on the council for the Government, having “more poor children than anywhere else in England” (p.6), and being overall one of the most multiply deprived authorities in the country.

According to the DCLG’s ranking of England’s 326 local authorities by multiple deprivation – Birmingham is 13th most deprived, Sandwell 9th, Wolverhampton 20th, Walsall 35th, Coventry 53rd, Dudley 113th, and Solihull 212th – almost precisely the same order as that for percentage SP cuts and, on the face of it, a non-obvious operationalisation of a ‘fair deal’.

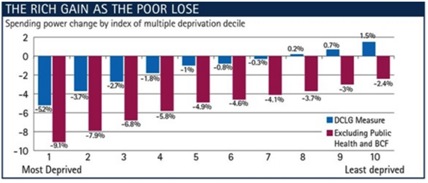
Local Government Chronicle and the Association of North East Councils undertook a similar exercise on a larger scale, again using the Government’s SP measure. As shown in the chart, “the most deprived 10% of areas face a 5.2% cut while the most affluent tenth will see their funding rise by 1.5%”.

The Rich Gain As the Poor Lose With apologies for the length of this blog, that’s what this particular local-central argument is fundamentally about – a little more than just the niceties of statistical presentation.

An earlier Birmingham-focused version of this post appeared in The Chamberlain Files Chris Game - pic

Chris Game is a Visiting Lecturer at INLOGOV interested in the politics of local government; local elections, electoral reform and other electoral behaviour; party politics; political leadership and management; member-officer relations; central-local relations; use of consumer and opinion research in local government; the modernisation agenda and the implementation of executive local government.

The LGC100: what it does and doesn’t measure

Chris Game

I used, years ago, to have a whole Pol Sci 1 lecture about power and influence, their similarities and differences. By one of life’s synchronicities, I’ve been reminded of it twice in the past week. Don’t go – I’m not about to disinter it, although I will share the six-word summary that I could, if really pushed, get it down to: Power’s a tool, Influence a skill.

Actually, I will elaborate a bit, at least to the 16-word précis: I is a form of P, but P can be exercised through means other than I. Power, in other words, trumps influence, as was demonstrated in Wednesday evening’s feverish purchasing of high-price London homes following George Osborne’s introduction of stamp duty bands.

To adapt my lecture illustration: estate agents spent possibly months trying to influence wavering purchasers’ views of the great bargain their £2 million Myleene Klass garage/apartment would represent; then along comes George and suddenly the hesitants are desperate to exchange contracts by midnight and save themselves (I think) £55,000. The Chancellor had the power to change the whole deal – as could the garage owners, had they decided to drop their price. The estate agent – yes, I can feel your pity – has, at most, influence.

Power is supposedly sexy – period, and certainly sexier than influence, which is why magazines with circulation-boosting ‘Top 100’ lists will generally try for ‘Most Powerful’, even if they have to resort to sophistry. Forbes, the US business magazine, does both the World’s Most Powerful People: Putin, Obama, Xi Jinping, Pope Francis, Angela Merkel; and Most Powerful Women: Merkel, Janet Yellen (Chair, Federal Reserve), Melinda Gates, Dilma Rousseff (President, Brazil).

I’ve no argument with any of these. The Putin vs. Obama thing’s interesting, but, if you annexe Crimea and do a $70 billion gas pipeline deal with China – well, for me that’s right up there with banded stamp duty. But then at 17 in the Women’s list there’s Beyoncé Knowles, personification of the power vs. influence problem.

Sure, have her No.1 in Forbes’ Celebrity 100 List. I’d even grudgingly accept her heading Time magazine’s 100 Most Influentials, or, to be accurate, being their Top Titan – Time fudging its listing by grouping its 100 into Titans, Pioneers, Artists, Leaders and Icons, presumably to avoid, say, Miley Cyrus embarrassingly outranking Pope Francis.

But, whatever Titans are/do, Beyoncé sings, and, even if she does release her songs exclusively on iTunes, that’s essentially popularity, not power. It’s the same with cats. The cat food Friskies’ Most Influential Cat on the Internet – ‘Grumpy Cat’ (aka Tardar Sauce, and apparently it’s feline dwarfism, not perpetual pet petulance) – has 250,000 followers, which is also popularity and could even be influence, but it ain’t power.

Which brings us to the LGC100, the Local Government Chronicle’s periodic listing and ranking of the most influential people in local government – and in which we at INLOGOV have the pleasant responsibility to declare an interest, in all senses.

The LGC100 obviously differs from the Friskies 50 index, but there are similarities. First big difference is the complete absence of cats from even the long list. Second, selection is by a nine-judge panel, with “vast experience across the sector” – apart, apparently, from that of being elected members. Third, it’s forward-looking: those most likely to exert influence over the sector in the next 12 months.

Yes, the big similarity with the Friskies 50 is that it’s very definitely about influence, in the sense that I’ve been trying to suggest, rather than power. Out of hopefully excusable exuberance, INLOGOV’s official announcement stated that our Director, Catherine Staite, had been ranked the 45th “most powerful” person in the world of local government, which wasn’t the actual citation and, given that world’s diverse and highly political character, risked being potentially misleading – prompting this intendedly explanatory blog.

As I see it, LGC could have taken the sophists’ soft option, have pretended theirs is a Power Index, but, like Time, with separate groupings for mayors and council leaders, chief execs, national politicians, civil servants and officials, consultants, commentators, etc. Which would have risked being little more interesting than the proverbial wet weekend in Wigan – which, I’d better emphasise, isn’t boring at all, and moreover has a still comparatively rare female CE in Donna Hall (No 55).

Instead, they’ve taken the braver and inevitably more provocative path of having a single sector-wide set of reputational rankings, and it behoves us to recognise that those rankings are assessments of likely future influence, and not of current or recent power.

If they were current power rankings, then, whatever we might think of him, Eric Pickles’ dramatic slide from 1 in 2011 to 15 would take some explaining – although it does remain noteworthy for at least two reasons. First, all previous listings have been headed by the senior local government minister: John Healey in 2007 and 2008, and Pickles in 2011. This time, the only minister in the top 10 is Danny Alexander, Chief Secretary to the Treasury, at 7 [The PM and Chancellor are excluded from consideration, as is the Leader of the Opposition].

Second, Alexander’s relatively high position suggests Pickles’ fall can’t be attributed entirely to next May’s election, as he’s also adrift of Health Secretary, Jeremy Hunt (11), and Greg Clark, Minister for Universities, Science and Cities (13), who may also have lost their ministerial red boxes before the year’s half through. A comparable consideration – imminent retirement – surely does, however, largely explain DCLG Permanent Secretary Sir Bob Kerslake’s apparently lowly 85. Incidentally, the actual local government minister, Kris Hopkins, may or may not be grateful that LGC have extended their list from 50 to 100, as his perceived future influence has him down at 93 – just below Watford elected mayor, Dorothy Thornhill (92), and just ahead of Nan Sloane, Director of The Centre for Women and Democracy (95).

I’ve now mentioned four ranked women and six men, and it would be good if that 40% female representation or the 40% in the top 10 were reflections of the list overall. They aren’t. There are 11 women in the top 50 and 21 in the full 100, which proportionately is lower than in either 2011 or 2008 – and, yes, I do know Doncaster’s CE, Jo Miller (27), and Centre for Cities’ Alex Jones (83) are women, while Localis’ Alex Thomson (54) is definitely male.

If those figures are disappointing, those for ethnic diversity are worse. An important new survey was published in September into the diversity of staff working in the top 5,000 leadership roles within the public and voluntary sectors. Conducted by a team headed by Trevor Phillips, former chair of the Equality & Human Rights Commission, the Green Park Public Service Leadership 5,000 survey found that ethnic diversity in local authority leadership is so low that it “almost defies analysis” – and that was before Lambeth CE Derrick Anderson announced his impending departure. Though obviously not itself a statistical exercise, the LGC100 reinforces that sad conclusion.

Important as that conclusion is, though, it would be wrong for this particular blog to end on anything but a more upbeat note. First, there’s the overall picture, with local government people not only heading the list – the Manchester City Council duo of Leader, Sir Richard Leese, and CE Sir Howard Bernstein – but comfortably outnumbering, as they jolly well should, national politicians and officials by 46 to 33. And, if you forget the messy election business and count members of the Upper House as politicians – Lords Adonis (26) and Shipley (69) – then they just pip officials by 40 to 39. No amount of fiddling, though, will prevent the biggest single group in the top 20 being, by a distance, national politicians.

Finally and closer to home, INLOGOV Director Catherine Staite’s 45th position is, by any standards, a proud achievement – for her and collectively for those academic and other Institute colleagues with whom she works (I can say that, being nowadays extremely semi-detached and, at least in that sense, no longer among that number). It doesn’t mean LGC panellists have judged her more powerful or important than, say, Birmingham City Council Leader, Sir Albert Bore (50), or London Mayor, Boris Johnson (57), or even former INLOGOV Director, Sir Michael Lyons (70), author of the recent Labour-commissioned Lyons Housing Review of the underlying causes of the housing crisis.

It does, on the other hand, seem to suggest that those panellists see INLOGOV as already, and perhaps increasingly, prominent in the local government world, and – particularly through collaborative work with other public sector and international organisations – like the recent 2020 Vision report with Grant Thornton, Exploring finance and policy futures for English local government – – an increasingly influential player.

Chris Game - picChris Game is a Visiting Lecturer at INLOGOV interested in the politics of local government; local elections, electoral reform and other electoral behaviour; party politics; political leadership and management; member-officer relations; central-local relations; use of consumer and opinion research in local government; the modernisation agenda and the implementation of executive local government.