Grubby-handed local politicians? It’s called local democracy and devolution, Sarah!

Chris Game

The BBC’s Radio 4 Today programme isn’t what Americans would call a Hot Talk show, and nicely spoken presenter Sarah Montague, even in her own fantasies, is no shock jock. So listeners must have been slightly surprised to hear her, while questioning the proposed devolution of NHS funding to Greater Manchester’s combined authority, talk of “local politicians sticking their grubby hands into the decision-making process” (07.50).

She tried laughing it off and rephrasing, but it was already out there – an unintended confirmation of the dismissiveness with which so much of our London-centric media treat sub-central government. For them, it’s apparently a world too complicated to try to understand and explain; one in which every small service variation is a product not of local democratic choice, or the Lyons Report’s ‘managed difference’ (p.3) – but a ‘postcode lottery’ and thus an easy cue with which to stir up listener and viewer outrage.

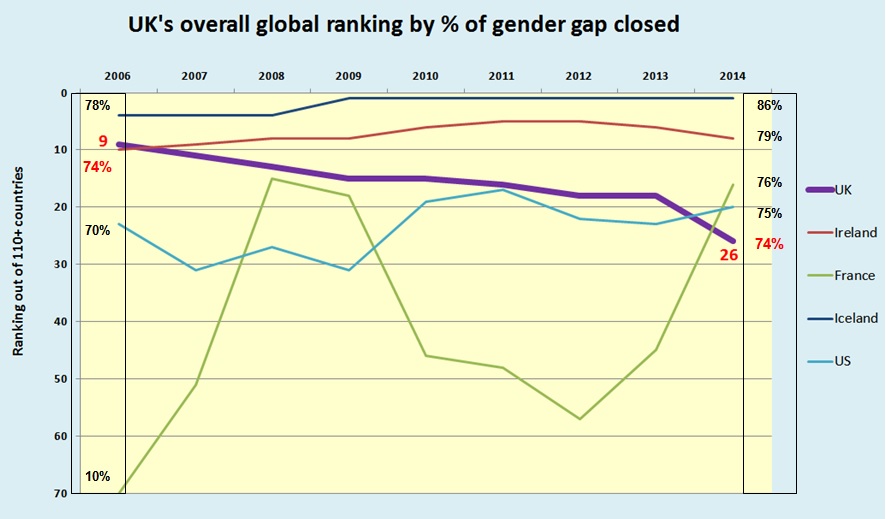
With Scotland and Devo Manc putting down serious markers and new combined authorities springing up seemingly every week, English devolution will be a major issue at and following the General Election, whether parties and voters want it or not.

Voters, we know, aren’t clamouring for it. A YouGov/Prospect poll just after last September’s Scottish referendum presented a large sample of English voters with a list of 18 specific things Britain’s government might do over the next few years, and asked them which four or five they felt were the most important.

Probably unsurprisingly, tightening immigration rules came first, favoured by 55%, then providing more money for the NHS and holding down gas/electricity prices. “Giving more powers to English regions and local councils” came 17th, just 12% according it any importance at all.  Unpromising, but, unlike England’s cricket World Cup campaign, there are some definite positives out there.

First, as many local authorities used to find when they could still afford to commission annual surveys of residents’ views, councils and councillors generally have a better image, not only than Westminster and Whitehall, but than they themselves sometimes realise.

The Local Government Association (LGA) still does undertake such surveys, its most recent, by Populus last October, broadly confirming previous findings. Around 70% say they’re satisfied with their own council, and, asked who they’d trust most to make decisions about how services are provided in their local area, 72% said councillors, 11% MPs, and 7% government ministers.

But that’s the easy bit. These encouraging levels of satisfaction and trust relate to councils’ currently very constrained tax powers and policy discretion. They quickly dissipate when it’s suggested those powers be extended or more strategic service decisions be made locally.

The YouGov/Prospect poll also asked its English respondents at which level – England-wide, regional, local – decisions on ten services should be made. For six services the choice was overwhelmingly national, including VAT and unemployment benefit rates, the core curriculum, and NHS drug and hospital treatments. Refuse collection frequency was the only decision even a bare majority (53%) allocated to local councils, and 38% wanted even that to be national or regional.

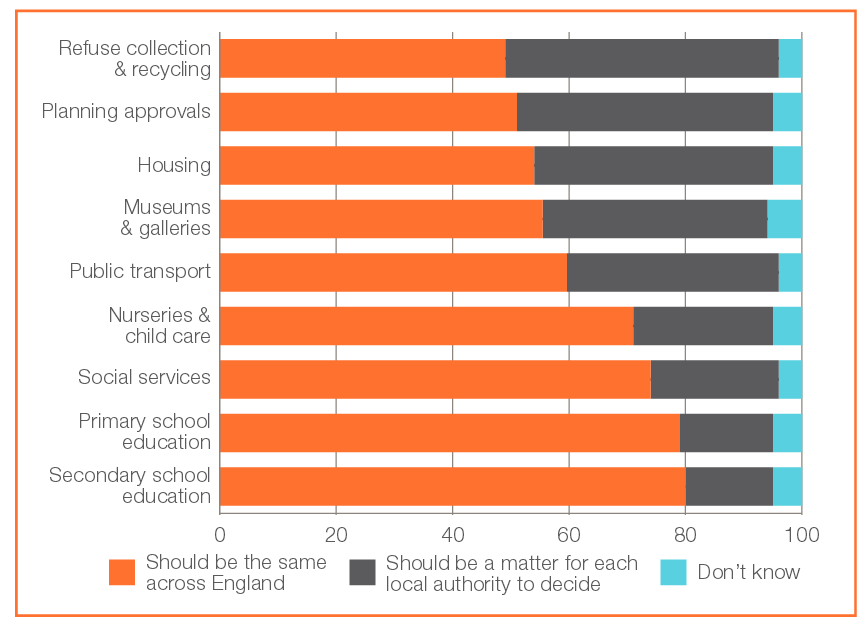
This English predisposition towards uniform national standards in almost everything can seem extreme, but it clearly runs deep and is well documented.  A 2012 YouGov survey for the Institute of Public Policy’s Future of England report asked a similar question: whether certain policies should be the same across the whole of England or should be matters for local authorities to decide.

Again, as shown in the chart, there wasn’t a single service – refuse collection, planning approvals, housing, museums and galleries – that a majority of respondents saw as a chiefly local government responsibility.

Game blog pic

It’s perfectly possible, even reasonable, to suggest that differently worded questions would elicit different answers; that, if you put respondents in a focus group, presented them with evidence, and let them think for more than five seconds before answering, they’d change their minds; even that, dammit, they’re just wrong. The fact remains that this is what they instinctively think and say, and it presents an unignorable hurdle for would-be devolvers, especially politicians. There are signs, though, that at least the height of the hurdle is adjustable.

Returning to the recent YouGov/Prospect survey, although, refuse collection excepted, there was no service on which respondents came near to preferring local to England-wide decision-making, the picture changed a bit when regional and local preferences were combined.

Put brutally, it’s ‘local councils’ – the label, the actuality, or both – that aren’t trusted with anything more than our rubbish. Combine them with ‘regional level’, and there are clear majorities for the sub-national determination of strategic policing priorities (64%), siting of new towns and major new housing projects (60%), and rules governing social housing rents (52%).

Interestingly, there were some arguably similar findings in the surveys of Londoners and ‘London business decision-makers’ by ComRes in January.  In both surveys there were majorities (56% and 60% respectively) in favour of “Local Government having greater control in London over tax levels and how those taxes are spent”.

It quickly turned out that the tax levels most respondents had in mind were limited to business rates and stamp duty land tax. Nor was there anything remotely approaching majority support for even business rates being set by ‘local borough councils’. But again, combine local and ‘regional’ tiers – in this case the boroughs and Greater London Authority/’City Hall’ – and majorities in both samples (58% and 73% respectively) were in favour of ‘Local Government in London’ setting business rates, with over a third in each case prepared to add stamp duty land tax as well.

All of which seems to suggest that, in a future of large, and in some cases almost regional-scale, combined authorities, committed devolvers have at least something positive to work with – provided, of course, media presenters keep their grubby centralist hands out of the debate.

Chris Game - pic

Chris Game is a Visiting Lecturer at INLOGOV interested in the politics of local government; local elections, electoral reform and other electoral behaviour; party politics; political leadership and management; member-officer relations; central-local relations; use of consumer and opinion research in local government; the modernisation agenda and the implementation of executive local government.

International Women’s Day and Britain’s gender gap of shame

Sunday sees the 107th celebration of International Women’s Day (IWD), and for the 102nd year on March 8. It’s a longer history than is often supposed and, reflected in its still occasionally used Leninist title – International Working Women’s Day – a more socialist one. There were conspicuous exceptions, but the West as a whole didn’t really latch on to it until, following International Women’s Year in 1975, the UN proclaimed March 8 as the UN Day for Women’s Rights and International Peace and started increasingly to badge and orchestrate it.

That’s fine for those countries where it’s a public holiday, and for those who don’t celebrate Mother’s Day until early May. We, though, link that American creation to Mothering Sunday and the traditional Christian practice of visiting one’s mother church on the fourth Sunday in Lent (March 15 this year). There’s the risk, therefore, particularly when you throw in Valentine’s Day, of IWD morphing into another of those fluffy Spring days when women get a bit of a day off, like domestic servants of yore, and maybe a meal out.

With this in mind, I thought I’d do a quick check on who was doing what in furtherance of the cause. First – partly because they’re doing it literally as I’m typing (Thursday 5th a.m.) – MPs (well, some of them) are debating IWD-related matters in the Commons Chamber, thanks to an initiative from the Backbench Business Committee. Less fleetingly, the Commons Library has produced one of its invariably informative Briefing Notes on IWD itself and women’s equality generally, with some excellent data and references, including some examined later in this blog.

I then googled ‘IWD local government’ and immediately discovered that the first week in March was ‘Women in Local Councils Week’ – which sounded really admirable, until I realised it was in Northern Ireland; oh yes, and in 2012. Not this year apparently, and nothing either on the LGA website. So it was up to individual councils, of which the most prominent (if you live in Birmingham, you’d almost guess this) was Manchester.

You have to admire them: first Combined Authority, by a distance; centre of Chancellor George Osborne’s ‘Northern Powerhouse’; a specially tailored, top-of-the-range Devo Manc devolution package; and only last week a ground-breaking health and social care spending deal.

For IWD, the city council’s website has a classy-looking IWD page, its own IWD theme – ‘Breaking Through’ (snappier, certainly, than the UN’s ‘Empowering Women – Empowering Humanity: Picture It!’), its own annual IWD awards, plus a comprehensive listing of events.

But then, in addition, it has the chutzpah to claim itself as “the birthplace of women’s suffrage in the UK” – yes, of the whole suffrage movement, rather than, presumably, of the Women’s Social and Political Union at the Pankhursts’ Manchester home as late as 1903. Even the Manchester Suffrage Committee (1867) was preceded by Sheffield’s (1851); and what about Jeremy Bentham’s persistent advocacy, the 1832 and 1835 Acts that gave at least some women the actual right to vote, etc.? So, come off it, Manchester, don’t be greedy!

There was another surprise on the IWD website itself – that, of the 1,000+ IWD ‘events’ already registered, the UK will be contributing virtually twice the number of any other single country, the US included. Not all are happening this weekend; indeed, in the date-ordered listings the first actual IWD event doesn’t appear until page 17 – “A Gathering of Goddesses, celebrating ourselves, all women and Mother Earth” at The Hurlers stone circles in Cornwall.

Sadly, one thing the Goddesses won’t be celebrating is this country’s narrowing gender gap – because it isn’t. Over the past decade, according to the best comparative data available, the UK’s overall gender gap hasn’t closed at all in absolute terms. Judged alongside some 120 other countries, the relative gap has widened, as it has on all major sub-indexes, on some of which it has widened absolutely.

The instrument that measures these things is the World Economic Forum’s Global Gender Gap (GGG) Index, the 2014 report of which is its 9th annual edition.

Being an index, its principal interest is less in actual levels than in the gaps between men and women in four main categories (sub-indexes). Economic Participation and Opportunity records labour force participation rates, remuneration, and career advancement. Educational Attainment is about access to primary, secondary and tertiary education. Health and Survival combines sex ratios at birth – to capture internationally the phenomenon of ‘missing women’ – and healthy life expectancy. Political Empowerment compares the ratios of men and women in ministerial and parliamentary positions.

In all indexes, the highest possible score is 1 (equality) and the lowest is 0 (inequality), although in my own adaptations I prefer to lose the decimal points and percentagise the proportion of the possible 100% gender gap that’s been closed.

And the UK’s embarrassment, particularly on International Women’s Day, is that since 2006 our overall gender gap hasn’t closed by a single percentage point. In my graph, 74% of the gap was closed in 2006, and in 2014 it was still 74%, our ranking having dropped from 9th to 26th.

gender graph

Meanwhile, all sorts of countries had overtaken us – not just the US and the volatile French, but from parts of the world one wouldn’t necessarily expect: Nicaragua (6th), Rwanda (7th), the Philippines (9th), Latvia (15th), Burundi (17th), Bulgaria (22nd), Slovenia (23rd) and Moldova (25th).

As already indicated, there’s not much to celebrate in any of the indexes, but naturally some make less embarrassing reading than others. In education, for example, we have a rare sub-index measure of more than 1.00 – a 1.36 female-to-male enrolment ratio in tertiary education – although it’s more than cancelled out by a 0.94 ratio for primary education.

Two sub-indexes are particularly gloomy. On none of the five Economic Participation measures is the UK ranked even as high as 45th, with ratios for career advancement of 0.52, for estimated earned income of 0.62, and wage equality for equal work of 0.69. And a Political Empowerment graph would look very similar to the overall one, the key difference being that the UK’s purple line of shame this time would signify an actual widening of the gender gap, with our ranking plummeting from 12th in 2006 to 33rd.

As we approach the election, our ratios of women in parliament and in ministerial positions are 0.29 and 0.19 respectively – compared, for instance, to Denmark 0.64, 0.83; Finland 0.74, 1.0; South Africa 0.81, 0.59; and Rwanda 1.0, 0.65. Of which the best that can be said is that at least the bar for the next lot to try to jump is set pretty low.

Chris Game - pic

Chris Game is a Visiting Lecturer at INLOGOV interested in the politics of local government; local elections, electoral reform and other electoral behaviour; party politics; political leadership and management; member-officer relations; central-local relations; use of consumer and opinion research in local government; the modernisation agenda and the implementation of executive local government.