Council tax: the new poll tax

Martin Stott

The Poll Tax riots in 1990 famously brought down Mrs Thatcher and led to the hasty introduction of the Council Tax. Twenty three years later are the reforms to Council Tax (due for implementation in less than a month) about to bring the Poll Tax back from the grave?

From 1 April, instead of the current 5.9 million recipients of Council Tax Benefit (CTB) receiving cash to cover all or most of their bill, as part of the Government’s policy to roll back and cut the cost of the welfare state the fund for CBT will be cut by 10%. At the same time the Government has localised the system, transferring responsibility for it from Government to the 326 local authorities responsible for Council Tax collection.

From April, in order to balance their budgets, councils will be faced with maintaining current levels of support and making greater cuts elsewhere, removing other exemptions. The most commonly cited is Council Tax (CT) exemption on second homes, or asking those who currently don’t pay CT or only pay a very small amount, to pay. As the date for this change looms, it seems that the vast majority of councils will opt for the latter. The calculations are made particularly tricky by the Government’s stipulation that current levels of support must be maintained for pensioners – meaning that the burden will fall entirely on the working-age poor.

The Resolution Foundation has published a report setting out exactly what all this means. If you are poor and not a pensioner, it doesn’t look pretty. Just as important though, if you are a local authority, especially one with quite a few claimants and not many second homes to tax, the financial implications look terrifying.

With 5.9 million recipients, Council Tax Benefit is claimed by more households than any other means tested benefit or tax credit. On 1 April it will be replaced by 326 ‘Council Tax Support Schemes’. The Resolution Foundation report shows that almost three quarters of English local authorities are planning to respond to this localisation by introducing less generous systems of support.

For individuals and their families the implications of this are huge. The effect of this new localisation of council tax support will see many of the 2.5 million working-age recipients of CTB who are not in employment, i.e. those who receive maximum CTB and pay no council tax, having to pay something. Depending on the wealth of the locality they live in and importantly the number of exempt pensioners, the figures are likely to vary between £100 and over £300 per annum with an average of £247pa. North Hertfordshire has already announced a figure of £322.40 pa and Birmingham, Britain’s biggest local authority, has announced a minimum charge of £200 pa. One of the reasons for the variation is the exclusion of pensioners from the charges. This immediately increases the apparently marginal 10% to an average 19% reduction for working age recipients, and in some areas with high proportions of pensioners this rises to 33%.

This is all in a context where Universal Credit is introduced in October with as yet unknown implications, but with a computer system that probably isn’t up to the job; benefits increases capped at 1% pa for the next three years – a real terms cut; the ‘bedroom tax’ just about to kick in and food banks springing up all over the country. Figures from the Institute of Fiscal Studies reported in the Resolution Foundation report show that the average working family will lose £165 pa from these changes and the average non-working family will lose £215pa. It doesn’t take a genius to see that this combination of pressures will have huge impacts on low income families and individuals, and that paying Council Tax won’t be anywhere near their top priority.

The implications for local authorities and their finances are almost as stark as those of individuals. While the average of £247pa sounds, and is, a lot for poor households, collecting £4.75 a week is likely to prove uneconomic for local authorities, especially if collection attempts go as far as hiring bailiffs or going to court. Work by the campaign group False Economy has found that more than 70 councils are resigned to seeing swaths of residents refusing to pay the tax. Harlow council is expecting to get barely one sixth of its 5,000 poor households paying up and is budgeting for a £1.14m shortfall in its finances in 2013/14. Gravesham is expecting only a 30% payment rate. Most councils are more optimistic, but the False Economy work suggests that overall, councils are expecting one third of those who are supposed to pay, won’t.

Ministers are planning to save £500m by cutting and localising the CTB bill. But even Conservative former ministers are sounding alarm bells. Patrick Jenkin, a key architect of the poll Tax, told the BBC last year:

‘The Poll Tax was introduced with the proposition that everybody should pay something….. we got it wrong. The same factor will apply here, that there will be large numbers of fairly poor households who have hitherto been protected from Council tax who are going to be asked to pay small sums’.

Faced between the choice of heating their homes (ever more expensively), feeding their families, or paying £247 per annum in Council Tax, which is likely to go first? In trying to save £500m a year, the new arrangements look like causing huge financial problems for many councils and bad publicity for Government as these councils try to chase non-payers through the courts, that only that kind of money can buy. Welcome to the New Poll Tax.

stott

Martin Stott has been an INLOGOV Associate since 2012. He joined INLOGOV after a 25 year career in local government, both as an elected member and as a senior officer.

Hilary Benn – not always so brilliant, or even believable

Chris Game

“Later, I heard that Hilary Benn had been appointed [as a Minister for International Development in a 2003 Blair reshuffle]. Lucky old Hilary. That’s the second time he’s stepped into my shoes, but I can’t complain. He’s brilliant.”

Deliverer of this unusually effusive politician’s compliment was the actor playing Chris Mullin, the former Sunderland Labour MP and junior minister, whose well-received diaries were recently adapted into one of the more surprising of recent London theatre hits, A Walk On Part: The Fall of New Labour.

Well, with due respect to Mr Mullin, his hero hasn’t been so brilliant – or even, apparently, honest – in his attempts to spin this year’s council tax figures to his party’s advantage.

On April 16, Mr Benn, Labour’s Communities and Local Government Spokesperson, posted a news items on Labour’s official website, headed ‘New figures reveal residents in Labour areas pay less council tax than in Tory or Lib Dem areas’.

Nothing remarkable there, I agree.  It could have been an early April headline from pretty well any year since Labour decided that tax-raising was an embarrassing activity for a social democratic party to be engaged in.  Still, I did wonder where the ‘new figures’ came from, as the only ones I knew of that analysed by political control were those helpfully produced by Matthew Keep in the House of Commons Library (Council Tax 2012/13 – Standard Note: SN/SG/6276).

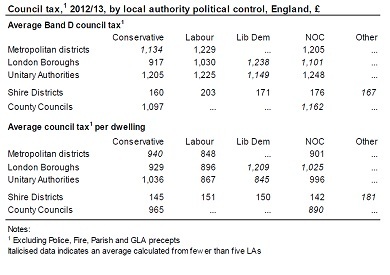
As a politician, Mr Benn sees no need to source his ‘new figures’ or the ‘research’ that produced them, but they are at such variance with those of the Commons Library – as in the table reproduced below – that they are worth comparing, or contrasting, more closely.  It may be, of course, that Mr Benn’s data are somehow more complete than those in the table, or maybe differently calculated – in which case it’s a particular shame that we weren’t informed.

Benn: ‘In Labour local authorities, the Band D council tax rate is £81 lower than in Tory areas and £42 lower than in Lib Dem areas’.
Commons Library: Wrong.  In ALL Labour authorities – all types and therefore all collectively – average Band D council tax is HIGHER than in Conservative authorities and, higher too than in Lib Dem authorities, with the exception of London borough, of which they control just two.

Benn: ‘Households in Labour-controlled authorities pay on average £220 less per year than those in Tory areas and £101 less than those in Lib Dem areas’.

Commons Library: Partly wrong. Households in Labour-controlled London and metropolitan boroughs and unitaries do pay less on average than those in Conservative areas, but the difference is much less than £220 p.a., and in shire areas those in Labour-controlled districts pay slightly more. Comparisons with Lib Dem authorities vary more by type of authority.

None of this, it should be emphasised, is surprising.  Indeed, the surprise would be if the picture painted by Mr Benn’s figures really were true. The truth, however, is that this is one of the more irritating ritual arguments in which the major parties engage every year in the period between council tax-setting and the local elections. It has become an inevitable by-product of the way in which our unreformed tax system works – as I sought to explain in this space last April.

The tax base for council tax is a ratio system centred around Band D: Band A paying 6/9 (2/3) of Band D; Band B 7/9, and so on up to Band H paying 18/9 (2x) of Band D. Councils calculate their tax base by weighting the number of dwellings in each band to Band D, and report their budget headlines in terms of ‘Council tax for council services (Band D)’.

Band D has thus become a benchmark for comparative purposes, and it is therefore perfectly reasonable that the Conservatives tend to use it – as they could with this year’s Commons Library figures – to claim that average Band D tax rates are normally lower in Conservative than in Labour or most Liberal Democrat areas.

Reasonable, but disingenuous. Not so much because only a small minority of properties (15% in England) are actually in Band D, but because, exacerbated by the absence of any revaluation since 1991, the mix of property bands across authorities and regions nowadays varies starkly. In my own authority of Birmingham 56% of properties are in Bands A and B, and just 14% in Bands E to H combined. Neighbouring Solihull has 19% A and Bs and 41% E to Hs. In the North East there are 56% Band As, in the South East 9%, in London 3%.

All of which obviously means that, to raise a certain tax income in an authority with mainly Band A to C properties requires a significantly higher Band D tax than in one comprising many E to H properties. The average bills paid by tax payers will vary similarly – being generally higher than the Band D figure in affluent and Conservative-inclined areas, and lower in poorer or Labour-inclined ones.

Hence Labour’s equally disingenuous preference for using average tax bill figures as their political comparators.  North East: Average Band D council tax £1,525; average tax bill per household £1,072. South East: Average Band D council tax £1,475; average bill per household £1,381. As the anthropomorphic Russian meercat, Alexsandr Orlov, would confirm: simples!

Mr Benn, though, wasn’t finished. His ‘research’ had also revealed that more Conservative than Labour councils had rejected the Government’s one-off grant in exchange for freezing or reducing their council tax in 2012/13. “16 Tory councils have increased council tax this year, as opposed to 15 Labour councils”.

This really is foolishness, on several different levels. First, is Benn really suggesting the 15 Labour councils were wrong: that they should have cravenly fallen in with the Government’s capping policy and accepted the one-off grant, even if they judged it detrimental to their residents’ longer-term interests? If so, it’s interesting that we didn’t hear more about it at the time, when Eric Pickles and his fellow Ministers were positively bullying Conservative councils into obedience.

Second, aren’t the numbers of councils controlled by the respective parties just a tiny bit relevant here?  The Conservatives have roughly two-and-a-half times as many as Labour, which makes the 16-15 comparison look a bit lame.

Third, if Benn really is following Pickles’ line – that it was councillors’ moral duty in these austere times to freeze council taxes – it’s presumably worth taking account of the percentage increases imposed by the respective groups of offending councils, and how close they came to exceeding the 3.5% that would have triggered a referendum.

The full list was published by the Local Government Chronicle on March 21, and, by my calculation, the average Conservative council increase was under 3%, while Labour’s average – with 8 of their 15 going for the full 3.5% – was 3.27%.

Mr Benn’s brilliance, it would seem, is more in the field of international relations than local government finance.

Chris is a Visiting Lecturer at INLOGOV interested in the politics of local government; local elections, electoral reform and other electoral behaviour; party politics; political  leadership and management; member-officer relations; central-local relations; use of consumer and opinion research in local government; the modernisation agenda and the implementation of executive local government.