Chris Game
I do love Wikipedia. It being Budget Week, I thought I’d check out what it had to say about the Red Book, as the documented version of the Chancellor’s Financial Statement and Budget Report is generally known among those to whom these things matter. As ever, it had plenty – almost 50 separate entries.
I skipped the music – Bacharach and David’s (and Manfred Mann’s) ‘My Little Red Book’; also Mao’s pocketbook of catchy quotations, Monty Python’s Big Red Book, and the notorious 1969 Danish-originated and UK-prosecuted Little Red School Book of practical advice to young people on how to do sex and drugs. ‘Reference manuals’ seemed more promising, and there are Red Books aplenty on landscape gardens, fire-service training, paediatric infectious diseases, and much else besides. But no mention of the UK Treasury, nor indeed of the Bank of England’s entirely separate ‘Red Book’, its money market manual with which the Treasury’s publication is occasionally confused. So, characteristically entertaining, Wiki, but this time, no cigar!
The Red Book I was after – Budget 2013, to give it its official title – is where you go to check exactly what the Chancellor said, or meant, and the story and statistics underpinning it all. It’s obviously primarily about the national economy, and much of it is beyond me, or at least beyond my interest. But this year I reckon there are two or three items that between them constitute the 120-point headlines for local government over the coming few years.
First, not exactly a headline, but an updated and always useful reminder for those of us seeking to educate people about the realities of UK local government: that, of every £1 we pay in tax, over 95% goes to the central Exchequer, and less than 5p or 5% to our local councils – compared to between 12% and 18% in France, Italy and Austria, and between 20% and 32% in Finland, Denmark, Spain, Germany and Sweden.
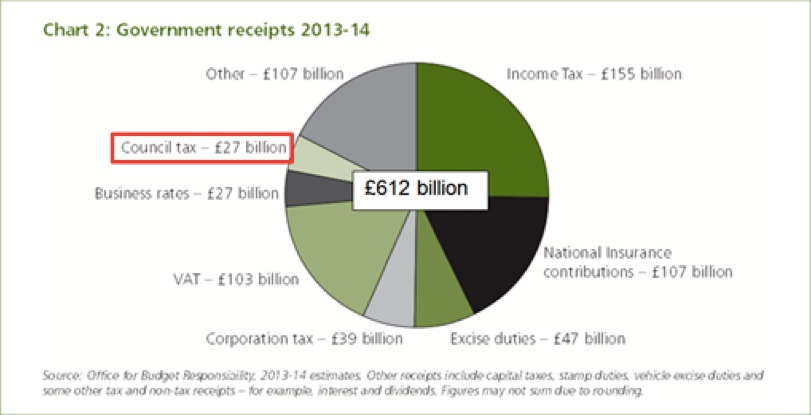
In fact, the figures in the chart on p.6 of the Red Book show that Eric Pickles’ largely effective attempts to freeze council tax have reduced its contribution to total government receipts from a figure that in 2010-11 rounded up to 5% to today’s just 4.4%. This, however, is about as low as it’s likely to go, as the inflation calculations of the Office for Budget Responsibility (OBR) are assuming a 2% annual increase in council tax from next year, no matter how much Mr P or his successors may protest.
All that means, though, is that ‘locally financed current expenditure’ will constitute a fractionally higher proportion of a steadily, and increasingly alarmingly, falling total. The immediate and upfront task of the Budget was to ‘fix the envelope’ for total government spending for 2015-16, prior to the publication of individual departmental budgets in June. But for local government I’d suggest this Budget’s real headlines are embedded in the Government’s updated assumptions beyond 2015-16:
“In line with previous policy, this Budget sets a fiscal assumption that TME [Total Managed Expenditure] in 2016-17 and 2017-18 will continue to fall in real terms at the same rate as over the Spending Review 2010 period.” (para. 1.59)
So, more of the same, for longer than we were fearing – it’s hardly good news, but alarming? Certainly, there’s no alarmism in the explanatory Red Book text, but that’s because the actual figures, and particularly those for 2017-18, are revealed only in the supplementary tables at the end. The key lines are in Table B.4 on p.103, and I’m afraid they probably require – at least for those readers a bit hazy about the precise meaning of ‘PSCE in RDEL’ – an embarrassingly over-simplified introduction to some of the jargon used by Resource Accountants and Budget wallahs.
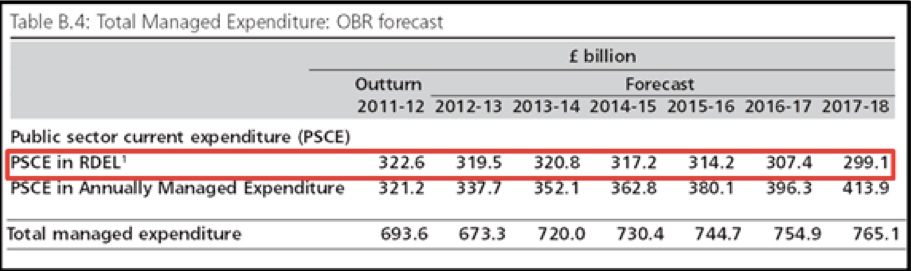
Public Sector Current Expenditure (PSCE) is divided into two categories, according to the degree to which it is controllable within three-year spending cycles by the Government departments responsible for it. For their supposedly controllable expenditure, departments must account to the Treasury against Departmental Expenditure Limits (DELs), the Resource DEL (RDEL) being current expenditure – pay, running costs – and also some non-cash items, like depreciation.
Departments are also responsible, though, for Annually Managed Expenditure (AME) – demand-led spending, like social security benefits, tax credits, central government debt interest, and, of course, locally-financed council spending – for which departments can’t be held accountable in the same way, and which therefore doesn’t form part of their DELs or of Spending Review settlements.
You can see immediately what’s been going on, and will continue to go on, and to an escalating degree, well into the next Parliament. TME will carry on rising annually in cash (though not in real) terms, solely through the AME expenditures that the Government can’t actually stop, while RDELs take all the hits – down by £3.6 billion in 2014-15, then a further £3.1 billion in 2015-16, £6.8 billion in 2016-17, and £8.3 billion in 2017-18.
Dramatic as these figures are, they don’t in themselves capture the suddenness and severity of the U-turn forced upon this controlled element of public expenditure since 2010-11. For that you need a graph, of the kind produced by the Institute for Fiscal Studies (IFS) in one of their admirable post-Budget analyses.
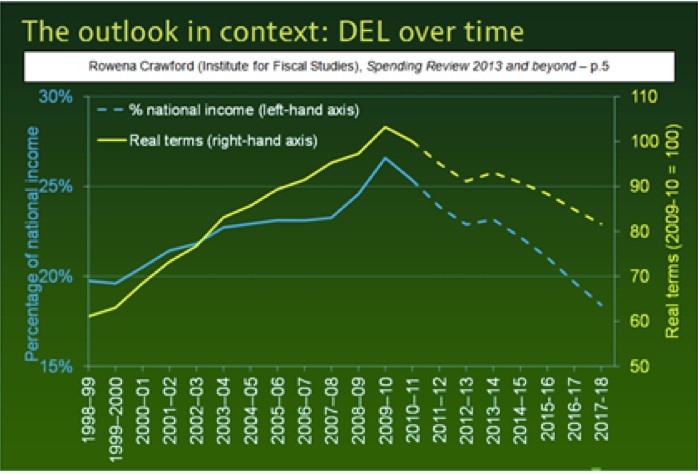
In the words of the IFS’ own summary (p.11): “Departmental spending [is] forecast to be cut by more than 18% in real terms from its 2010-11 level by 2017-18 – [that is] back to around 2002-03 level of real spending and pre-1998 level as % of national income”.
We’re still, though, talking about all departmental current spending – and in the present context misleadingly, for since the 2010 Spending Review several major expenditure heads have been and will continue to be either frozen or ‘protected’: notably, Overseas Development Assistance, ‘front-line’ NHS spending, plus spending on schools, 16-19 participation, and Sure Start. The impact of this service apartheid on what finance expert, Tony Travers, calls “the unloved and unprotected” – local government, defence, the police, fire, transport, business services – made itself felt immediately, and has been modelled through to 2017-18 in another IFS analysis.
We are looking at a real terms drop in total RDEL spending between 2010-11 and 2017-18 of 16.9%. Within that figure, though, spending on the NHS would have increased by 2.9%, on schools by 0.6%, and on the albeit modest-sized aid budget by 41.7% – while that on the unprotected remainder would have fallen by 31.5% (p.12). Local government from the outset has been among the most “unloved and unprotected” and, as Travers notes, “if capital spending becomes a greater priority, the impact on revenue spending within the unprotected part of DEL will be greater still. It now seems likely that local government … will face a real terms reduction of at least 50 per cent in expenditure over the period to 2017-18” – .
With figures like these, there is no need to speculate about the consequences of the Chancellor’s economic growth projections proving once again to be overly optimistic. Even if they’re right, the unavoidable truth is that local government as a sector and (remaining) local councils individually will be organised and will operate in fundamentally different ways from in the past, and, while there wasn’t a great deal in the Budget to cheer about, there were perhaps, again tucked away in the Red Book, some more positive headlines of what those different ways of operating might look like.
In, as it happens, the paragraph (1.58) immediately preceding the one about the Government’s fiscal assumptions beyond 2015-16, we read about the need for “ongoing reform of public services”:
“The four areas that participated in the recent Whole Place Community Budget pilots estimate that they can save £800 million over five years by implementing their plans. To support the local adoption of similar approaches, the Government is establishing a new multi-agency network and will announce plans to extend the benefits of this approach across the country at the 2015-16 Spending Round.”
Oh dear! That £800 million: so big, so rounded, so headlineable – and so suspect. Sometimes, fierce competition though there is, the Government’s own worst enemy can be itself. The figure appears to come from – though I’m fairly sure doesn’t actually appear in – the National Audit Office (NAO) review of the four Whole-Place Community Budget pilots that had been published the previous week. The report, as would be expected from the NAO, is a good one: thorough, insightful, critical, cautious, and constructive – but not shouty.
In Budget Week, however, the Government decided it needed shouty, so out came the Arthur Daley pocket calculator and added together the four areas’ estimates of potential savings – savings defined in different ways, reflecting different projects and activities, across different service areas, over different time periods (Westminster, Kensington & Chelsea – 1 year; Greater Manchester, and Cheshire West & Chester – 5 years; ‘Whole Essex’ – 6 years), and with differing degrees of assuredness. Total: £810 million; round down for luck, and you have your £800 million.
Normally, you’d run a mile from something so patently tacky, but there are two big considerations here. First, the indications are that this Government is rather more committed, at least at present, to the Whole-Place Community Budget approach than its predecessors were to similar earlier initiatives – local and multi-area agreements, Total Place, etc. In apparent confirmation of that commitment, a letter has already gone out from Local Government Minister, Brandon Lewis, asking councils to submit expressions of interest to join the new multi-agency network to share learning from the existing four Community Budget pilots.
This letter more or less coincided with an estimate from Ernst & Young that the community budget approach to pooling budgets in a local area and working across public agencies could save up to £20.6 billion over the next five years. Another magic figure perhaps, but it brings us to the second big consideration – that Whole-Place Community Budgets would seem the only game in town capable of making any significant dent in all those lost billions identified earlier.

Chris is a Visiting Lecturer at INLOGOV interested in the politics of local government; local elections, electoral reform and other electoral behaviour; party politics; political leadership and management; member-officer relations; central-local relations; use of consumer and opinion research in local government; the modernisation agenda and the implementation of executive local government.
