You couldn’t make it up – except DCLG just did

Chris Game

Did you see manager Arsène Wenger’s explanation of Arsenal’s feeble performance against Manchester City last Sunday?  While most players are galvanised by home supporters and see playing at home as an advantage, Arsenal’s apparently are scared by theirs. “They have a great desire to do well, so maybe they’re a bit too anxious that they don’t respond completely to the expectation level of the crowd.”

A strong bid, certainly, for this week’s You-couldn’t-make-it-up prize, were it not for the Department for Communities and Local Government (DCLG), who, not satisfied with inventing their own measure for disguising the severity of their grant funding cuts to councils, have now disguised it still further by double-counting. If the whole grant-slashing exercise weren’t so serious, the ineptitude really would be laughable. Ridicule aside, it can only serve to validate and reinforce the allegations of unfairness that core city leaders in particular have been making.

Nick Forbes, Newcastle City Council leader, kicked off in November, writing personally to David Cameron to complain about the ‘unfair’ impact of funding cuts on councils like Liverpool with cheap housing and therefore a low council tax base. Then on December 19th, local government finance settlement day, the leaders of all seven English core cities – Birmingham, Bristol, Leeds, Liverpool, Manchester, Newcastle and Sheffield – wrote jointly to Local Government Secretary, Eric Pickles, demanding an urgent meeting to address the “looming financial crisis” their authorities were facing.

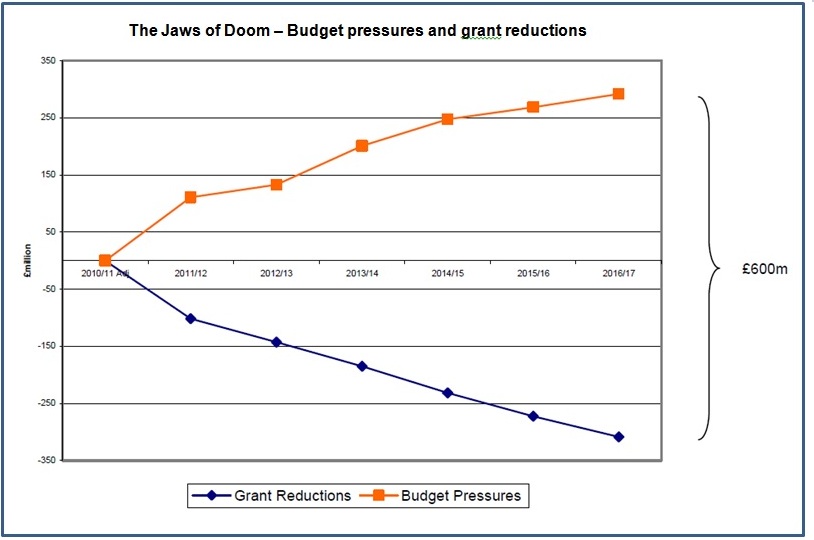
The scale of the potential crisis was illustrated by reference to the Jaws of Doom’ graph – Birmingham’s version of Barnet Council’s now famous and similarly apocalyptic ‘Graph of Doom’, produced by the London borough to shock residents, but particularly Ministers, into realising that by 2020 councils would be facing a £16.5 billion shortfall, with no money left for anything apart from children’s services and adult care.

The ‘Jaws of Doom’ graph appears in Birmingham City Council’s budget consultation document (p.8) and does indeed resemble the gaping jaws of a crocodile, attacking from stage left, but unable to swallow the monstrous £600 million budget deficit for which the council estimated, last October, it was heading – and now, following the finance settlement, closer to £625 million.

jaws of doom

This is on top of the £275 million of mainly ‘efficiency and transformational’ savings, including a 25% staffing cut, already made over the past two years, and that have brought the council to the point where the Labour administration, elected last May, claims further efficiency savings are no longer enough. The severity of the reductions in government grant will necessitate significant cuts in front-line services. Hence the budget consultation: outlining the Council’s proposed four-year savings programme, and seeking residents’ views on detailed service cuts for 2013/14, and on alternative council tax scenarios – a further freeze, a limited increase of under 2%, or a larger increase requiring referendum approval.

One question, however, that the consultation document neither asks nor, judiciously, attempts explicitly to answer is: IS IT FAIR?  So I thought I’d have a go.

Are Birmingham and urban councils generally, or Labour councils, or the most deprived areas, being particularly harshly treated by these grant funding cuts? Or was Pickles right, when he insisted in his finance settlement statement that “overall the average spending power reduction for councils in 2013/14 is expected to be limited to just 1.7% per household”, and that “concerns that the poorest councils would suffer disproportionately are well wide of the mark”?

Well, let’s start right there, with that phrase ‘spending power’ (SP) reduction – used by Pickles and his civil servants in preference to the ‘grant reductions’ quoted by council leaders and measured by the ‘Jaws of Doom’. Are they different? You bet. SP was introduced in 2010/11, when the new Government announced its intention to cut central government grant funding of council revenue spending by an unprecedented 28% in cash terms (nearer 40% in real terms, allowing for inflation) over four years, with 21% ‘front-loaded’ in the first two years.

To disguise the savagery of that front-loading, and to make before-after comparisons more difficult, the DCLG first restructured the whole grant allocation system, and then created ‘revenue spending power’ – a measure Ministers claimed that, by including council tax receipts, certain specific grants, and NHS social care funding, gave a fuller picture of a council’s overall financial position. Fuller, yes, but not full. If it really was a full, rather than politically beneficial, picture that Ministers wanted, they could have included income from fees, charges and investments. These, however, are income sources that tend to decline in a recession and whose addition to SP would emphasise, rather than de-emphasise, councils’ grant dependency – so nothing like as helpful as the DCLG’s contrived measure, which could instantly reduce a 28% grant cut to a 14% cut in spending power.

You’d think this was sufficient, but this year, it seems, they’ve really over-egged the pudding by double-counting council tax support in two separate elements of SP. Sadly, at the time of writing, the Department was refusing to help Local Government Chronicle journalists with their enquiries into how the double-counting occurred, and whether it was intentional or accidental. Either way, Pickles’ claim of an average 1.7% spending power cut in 2013/14 was clearly wrong and should have been about a percentage point higher.

Having changed the system and invented new terminology, Ministers’ next rule is always to describe funding reductions in overall percentages, not cash. This fools no one who gives a moment’s thought to how grant funding works, but then there are plenty who don’t.

Formula Grant – the general grant allocated in the annual finance settlement – is calculated in four blocks, the two key ones being Relative Needs, to compensate for areas’ differing service needs, thereby broadly reflecting economic and social deprivation; and Relative Resources, reflecting the strength of an area’s council tax base and ability to raise its own revenue. In combination, these two elements mean some councils are much more reliant on central government grant than others. The more deprived the area, the greater is its need for council services, the lower its council tax base and tax receipts, and therefore the higher the proportion of its revenue spending that needs to be funded by central grant.

Overall in 2012/13, 27% of councils’ revenue spending is funded through council tax. But that proportion ranges from averages of 16% and 22% among Inner London and metropolitan boroughs to over 50% among shire districts. Even neighbouring councils’ grant/tax ratios can differ considerably – like Birmingham’s 84% grant/16% council tax and Solihull’s 67%/33%. What can be presented, therefore, as a uniform 10% grant cut across the country means for Birmingham a budget cut of 8.4%, for Solihull one of 6.7%, but for some shire districts barely 2%. Not so uniform after all.

The reforms to specific or targeted grants have hit councils in deprived areas relatively harder still. Some grants specifically conceived for deprived communities, like the Working Neighbourhoods Fund and area-based grant, have been run down or scrapped altogether. In contrast, the Council Tax Freeze grant to councils agreeing to follow the Government’s tax-freeze policy comprises a 3.5% addition to a council’s existing tax revenues, so benefiting most those with higher tax bases. Likewise, the New Homes Bonus Scheme, funded by top-slicing the central grant to all authorities by equal proportions, benefits disproportionately those in the south, where the bulk of the building is.

Obviously, there have been and will continue to be numerous other technical changes in the grant funding system, with criss-crossing impacts on different kinds of councils. Even a year ago, though, the Audit Commission’s Tough Times report was clear that “there is a strong link between local deprivation and the scale of funding reductions”, with “deprived areas in the north, the midlands, and inner London [experiencing] the greatest cuts”.

There have been several comparisons of the scale of funding cuts across individual local authorities, among the most accessible being the Guardian newspaper’s analysis and interactive map. English local authorities were found to be facing, on average, a cut of £61 a year per person in the total central government funding they would receive between 2011 and 2014, but the range extended from over £250 per person in Hackney, Liverpool and Knowsley to North Dorset’s £2.70.

The severity of cuts correlated closely with the Government’s own Index of Multiple Deprivation (IMD), examples including Liverpool – IMD 2nd, funding cut 2nd (₤252); Manchester – IMD 4th, funding cut 5th (₤210); and Birmingham – IMD 13th, funding cut 16th (₤166). Of the 30 councils facing the severest cuts, 28 are currently Labour controlled. All of which suggests – returning to Pickles’ other bluster from his finance settlement statement – that “concerns that the poorest councils would suffer disproportionately” are not so wide of the mark after all, and certainly not as wide of it as his own 1.7%.

game

Chris is a Visiting Lecturer at INLOGOV interested in the politics of local government; local elections, electoral reform and other electoral behaviour; party politics; political  leadership and management; member-officer relations; central-local relations; use of consumer and opinion research in local government; the modernisation agenda and the implementation of executive local government.

Making Ends Meet: What Aren’t We Talking About?

Catherine Staite

Last month West Somerset District Council sent up a distress flare.  They can’t make ends meet and it is only going to get worse.  At the other end of the scale, the Leader of Birmingham City Council has announced £600m of cuts and declared that the changes which are coming will be ‘the end of local government as we know it’. LB Barnet’s ‘graph of doom’ demonstrates how rising social care costs will eat up their resources until there is no capacity to do anything else but social care and emptying the dustbins.

At INLOGOV we’ve been rather optimistic about the potential for some good to come out of the financial crisis.  We’ve been talking about how we need to build capacity, change relationships and challenge expectations – something we’re calling a ‘new model’ for public services. We are working with some very innovative councils who are embedding radical new thinking in the way that they prioritise resources and commission services. I really believe that it will be possible for them not only to survive but to thrive in this difficult climate.

Others will not be so fortunate. They may ‘salami slice’ and inadvertently lose all their innovative, creative people and therefore their capacity to change.  In some cases political and managerial leadership can’t imagine a different sort of world and so can’t act quickly enough to start building better relationships with communities, managing demand and harnessing capacity to help bridge the gap between what people need and what can be provided.  This requires a new style of local government and  very different, outward facing, political skills.

We are talking about many ways of mitigating the impact of reduced resources on the most vulnerable, but the one thing we don’t seem to talking about is streamlining the machinery of local government. Local government re-organisation – that is, merging smaller councils and moving to a world where shared services are the norm – could help to make the best use of limited capacity and save significant amounts of money but it is rarely discussed.  Many districts and some unitaries have successful shared arrangements, with chief executives and senior management teams managing up to three councils, with evident success.  Why don’t we talk about taking that further? Surely it isn’t because Mr P doesn’t like the idea.  That would recommend it to many. Perhaps it seems too difficult and painful a topic to discuss.  But if we don’t, then opportunities will be lost to make the changes in a positive way and not in a crisis, when distress flares have already gone up.

In Denmark, local government has re-organised itself successfully in recent years. Councils joined together voluntarily with their neighbours until they achieved the best possible combination of size and geography to deliver economies of scale and locally accessible services.  Perhaps we should think about doing the same thing?  If local government doesn’t take the initiative and provide its own leadership on this, no-one else will.  How can we justify the inefficiencies and unnecessary overheads of two tier areas and tiny unitaries in the current financial climate – when cuts are having a real impact on the most vulnerable?

English local government is demonstrably resilient and resourceful.  Can it also be clever, brave and altruistic?

Catherine Staite

Catherine Staite (Director of INLOGOV)
Catherine provides consultancy and facilitation to local authorities and their partners, on a wide range of issues including on improving outcomes, efficiency, partnership working, strategic planning and organisational development, including integration of services and functions.

The Barnet Graph of Doom – not new or classified, but definitely sensitive

Chris Game

A recent SocietyGuardian article on the impact of demographic change on local authority service provision by David Brindle, the paper’s Public Services Editor, produced considerable social media comment, but not apparently any actual sighting of the item that kicked the article off: the so-called Barnet Graph of Doom. Time, therefore, for an unveiling, and some demystification.

 Brindle introduced the BGoD as:

 “a PowerPoint slide, showing that within 20 years, unless things change dramatically, [Barnet Council] will be unable to provide any services except adult social care and children’s services. No libraries, no parks, no leisure centres – not even bin collections.”

Dramatic enough in itself, you’d have thought, but Brindle ratchets up the drama by seeming to imply that the Doom Graph is both new and so sensitive as to be virtually classified:

“The slide … now features regularly in presentations by Sir Bob Kerslake, permanent secretary at the [DCLG] … Whether he has dared to show it to communities secretary Eric Pickles, defender of the Englishman’s inalienable right to a weekly bin round, is unknown.”

In fact, speculation is unnecessary, as the slide in question has been in the public domain for nearly eight months now. It comes from a three minute video presented by Councillor Dan Thomas, Cabinet Member for Resources, as part of one of Barnet Council’s regular budget consultation exercises. The presentation is on both the Council’s website and YouTube, and therefore as available to the minister as it is to Barnet residents, you and me. 

Whether Sir Bob makes use of more than the single slide Brindle doesn’t say. But, unable to break a lecturer’s lifelong weakness for promising visual aids, I certainly would have done – in fact, will do so here – because I reckon the video, though brief, provides a better introduction to the causes and scale of the challenges facing all major local authorities over the coming few years than many have managed.

The video starts from the Government’s October 2010 Spending Review plans to cut total public spending by £81 billion by 2014-15, but not equally across the board. With the NHS budget (nearly 13% of the total) protected and Overseas Aid, though small, increased, the hit taken by the unprotected DCLG, and as a result by local government, would be over 28%.

The video starts from the Government’s October 2010 Spending Review plans to cut total public spending by £81 billion by 2014-15, but not equally across the board. With the NHS budget (nearly 13% of the total) protected and Overseas Aid, though small, increased, the hit taken by the unprotected DCLG, and as a result by local government, would be over 28%.

For Barnet, other things too will change.  With a population of 350,000, the borough is already the largest in London and faces further growth at both ends of the age spectrum – 17% more 5-to-9s and 25% more over-90s by 2016. There is substantial development in the west of the borough, currently requiring more reception places and in future more secondary school places. Which brings us to the Graph of Doom.

Barnet Council estimates that over the four-year Spending Review period it will lose roughly 30% of its income, requiring matching reductions in spending. The bar chart plots the predicted spending on adult social care and on children’s and family services over the coming decade – showing that, without significant changes in the way these services are provided and/or in councils’ funding, the increasing numbers it will be supporting mean that by 2022-23 it would be providing only social services, there being no money left for anything else.  Not classified information, then, but definitely sensitive.

The graph’s original purpose, it should be remembered, was to prompt Barnet residents to think about what their spending priorities would be for the immediate and medium-term future – and, no doubt, to concentrate the minds of members and officers. It was not the product of a sophisticated modelling exercise and, as its authors would surely acknowledge, it has obvious limitations.

It takes no account, for example, of future economies and efficiency savings or of increased income stemming from planned regeneration, particularly of the Cricklewood/West Hendon/Brent Cross area. On the other hand, though, it seems to assume a more or less neutral 2013 Spending Review, rather than another round of austerity measures, as currently looks more likely. In short, though not all-inclusive, its depiction of a calculably approaching funding crisis is more than ‘real’ enough to warrant serious attention from all who should be concerned.

The new Coalition Government seemed concerned – when one of its first actions was to ask Andrew Dilnot, a former Director of the Institute for Fiscal Studies, to chair a three-person Commission on the funding of elderly care and report back, with recommendations, within the year.

The Commissioners were emphatically concerned. They found the current funding system barely comprehensible, frequently unfair, and urgently in need of reform. Their key recommendations proposed:

•   capping individuals’ lifetime contributions towards their social care costs – at around   £35,000 – after which they should be eligible for full state support;

•   increasing the means-tested threshold, above which people are liable for their full care costs, from £23,250 to £100,000;

•   limiting liability for the costs of accommodation and food paid by people in a care home to £10,000 p.a.

The Commission’s full set of proposals, it estimated, would increased public spending by £1.7 billion p.a., rising to £3.6 billion by 2025 – equivalent to 0.25% of the total: “a price well worth paying” to remove people’s fear of having to sell their homes and spend almost all their wealth on care.

Ministers, particularly those in the vicinity of the Treasury, then became concerned to the point of agitation – at the capping proposal and the overall price tag. Dilnot was welcomed, but, as Health Secretary Andrew Lansley put it, as “a basis for engagement” – to be followed by more consultation, a delayed White Paper, and legislation “at the earliest opportunity thereafter”.

Whereupon the LGA became volubly concerned, with good reason. In an unusual cross-party initiative, Chairman Sir Merrick Cockell wrote to the three main party leaders on behalf of all LGA political groups, pointing out that social care already takes up more than 40% of council budgets, that demographic pressures alone will add £2 billion p.a. to these costs by 2015, and calling on Ministers to work urgently with local government in introducing radical Dilnot-type reforms.

Since then, the White Paper has been further postponed and will not address the funding issue anyway, the Queen’s Speech contained no relevant legislation whatever … and Doom gets ever closer.

Chris Game is a Visiting Lecturer at INLOGOV interested in the politics of local government; local elections, electoral reform and other electoral behaviour; party politics; political  leadership and management; member-officer relations; central-local relations; use of consumer and opinion research in local government; the modernisation agenda and the implementation of executive local government.