By Chris Game
There’s this northern borough council, generally Labour-controlled, but where in the May elections, despite only a third of seats being contested, the party’s candidates lost variously to Liberal Democrats, Independents, UKIP and Greens, and thereby its overall majority. Next day, Friday 3rd, the Council published ward-by-ward results and listed the now seven political groups, from which it was clear that none reached the requisite 50%+1.
And that was the sum of pertinent information emanating from the Council’s website for the rest of the month, apart from announcing the appointment of the new mayor – a Liberal Democrat, although there was no mention of that evidently secret and classified detail.
For any hint of how and by whom the council would be run citizens had to wait until Thursday 30th for the brief announcement of the outcome of an “extraordinary meeting of the full council” – though whether a formal EGM or merely a bizarre event wasn’t clarified. The perfunctory statement listed the five members of the new Executive. These obviously couldn’t remain secret, but, despite their appointment resulting from a multi-party election, there was again no hint of their representing three of the seven political groups.
That alone qualified it as one of the ‘Rainbow coalitions’ (see below) in which I personally was particularly interested. But it transpired (local newspapers and social media, of course) that two more groups were part of this multi-party agreement, making it in effect and reality an anti-Labour coalition.
Why on earth, though, couldn’t even residents, never mind the rest of us, have these developments explained in sensible grown-up language? Well over 30 years ago, an INLOGOV colleague (now De Montfort Emeritus Professor Steve Leach) and I worked on a research project for the Government’s Widdicombe Committee on the Conduct of Local Authority Business, one secondary but important aim of which was to open up and normalise the role of politics, including party politics, in local government – to emphasise, indeed, that politics “are in fact the life blood of local government”, what local government is actually about – and to end the prissiness still sadly but obviously pervading the culture and corridors of some town halls.
Tantrum over, but the fact remains that extracting even this basic ‘Who governs?’ information from dozens of ‘hung’ or ‘No Overall Control’ (NOC) councils can be a real chore. Which in turn means that, even in a highly reputable House of Commons Library research briefing in late July, that’s how these ‘results’ indefinitely remain.
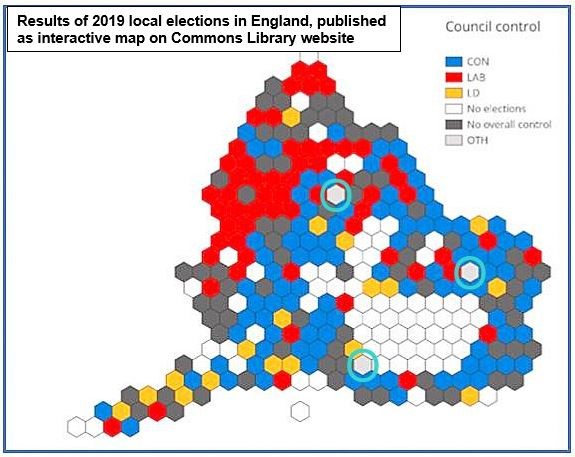
It was the map in that briefing, reproduced below, that finally prompted these two linked blogs, of which this is the first – protesting to the world at large, but particularly councils themselves, that election RESULTS, even colourfully and interactively presented, are not necessarily the same as OUTCOMES. Moreover, when they’re not, it is the outcomes that are ultimately more important and, I’d suggest, usually more interesting.
For the sake of those, like me, with ageing memories, I’ll start with a headline summary of the May results, which involved councils all or one-third of whose seats were previously contested in 2015. Conservatives again won most seats (3,559), but lost over 1,300 and thereby control of 55 of their 198 English councils. Labour, with 2,020 seats, also lost net councils, reducing their total to 91. Liberal Democrats won 1,351 seats, and doubled their English councils controlled from 11 to 23. Greens won 263 seats, easily their highest figure this century. UKIP took 34 seats, 167 fewer than in 2015.
Finally, and perhaps most remarkably, considering how heavily the electoral system is stacked against them, was the impact of the variegated so-called ‘Independents’ – with over 600 seat gains, control of the previously Conservative Uttlesford and Labour Ashfield councils, plus the Middlesbrough mayoralty.
Back, then, to the map. Uttlesford and Ashfield are there, in the vicinities of West Essex and Nottinghamshire, but their hexagons shaded an inappropriate grey, along with Epsom & Ewell, perpetually (well, since 1937) controlled by its Residents Associations. They deserve something far more distinctive – hence my added aquamarine rings – also more than a passing mention, but, as effectively majority party groups, they are not what these blogs are primarily about.
The appropriately white or empty boxes are councils without elections in this year’s cycle – mostly the London boroughs, but also councils undergoing ‘re-sizing’ by the Boundary Commission. Which leaves us with the profusion of black hexagons. There are 79 in this count, which includes elected mayoral and ‘Alternative Arrangements’ councils – far fewer than in the noughties when the Lib Dems were regularly winning a quarter of the vote, but still nearly one in every four elected councils, and still, in late-July, recorded as under ‘No Overall Control’.
It’s an unfortunate label. First, it’s much too close to, and certainly risks being interpreted as, ‘out of control’. Secondly, it carries (or at least did before Brexit) the suggestion that the narrowest single-party majority is somehow democratically superior to and operationally sounder than a necessarily negotiated partnership of two or more parties or groupings.
At the very least, it should be signalled, particularly by an affected council, as temporary. Which in turn should surely at the minimum mean the council communicating – along with ward results and within a couple of clicks from its website home page (to either ‘council governance’ or ‘councillors’) – the basic party arithmetic, that inter-party negotiations are in progress, and that final decisions will be taken at, and announced and explained immediately after, the council’s forthcoming Annual Meeting. Hardly rocket science, but the proportion of councils who manage it well remains disappointingly small.
Which is why I’ve sometimes attempted myself to tidy up these electoral loose ends and complete the picture. And why, particularly with all the talk of the party alliances that nationally might have got us somewhere over the past three years, and certainly have saved Westminster from being the laughing-stock of the EU, it seemed a good time to illustrate just how creative and adaptable local politicians can be when faced with potentially tricky post-election numbers.
The tables that conclude this first blog are unavoidably lengthy and, particularly with there apparent rainbow fixation, deliberately idiosyncratic. They have already appeared on the LSE’s Democratic Audit blog, and I would like to thank both LSE and particularly Alice Park for her invaluable advice and assistance. The table obviously constitutes the raw material for the second interpretative blog which will follow this one tomorrow.
Rainbow coalitions will feature prominently and require a final definitional word. However presented by the participants themselves – more frequently nowadays as ‘Alliances’, ‘Pacts’, or even a ‘Together Group’ (you know who you are!) – if there is an explicit working agreement involving at least three distinct groups, totalling 50%+1 council seats, that here is a Rainbow COALITION; no majority, and it’s a coalition.
RESULTS AND OUTCOMES OF MAY 2019 LOCAL ELECTIONS


 Chris Game is a Visiting Lecturer at INLOGOV interested in the politics of local government; local elections, electoral reform and other electoral behaviour; party politics; political leadership and management; member-officer relations; central-local relations; use of consumer and opinion research in local government; the modernisation agenda and the implementation of executive local government.
With thanks to Democratic Audit for allowing the reproduction of portions of this blog.
The views expressed in this blog are those of the author and not INLOGOV or the University of Birmingham.
