Chris Game
Someone asked me recently if, in those opinion polls that regularly monitor these things, net satisfaction with the government’s record was ever positive. In other words, are there ever nowadays more of us satisfied than dissatisfied with those who govern us, or have we become, on balance, a nation of malcontents, whoever we happen to have elected?
There are in fact two very easy Yes answers, although for one it probably helps to be pushing 40 or more – old enough, anyway, to remember 1997 and those halcyon, honeymoon days of New Labour and Tony Blair. Ipsos MORI, who have been doing these monitoring polls for decades, had for the preceding three years been logging net DISsatisfaction rates for the Major Government of between 50 and 70%. Then suddenly there were more of us pleased with the Blair Government’s early performance than had voted Labour – net satisfaction rates of over 30%, and for Blair personally over 50%.
Blair’s net positive ratings lasted a remarkable three years, although the Government went into the red, as it were, several months earlier. We’re inclined, though, to allow any new Government some honeymoon period, so at the end of the first fortnight of the Coalition in June 2010 it had a net satisfaction rating of 10%, Cameron one of 31%, and Nick Clegg a never-to-be-remotely-repeated 26%. This, though, was to be little more than a honeymonth, and by September Ipsos MORI were recording a Government net dissatisfaction figure of 4% and by November 20% – as it happens, almost exactly where it is now, and considerably better than it’s managed throughout the past two years.
It was easy to understand, then, what had prompted the question. But personally it took me back to when I used in lectures to make an admittedly cheap debating point about the respective satisfaction ratings that survey respondents give to their local councils and to the national government, regardless of its political complexion. It’s patently obvious, of course, that when people are asked about their satisfaction “with the way your council runs things” and with “the way the Government is running the country”, they are not in their own minds comparing like with like. However, it still comes as a surprise to many just how relatively well local government invariably comes out in such comparisons, however dubious they may be.
I wrote in these columns two years ago about how, filling the gap left by the Government’s scrapping of the Comprehensive Area Assessment’s Place Survey, we now have LG Inform, the LGA’s benchmarking data service for councils and fire and rescue authorities. Local authorities, and eventually the public, would be able to have easy access to resident satisfaction data about councils and their areas, enabling them, if they wished, to make comparisons with other councils.
It’s taken some time, not least because the LGA stipulates that the public don’t get access to the survey findings until at least a year after the end of the financial year in which they’re collected. This means that the first summary report of results, published in the September 2014 LGA Analysis and Research Bulletin (p.9) is of surveys of various types conducted between October 2012 and March 2013.
As described in my previous blog, Ipsos MORI are responsible for the methodology involved in the collection, presentation and usage of these benchmarking resident satisfaction data and they rightly emphasise how the mode of data collection can have a marked impact on results. They insist, therefore, that any findings should be presented alongside those from other authorities only when collected by the same method – postal/online, telephone, or face-to-face – and that only like-for-like data should be compared across councils.
My own summary in the accompanying table somewhat breaches this code, but for illustrative purposes only. In addition to exemplifying the benchmarking exercise by showing some of the key findings, I wanted to see, insofar as the arbitrary selection of authorities would allow, whether the different modes of data collection did seem to influence the results.
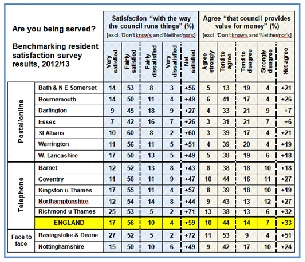
First impressions suggest they do, the more personalised or interactive modes based mostly on quota samples producing slightly friendlier responses than the postal/online surveys based on random samples. Taking account, though, of the profiles of the respective sets of authorities, the difference is not perhaps as great as might have been imagined.
As with any set of results about anything nowadays, it’s obligatory to leap in with cautions about there being absolutely no room for complacency. Still, national ratings of 59% net satisfaction with councils and 33% net agreement that they provide VFM, following two of the most savage financial settlements inflicted on local government, suggests that large numbers of them, at least, must be doing something right – just as a national government’s consistently large negative ratings might also suggest that it’s getting the odd thing wrong.
Since the main purpose of this blog is to draw colleagues’ attention to the benchmarking exercise, I should conclude by saying a bit more about it. The best things in life are said to come in threes, and that’s certainly the case here. As well as the three modes of data gathering, there are three tiers of recommended benchmarking questions. The core or priority set comprises, yes, three: the two in my table, preceded by one on satisfaction “with your local area as a place to live”.
The second tier set of another three – a likely priority for most, but not all, councils – ask how well informed you think your council keeps residents about the services and benefits it provides, how strongly you feel you belong to your local area, and how safe you feel when outside in your local area (a) after dark, and (b) during the day.
The third tier questions, likely to be of interest to some councils only, are a bit of a mix. There’s a 7-tier anti-social behaviour question, and one on whether you trust your local council, but what particularly caught my eye was one asked by Bournemouth and Darlington, asking respondents whether they spoke positively or negatively about their council (a) if asked, and (b) without being asked. Taking both responses together, the positives again outnumbered the negatives, and, if only about one in 20 confessed to running around the streets of their respective towns spontaneously cheerleading for the council, well – to adapt the Dr Johnson quote about women preaching and dogs walking on their hind legs – it’s pleasing to learn of it being done at all.

Chris Game is a Visiting Lecturer at INLOGOV interested in the politics of local government; local elections, electoral reform and other electoral behaviour; party politics; political leadership and management; member-officer relations; central-local relations; use of consumer and opinion research in local government; the modernisation agenda and the implementation of executive local government.
